Evaluation Global Climatology Biases CMIP6
CMIP6 Multi-Model Mean Context
Comparison with CMIP6 ensemble mean from 11 members.
Contributing models: ACCESS-ESM1-5, AWI-CM-1-1-MR, CNRM-CM6-1, CNRM-ESM2-1, EC-Earth3, FGOALS-g3, GISS-E2-1-G, INM-CM5-0, IPSL-CM6A-LR, MPI-ESM1-2-LR, MRI-ESM2-0
Synthesis
Related diagnostics
Total Cloud Cover Annual Mean Bias
| Variables | clt |
|---|---|
| Models | IFS-FESOM2-SR, IFS-NEMO-ER, ICON-ESM-ER, CMIP6 MMM, MPI-ESM1-2-LR/r1i1p1f1, GISS-E2-1-G/r1i1p1f2, IPSL-CM6A-LR/r1i1p1f1, ACCESS-ESM1-5/r1i1p1f1, EC-Earth3/r1i1p1f1, CNRM-CM6-1/r1i1p1f2, AWI-CM-1-1-MR/r1i1p1f1, CNRM-ESM2-1/r1i1p1f2, FGOALS-g3/r1i1p1f1, INM-CM5-0/r1i1p1f1, MRI-ESM2-0/r1i1p1f1 |
| Reference Dataset | ERA5 |
| Units | % |
| Period | 1980–2014 |
| IFS-FESOM2-SR | Global Mean Bias: 1.40 · Rmse: 4.90 |
| IFS-NEMO-ER | Global Mean Bias: 2.36 · Rmse: 4.85 |
| ICON-ESM-ER | Global Mean Bias: 2.05 · Rmse: 9.41 |
| CMIP6 MMM | Global Mean Bias: -0.47 · Rmse: 5.43 |
| MPI-ESM1-2-LR/r1i1p1f1 | Global Mean Bias: -0.19 · Rmse: 6.78 |
| GISS-E2-1-G/r1i1p1f2 | Global Mean Bias: -2.98 · Rmse: 11.22 |
| IPSL-CM6A-LR/r1i1p1f1 | Global Mean Bias: -1.14 · Rmse: 10.13 |
| ACCESS-ESM1-5/r1i1p1f1 | Global Mean Bias: 2.36 · Rmse: 8.39 |
| EC-Earth3/r1i1p1f1 | Global Mean Bias: 1.28 · Rmse: 5.44 |
| CNRM-CM6-1/r1i1p1f2 | Global Mean Bias: 0.89 · Rmse: 9.49 |
| AWI-CM-1-1-MR/r1i1p1f1 | Global Mean Bias: -3.02 · Rmse: 6.99 |
| CNRM-ESM2-1/r1i1p1f2 | Global Mean Bias: 0.87 · Rmse: 9.66 |
| FGOALS-g3/r1i1p1f1 | Global Mean Bias: -9.37 · Rmse: 14.80 |
| INM-CM5-0/r1i1p1f1 | Global Mean Bias: 7.06 · Rmse: 11.80 |
| MRI-ESM2-0/r1i1p1f1 | Global Mean Bias: -0.93 · Rmse: 7.54 |
Summary high
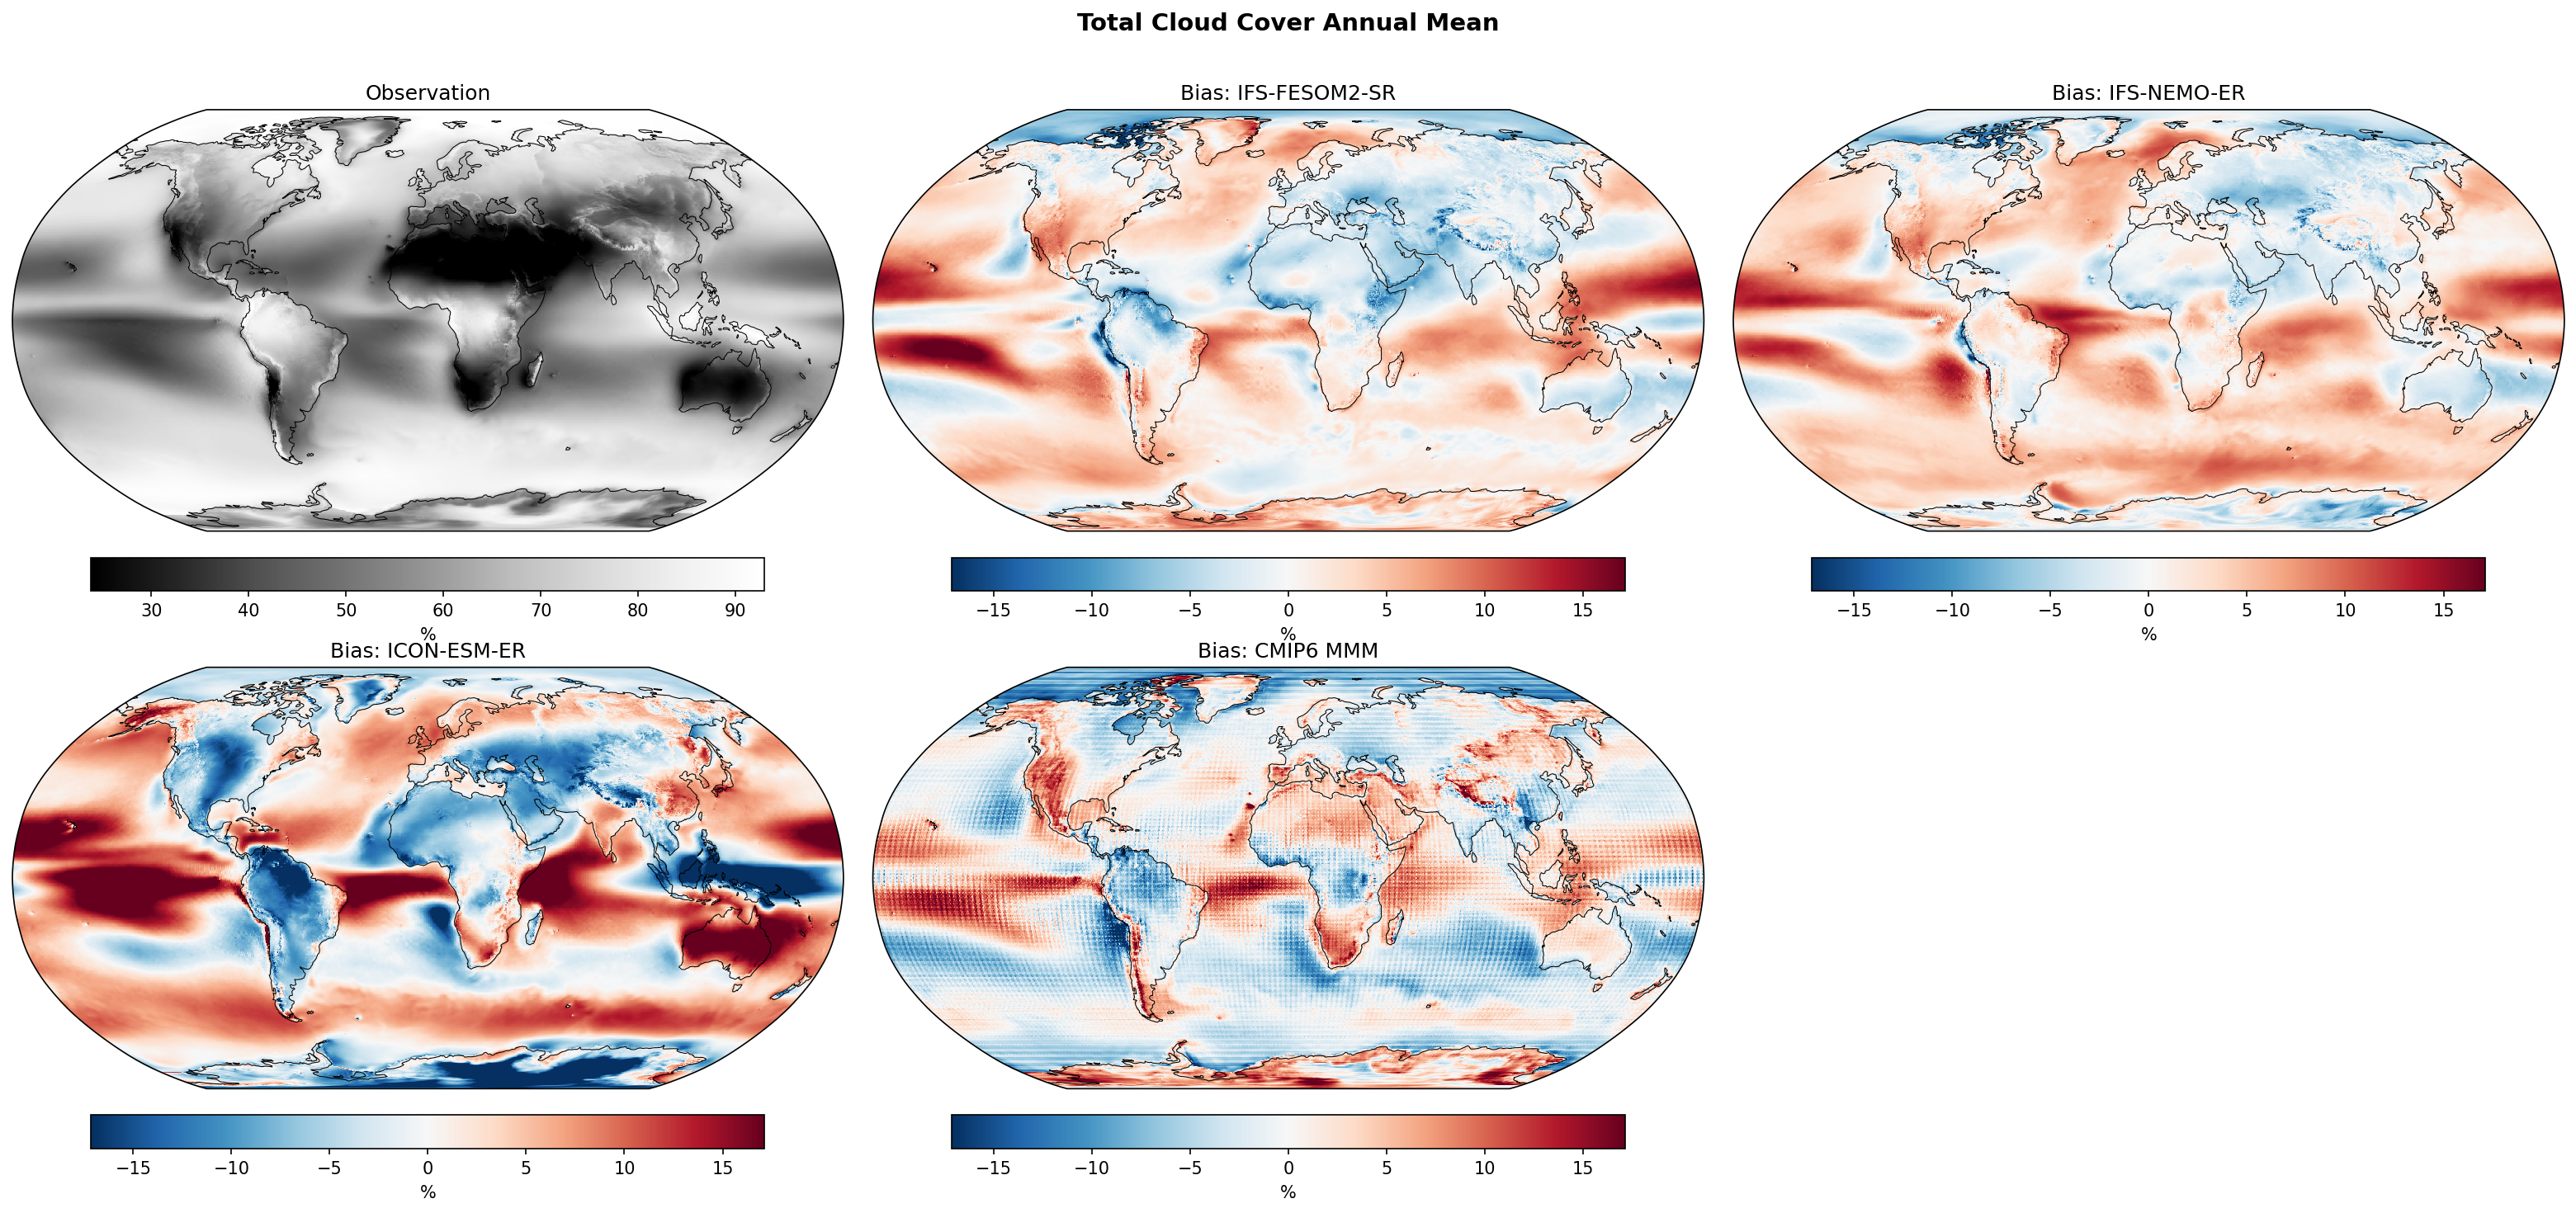
The figure evaluates annual mean Total Cloud Cover biases relative to ERA5, revealing that the high-resolution IFS models significantly outperform ICON-ESM-ER and the CMIP6 Multi-Model Mean.
Key Findings
- IFS-FESOM2-SR and IFS-NEMO-ER show the best agreement with observations, achieving the lowest RMSEs (~4.9%) and generally mild biases, improving upon the CMIP6 MMM (RMSE 5.4%).
- ICON-ESM-ER performs relatively poorly (RMSE 9.4%), exhibiting widespread underestimation of cloud cover over subtropical oceans and overestimation over tropical land masses.
- A systematic 'too few stratocumulus' bias is evident across most models (visible as negative bias patches off the coasts of Peru, Namibia, and California), though this is less severe in the IFS simulations compared to CMIP6 models.
Spatial Patterns
IFS models display a diffuse, slightly positive bias pattern over most oceans, with localized negative biases in eastern boundary upwelling regions. In contrast, ICON-ESM-ER shows a stark land-sea contrast: strong positive biases over tropical rainforests (Amazon, Congo, Maritime Continent) and deep negative biases over the subtropical oceans. The CMIP6 ensemble shows immense spread, ranging from the globally cloud-deficient FGOALS-g3 (-9.4% bias) to the cloud-excessive INM-CM5-0 (+7.1% bias).
Model Agreement
There is exceptionally high agreement between the two IFS variants (FESOM2 vs NEMO), indicating that the ocean model formulation has negligible impact on total cloud cover compared to the shared atmospheric physics. Inter-model spread is large, with IFS separating clearly from the rest of the ensemble in terms of fidelity.
Physical Interpretation
The persistent negative bias in stratocumulus regions highlights a common deficiency in parameterizing boundary layer clouds and turbulence in subsidence regimes. The superior performance of IFS likely stems from its operational NWP-tuned cloud physics, which capture these regimes better than the physics configuration used in ICON-ESM-ER. The strong land-ocean bias contrast in ICON suggests potential issues with convective parameterization or land-surface coupling.
Caveats
- Biases are calculated relative to ERA5 reanalysis, which itself relies on model physics to generate cloud fields, although constrained by observations.
- Total cloud cover diagnostics are sensitive to overlap assumptions (e.g., random vs. maximum-random) used when vertically integrating cloud fraction.
Total Cloud Cover DJF Bias
| Variables | clt |
|---|---|
| Models | IFS-FESOM2-SR, IFS-NEMO-ER, ICON-ESM-ER, CMIP6 MMM, MPI-ESM1-2-LR/r1i1p1f1, GISS-E2-1-G/r1i1p1f2, IPSL-CM6A-LR/r1i1p1f1, ACCESS-ESM1-5/r1i1p1f1, EC-Earth3/r1i1p1f1, CNRM-CM6-1/r1i1p1f2, AWI-CM-1-1-MR/r1i1p1f1, CNRM-ESM2-1/r1i1p1f2, FGOALS-g3/r1i1p1f1, INM-CM5-0/r1i1p1f1, MRI-ESM2-0/r1i1p1f1 |
| Reference Dataset | ERA5 |
| Units | % |
| Period | 1980–2014 |
| CMIP6 MMM | Global Mean Bias: 0.06 · Rmse: None |
| MPI-ESM1-2-LR/r1i1p1f1 | Global Mean Bias: -0.47 · Rmse: None |
| GISS-E2-1-G/r1i1p1f2 | Global Mean Bias: -2.07 · Rmse: None |
| IPSL-CM6A-LR/r1i1p1f1 | Global Mean Bias: 0.14 · Rmse: None |
| ACCESS-ESM1-5/r1i1p1f1 | Global Mean Bias: 3.35 · Rmse: None |
| EC-Earth3/r1i1p1f1 | Global Mean Bias: 1.06 · Rmse: None |
| CNRM-CM6-1/r1i1p1f2 | Global Mean Bias: 1.88 · Rmse: None |
| AWI-CM-1-1-MR/r1i1p1f1 | Global Mean Bias: -2.63 · Rmse: None |
| CNRM-ESM2-1/r1i1p1f2 | Global Mean Bias: 1.79 · Rmse: None |
| FGOALS-g3/r1i1p1f1 | Global Mean Bias: -9.89 · Rmse: None |
| INM-CM5-0/r1i1p1f1 | Global Mean Bias: 7.82 · Rmse: None |
| MRI-ESM2-0/r1i1p1f1 | Global Mean Bias: -0.36 · Rmse: None |
Summary high
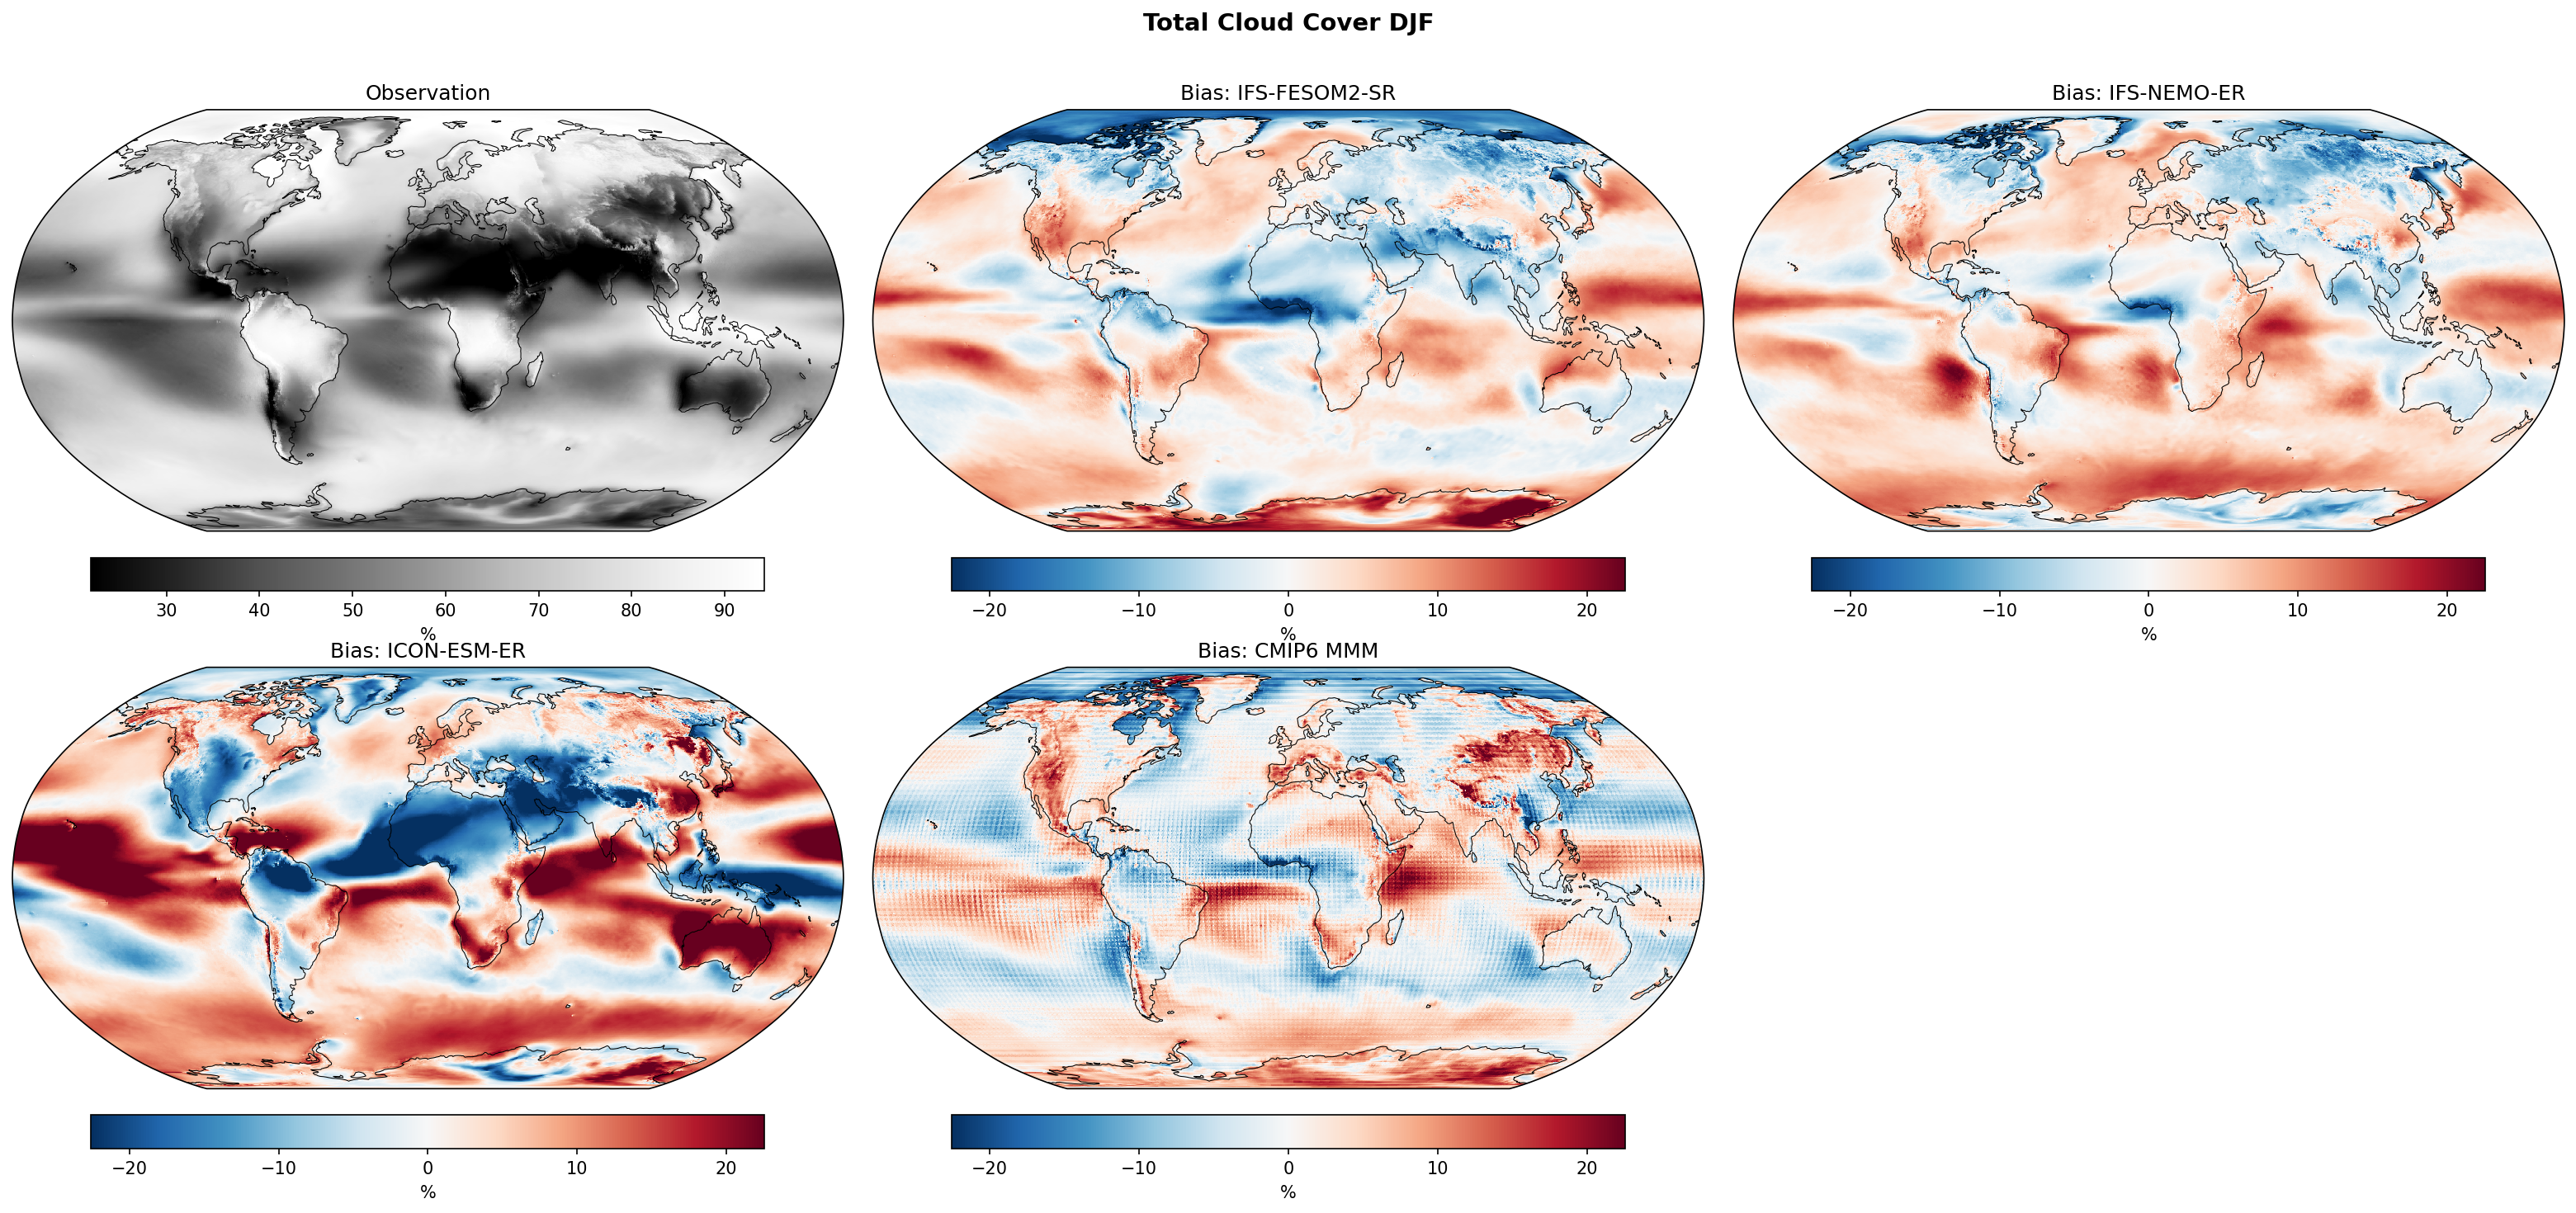
This diagnostic evaluates DJF Total Cloud Cover biases relative to ERA5 for high-resolution EERIE models (IFS and ICON) compared to the CMIP6 ensemble. The IFS models generally show moderate biases that improve upon the specific regional deficiencies of the CMIP6 Multi-Model Mean, whereas ICON-ESM-ER exhibits a distinct, strong positive cloud cover bias globally, particularly in the Southern Hemisphere.
Key Findings
- IFS-FESOM2-SR and IFS-NEMO-ER show nearly identical bias patterns, with moderate positive biases in subtropical eastern oceans and negative biases along the ITCZ, suggesting atmospheric physics dominates over ocean coupling differences.
- ICON-ESM-ER displays widespread positive cloud cover biases (>20%) significantly exceeding the IFS models, most notably over the Southern Ocean and subtropical gyres.
- The CMIP6 Multi-Model Mean exhibits a classic negative bias in eastern boundary stratocumulus regions (e.g., off Peru, Namibia); interestingly, the high-resolution IFS models reverse this to a positive bias, suggesting strong low-cloud formation in these simulations.
Spatial Patterns
A systematic negative bias (blue) along the ITCZ and Maritime Continent is present in EERIE models and the CMIP6 MMM, indicating under-represented convective cloud extent. In contrast, the Southern Ocean shows divergent behaviors: moderate mixed biases in IFS, but strong positive biases (red) in ICON and several CMIP6 models (e.g., ACCESS-ESM1-5). Subtropical eastern boundary regions shift from negative bias in CMIP6 MMM to positive bias in IFS models.
Model Agreement
There is extremely high agreement between the two IFS variants (FESOM2 vs NEMO), indicating that the ocean grid choice has minimal immediate impact on total cloud cover biases. In contrast, the CMIP6 ensemble shows massive divergence, with global mean biases ranging from ~-10% (FGOALS-g3, severe underestimation) to ~+8% (INM-CM5-0, severe overestimation). The EERIE models generally lie within this range but show spatially distinct structures.
Physical Interpretation
The pervasive negative bias in the ITCZ suggests that convective parameterizations may be underestimating the areal extent of deep convection or associated anvil cirrus (detrainment). The shift from negative (CMIP6) to positive (IFS) bias in stratocumulus regions implies that the IFS high-resolution physics or tuning generates significantly more persistent boundary layer clouds, potentially overcorrecting the common 'too few stratocumulus' bias. The excess cloudiness in ICON over the Southern Ocean suggests issues with cyclonic cloud generation or mixed-phase cloud microphysics holding too much liquid/ice.
Caveats
- ERA5 is a reanalysis product; while it assimilates satellite data, it is model-dependent, especially in data-sparse regions like the Southern Ocean or during polar nights.
- Biases are shown for DJF only; seasonal shifts in ITCZ or sea ice extent could alter these patterns in other seasons.
Total Cloud Cover JJA Bias
| Variables | clt |
|---|---|
| Models | IFS-FESOM2-SR, IFS-NEMO-ER, ICON-ESM-ER, CMIP6 MMM, MPI-ESM1-2-LR/r1i1p1f1, GISS-E2-1-G/r1i1p1f2, IPSL-CM6A-LR/r1i1p1f1, ACCESS-ESM1-5/r1i1p1f1, EC-Earth3/r1i1p1f1, CNRM-CM6-1/r1i1p1f2, AWI-CM-1-1-MR/r1i1p1f1, CNRM-ESM2-1/r1i1p1f2, FGOALS-g3/r1i1p1f1, INM-CM5-0/r1i1p1f1, MRI-ESM2-0/r1i1p1f1 |
| Reference Dataset | ERA5 |
| Units | % |
| Period | 1980–2014 |
| CMIP6 MMM | Global Mean Bias: -1.08 · Rmse: None |
| MPI-ESM1-2-LR/r1i1p1f1 | Global Mean Bias: -0.17 · Rmse: None |
| GISS-E2-1-G/r1i1p1f2 | Global Mean Bias: -4.22 · Rmse: None |
| IPSL-CM6A-LR/r1i1p1f1 | Global Mean Bias: -2.76 · Rmse: None |
| ACCESS-ESM1-5/r1i1p1f1 | Global Mean Bias: 1.32 · Rmse: None |
| EC-Earth3/r1i1p1f1 | Global Mean Bias: 1.37 · Rmse: None |
| CNRM-CM6-1/r1i1p1f2 | Global Mean Bias: -0.03 · Rmse: None |
| AWI-CM-1-1-MR/r1i1p1f1 | Global Mean Bias: -3.26 · Rmse: None |
| CNRM-ESM2-1/r1i1p1f2 | Global Mean Bias: -0.07 · Rmse: None |
| FGOALS-g3/r1i1p1f1 | Global Mean Bias: -8.37 · Rmse: None |
| INM-CM5-0/r1i1p1f1 | Global Mean Bias: 5.68 · Rmse: None |
| MRI-ESM2-0/r1i1p1f1 | Global Mean Bias: -1.50 · Rmse: None |
Summary high
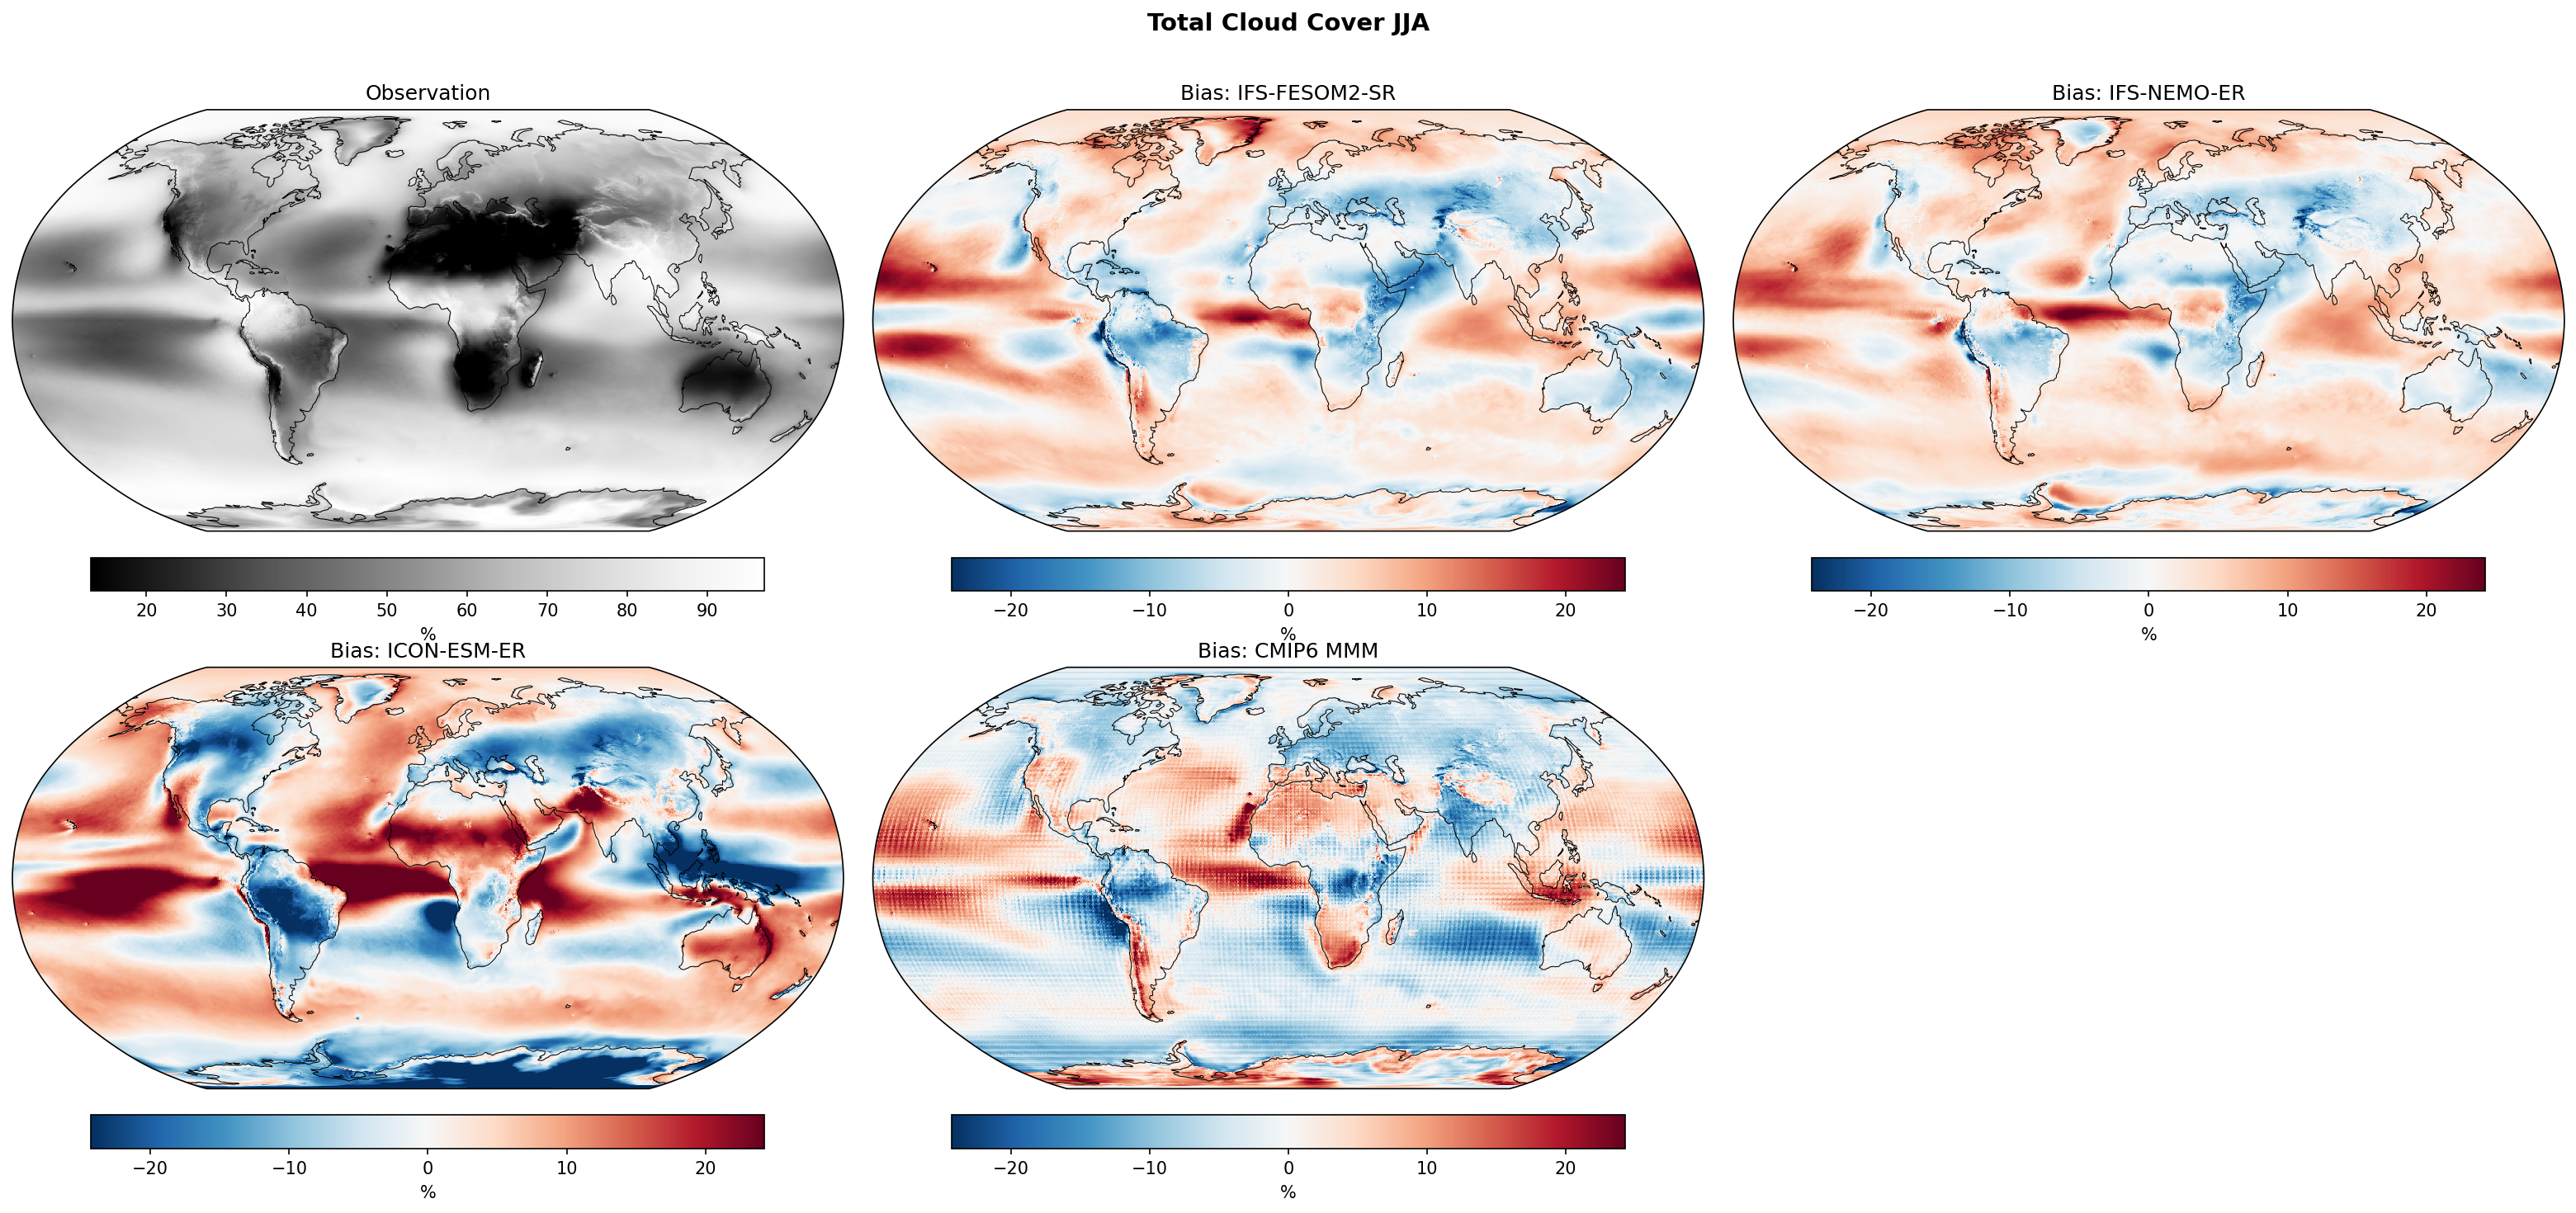
This figure evaluates JJA Total Cloud Cover biases relative to ERA5 for three high-resolution EERIE models (IFS-FESOM2-SR, IFS-NEMO-ER, ICON-ESM-ER) alongside the CMIP6 Multi-Model Mean and individual CMIP6 members. The analysis highlights distinct regional bias patterns in the EERIE models, particularly contrasting the IFS and ICON families.
Key Findings
- The two IFS-based models (IFS-FESOM2-SR and IFS-NEMO-ER) exhibit nearly identical bias patterns, indicating that the ocean model coupling (FESOM vs NEMO) has minimal impact on atmospheric cloud biases.
- ICON-ESM-ER displays severe negative biases in Eastern Boundary Upwelling Systems (off Peru, Namibia, California), indicative of a 'missing stratocumulus' problem common in lower-resolution models, which is less pronounced in the IFS models.
- IFS models show a notable negative cloud cover bias over Northern Hemisphere land (Eurasia, North America) during summer, which implies excessive solar heating at the surface.
- CMIP6 models show a massive spread in global cloudiness, ranging from strong negative biases (FGOALS-g3, ~-8.4%) to strong positive biases (INM-CM5-0, ~+5.7%), with EERIE models generally falling closer to the observational mean.
Spatial Patterns
IFS models show a distinct positive bias over high-latitude oceans (North Atlantic, North Pacific, Arctic) and the Southern Ocean, contrasted with negative biases over continental interiors (Europe, Asia) and the Indian Monsoon region. ICON-ESM-ER is characterized by sharp negative biases in tropical/subtropical stratocumulus decks and strong positive biases in the Southern Ocean and parts of the tropical Pacific. The Intertropical Convergence Zone (ITCZ) region shows complex dipole biases in most models, suggesting latitudinal shifts or width errors.
Model Agreement
There is exceptionally high agreement between the two IFS variants, confirming atmospheric physics dominates the cloud solution over ocean coupling. There is low agreement between IFS and ICON, which have nearly opposite biases in stratocumulus regions. The EERIE models fall within the envelope of CMIP6 diversity but do not converge to a single 'high-resolution' solution.
Physical Interpretation
The negative bias over NH land in IFS suggests deficiencies in continental convection or land-atmosphere coupling (e.g., drying out too fast, inhibiting cloud formation), likely driving warm surface biases. The 'missing stratocumulus' in ICON points to issues in boundary layer parameterization or vertical resolution/inversion strength handling, failing to maintain marine decks. The positive high-latitude biases in IFS may result from excessive moisture transport or issues with mixed-phase cloud microphysics.
Caveats
- ERA5 is a reanalysis product, which itself relies on a model and may have biases in cloud fraction definition compared to satellite retrievals (e.g., CALIPSO/CloudSat).
- Cloud cover definitions (thresholds for cloud fraction) may vary between the models and the reanalysis verification.
Surface Latent Heat Flux Annual Mean Bias
| Variables | hfls |
|---|---|
| Models | IFS-FESOM2-SR, IFS-NEMO-ER, ICON-ESM-ER |
| Reference Dataset | ERA5 |
| Units | W/m2 |
| Period | 1980–2014 |
| IFS-FESOM2-SR | Global Mean Bias: 3.13 · Rmse: 11.77 |
| IFS-NEMO-ER | Global Mean Bias: 1.20 · Rmse: 10.00 |
| ICON-ESM-ER | Global Mean Bias: 3.90 · Rmse: 16.09 |
Summary high
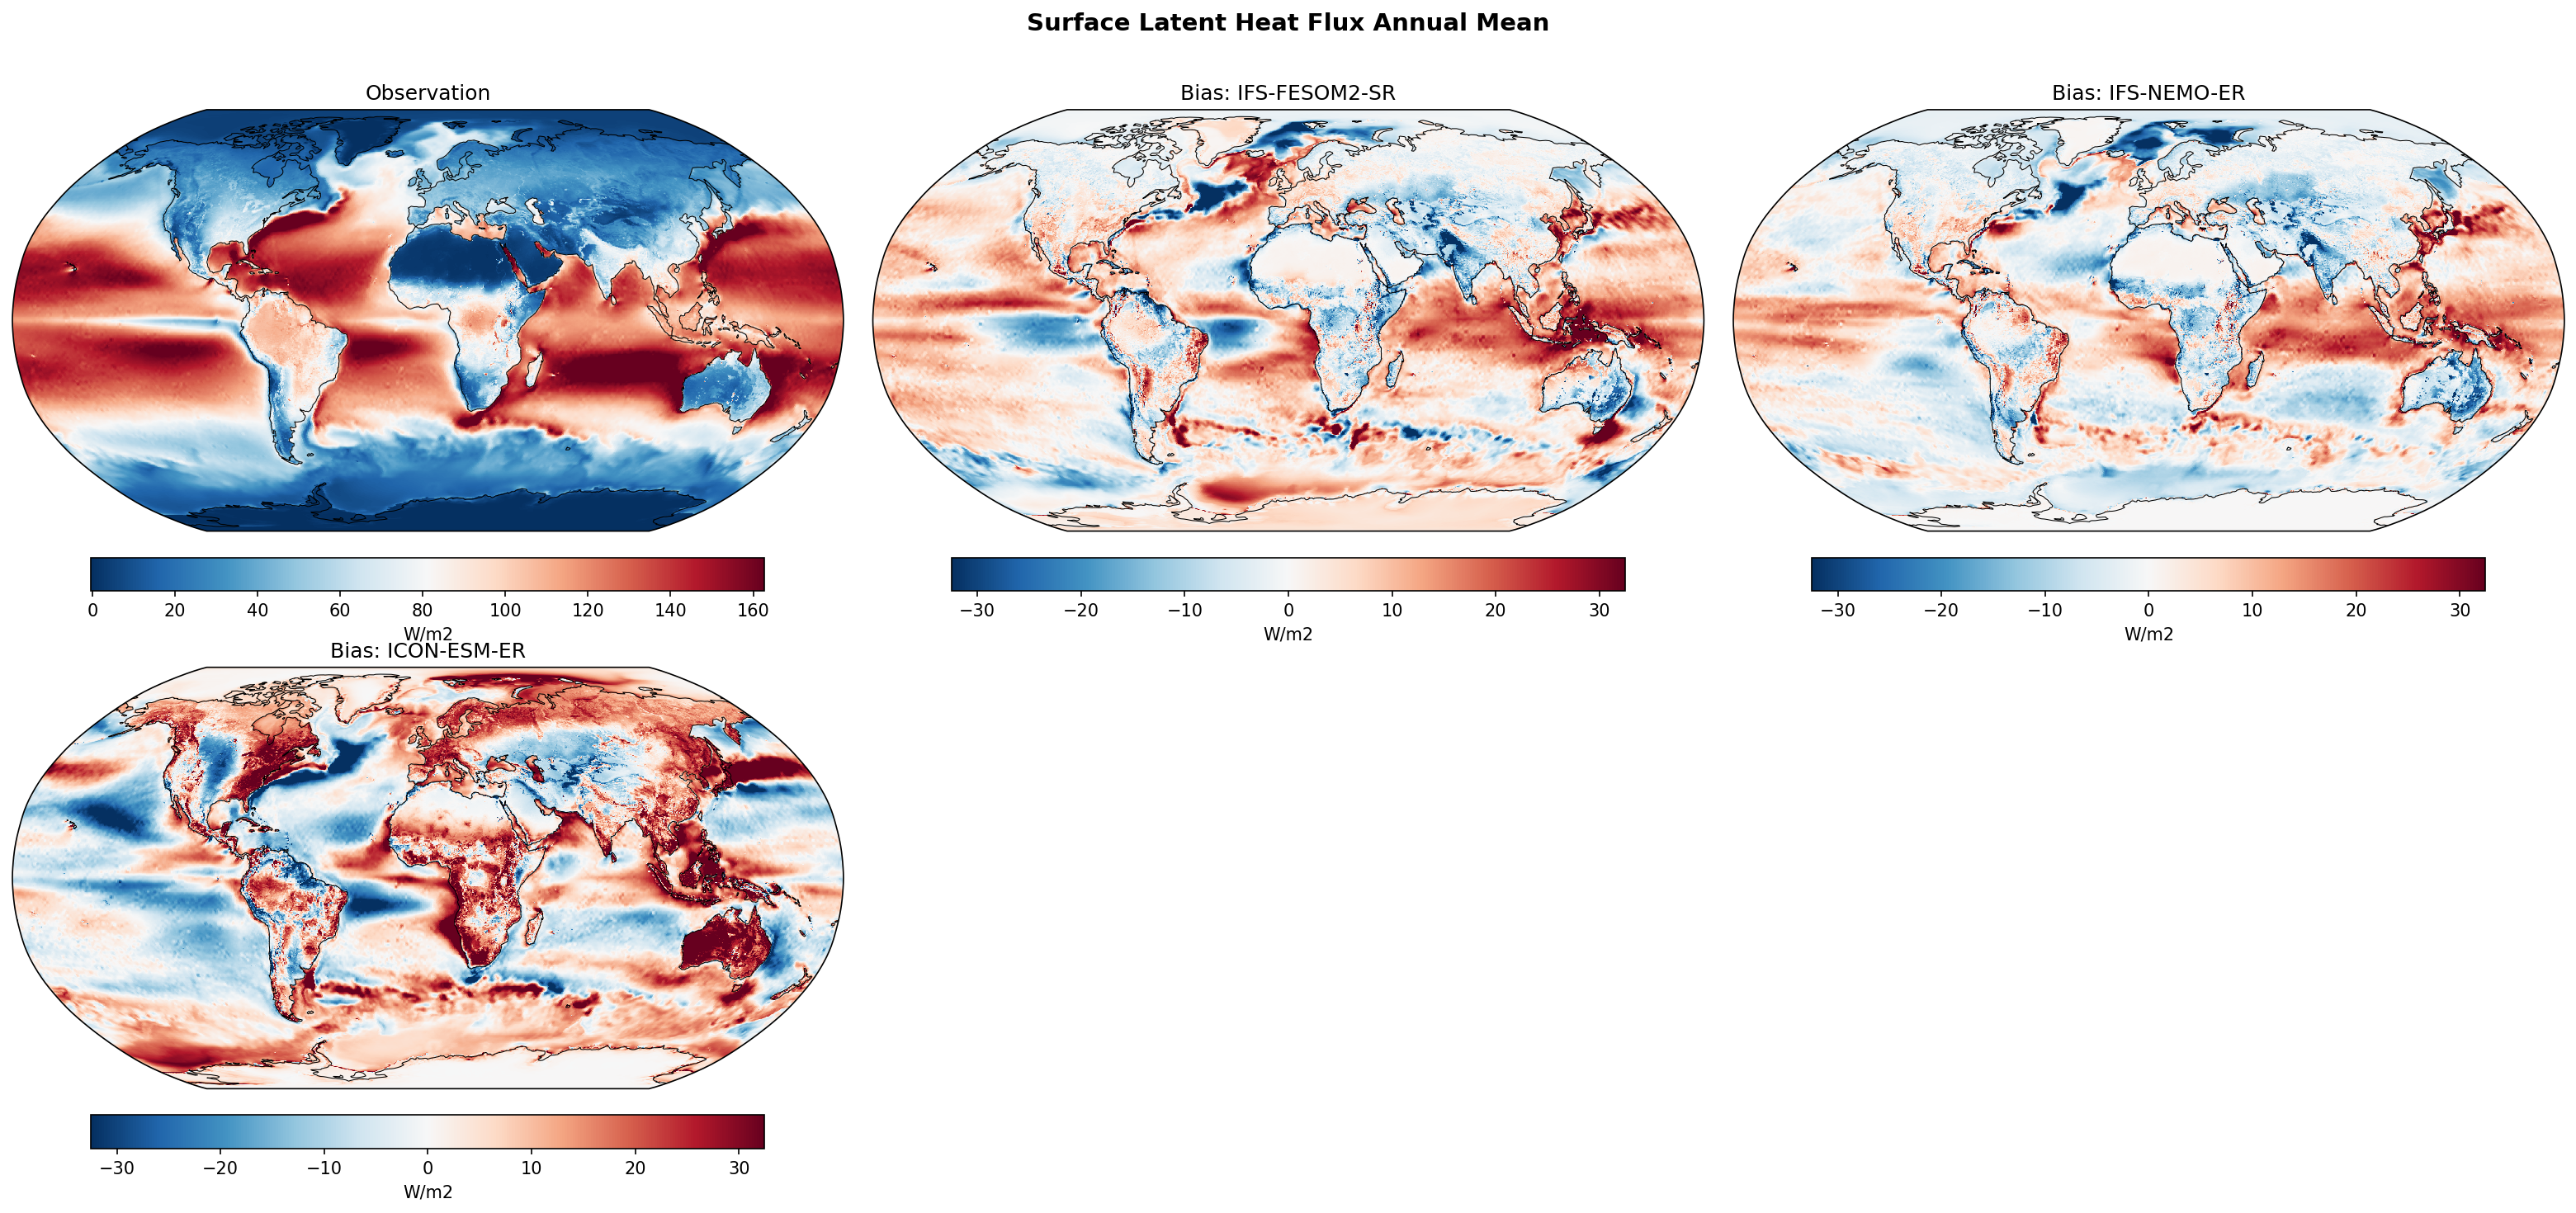
The figure evaluates annual mean surface latent heat flux biases in three high-resolution climate models relative to ERA5 reanalysis for the period 1980–2014. While all models exhibit a positive global mean bias (1.2 to 3.9 W/m²), spatial patterns differ significantly, with IFS-NEMO-ER showing the lowest RMSE and ICON-ESM-ER exhibiting large systematic errors over land.
Key Findings
- ICON-ESM-ER displays a distinct and pervasive positive bias over land surfaces globally, with errors exceeding +30 W/m² in the Amazon and Congo basins, indicating excessive evapotranspiration.
- IFS-NEMO-ER achieves the best agreement with ERA5 (lowest RMSE of 10.0 W/m² and lowest global bias of +1.2 W/m²), though it features a prominent negative bias patch in the North Atlantic subpolar gyre.
- Both IFS-based models (NEMO and FESOM2) share similar spatial bias structures, suggesting atmospheric physics dominance, whereas ICON shows unique features like strong negative biases in eastern tropical ocean upwelling regions.
Spatial Patterns
The IFS models show negative biases in the North Atlantic subpolar gyre and positive biases in the tropical Pacific and Southern Ocean. ICON contrasts sharply with strong positive biases over almost all land masses and the Southern Ocean, and negative biases in the eastern Pacific and Atlantic cold tongue regions.
Model Agreement
The two IFS variants (IFS-FESOM2-SR and IFS-NEMO-ER) show high structural agreement, diverging primarily in the details of the North Atlantic and Southern Ocean. ICON-ESM-ER is an outlier, particularly in its land surface treatment and tropical ocean zonal gradients.
Physical Interpretation
Ocean biases likely track SST errors; the negative North Atlantic bias corresponds to the common 'cold hole' problem where cold SSTs suppress evaporation. ICON's positive land bias points to overactive evapotranspiration in its land-surface scheme. The negative bias in ICON's eastern tropical oceans suggests a 'cold tongue' bias (SST too cold) or insufficient vertical mixing.
Caveats
- ERA5 is a reanalysis product rather than direct observation, meaning it also relies on model physics for flux parameterization.
- Biases in latent heat flux are coupled to both SST/surface moisture and atmospheric state (wind/humidity), making causal attribution complex without separate SST bias maps.
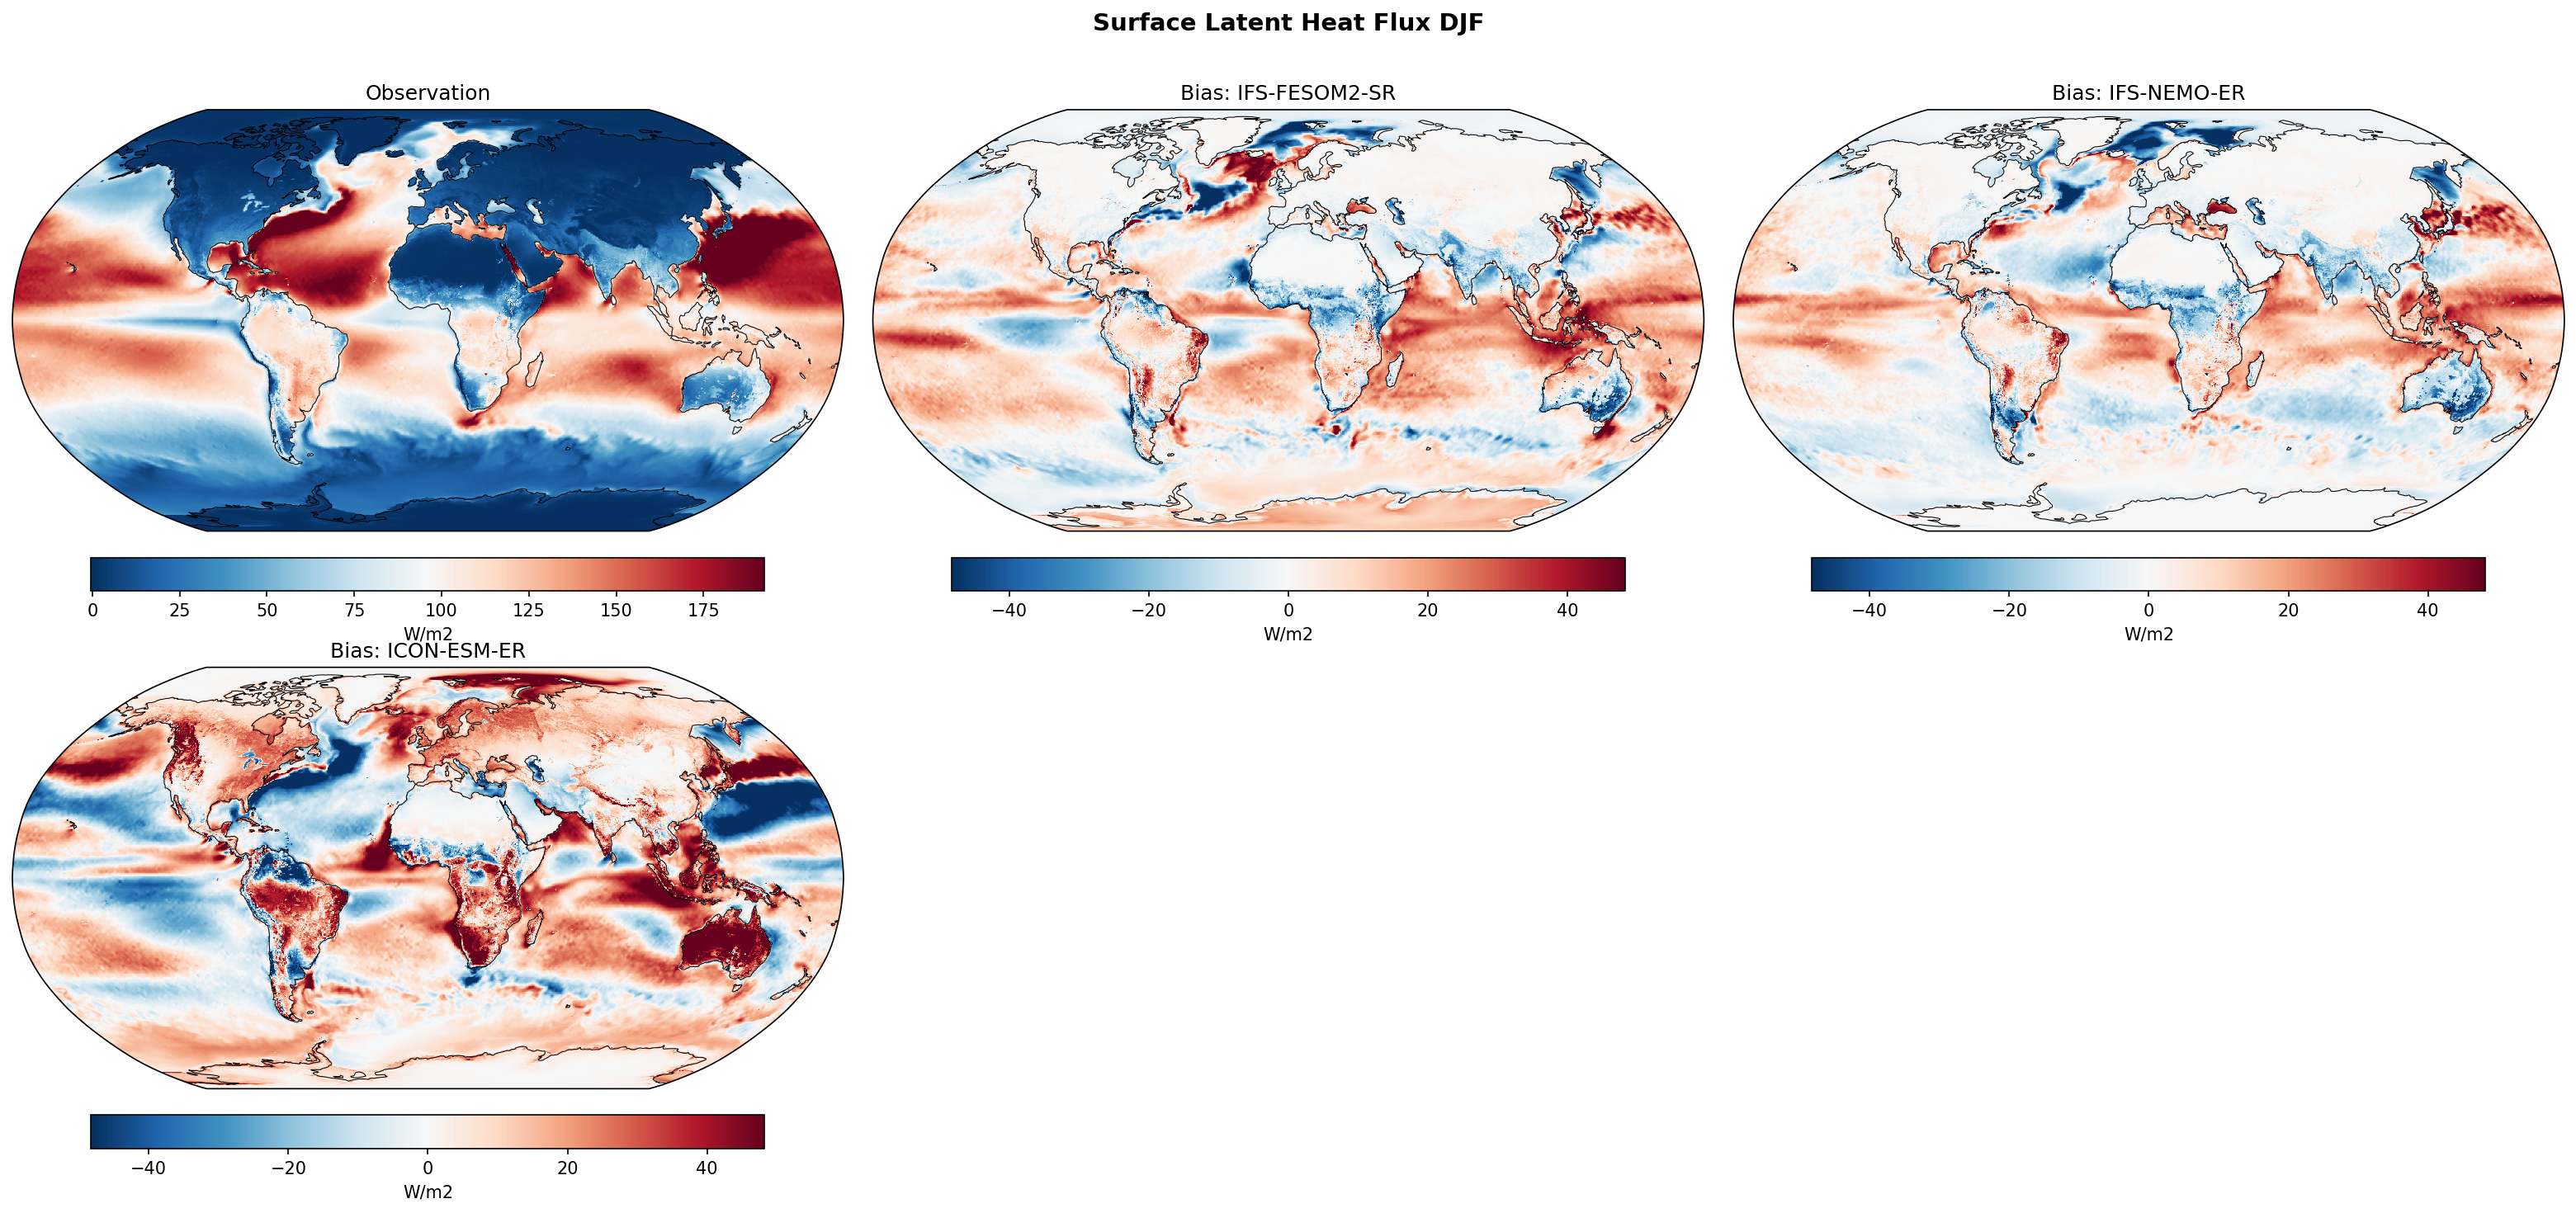
Surface Latent Heat Flux DJF Bias
| Variables | hfls |
|---|---|
| Models | IFS-FESOM2-SR, IFS-NEMO-ER, ICON-ESM-ER |
| Reference Dataset | ERA5 |
| Units | W/m2 |
| Period | 1980–2014 |
Summary high
This diagnostic compares DJF Surface Latent Heat Flux (LHF) biases relative to ERA5. The two IFS-based models exhibit similar, regionally localized bias patterns driven by atmospheric circulation features, whereas ICON-ESM-ER shows a widespread, strong positive bias across the global subtropics and Southern Hemisphere landmasses.
Key Findings
- IFS-FESOM2-SR and IFS-NEMO-ER display high similarity in bias patterns, indicating the dominant role of the shared IFS atmospheric component over ocean model differences.
- ICON-ESM-ER exhibits a systematic, globally pervasive positive LHF bias (excessive evaporation) over subtropical oceans and Southern Hemisphere land areas (Australia, South America, Southern Africa), frequently exceeding +40 W/m².
- The IFS models show distinct positive biases along the Gulf Stream and Kuroshio extensions, suggesting western boundary current path shifts or SST biases relative to ERA5, alongside negative biases in the tropical Indian and West Pacific oceans.
Spatial Patterns
The IFS models feature a mix of positive biases in the extratropical storm tracks (particularly North Atlantic) and negative biases in the tropical warm pools. In contrast, ICON-ESM-ER is dominated by positive biases throughout the subtropics (30°S–30°N) and over summer-hemisphere continents, with a localized region of negative bias in the North Atlantic subpolar gyre.
Model Agreement
There is strong agreement between the two IFS configurations (FESOM and NEMO), but significant divergence between the IFS family and ICON-ESM-ER. ICON is substantially more evaporative globally than the IFS models and ERA5.
Physical Interpretation
The shared biases in IFS models point to atmospheric drivers, likely related to wind speed errors or boundary layer humidity parameterizations in the IFS physics. The pronounced positive bias in ICON suggests a systematic issue with the bulk aerodynamic transfer coefficients, surface roughness lengths, or a generally too-dry planetary boundary layer maximizing the air-sea humidity gradient. The strong land bias in ICON during SH summer implies excessive evapotranspiration, potentially linked to soil moisture initialization or land-surface coupling strength.
Caveats
- ERA5 fluxes are model-derived products (reanalysis) rather than direct observations, meaning biases represent differences between model physics packages.
- The strong positive biases in ICON might be partially compensated by sensible heat flux or radiative biases not shown here.
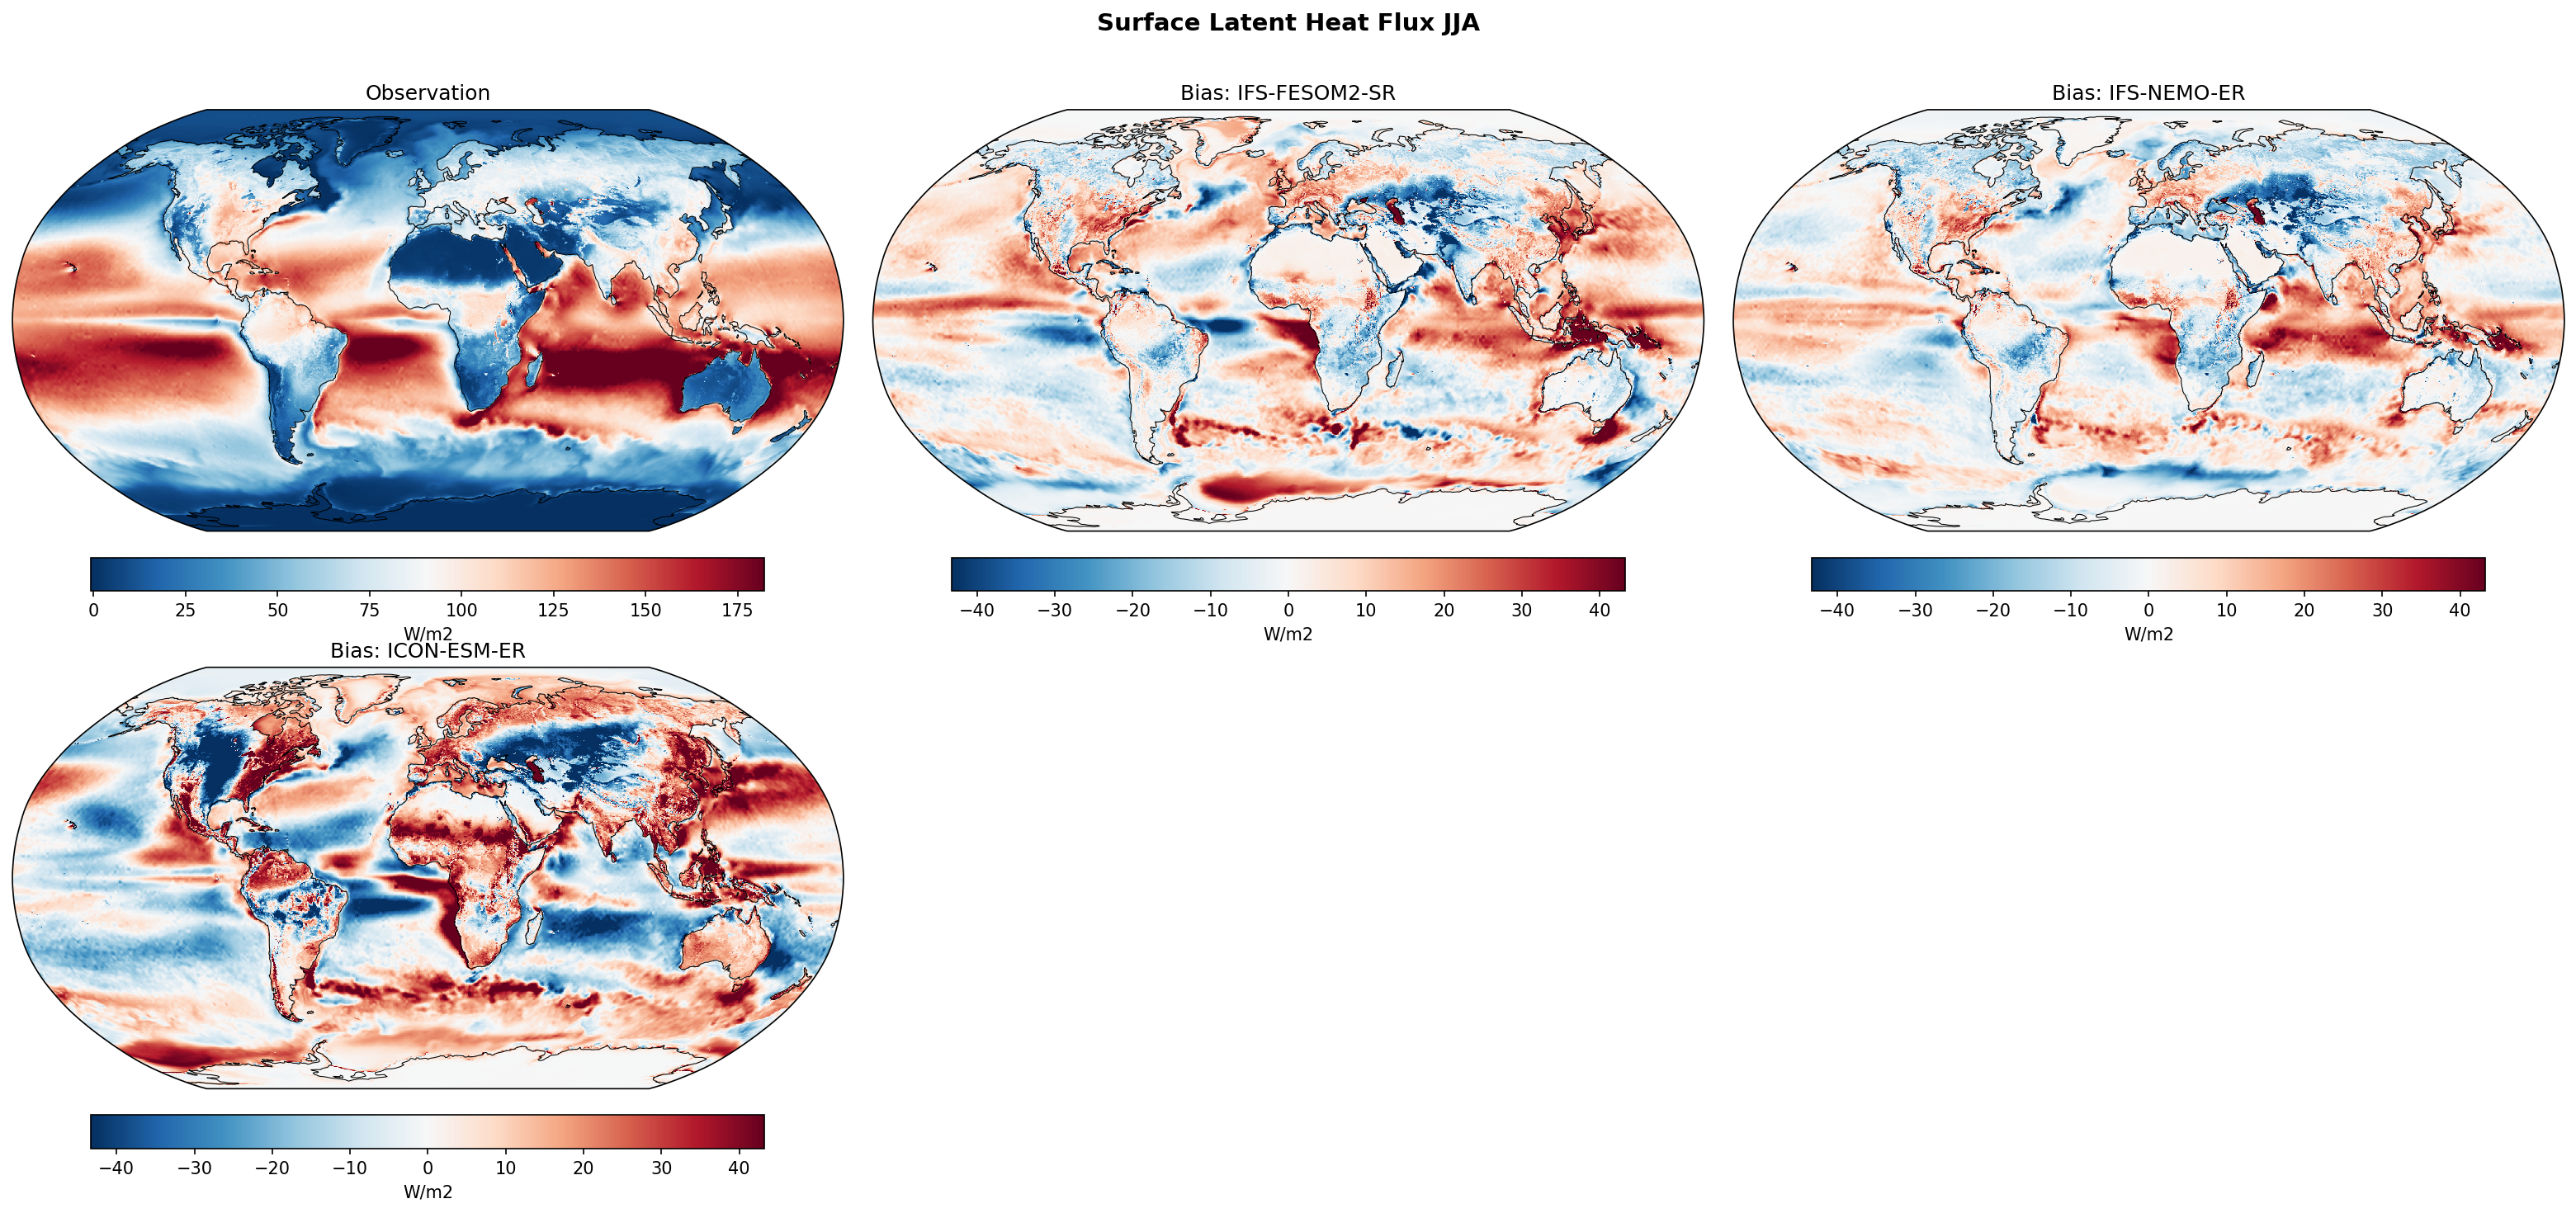
Surface Latent Heat Flux JJA Bias
| Variables | hfls |
|---|---|
| Models | IFS-FESOM2-SR, IFS-NEMO-ER, ICON-ESM-ER |
| Reference Dataset | ERA5 |
| Units | W/m2 |
| Period | 1980–2014 |
Summary high
This diagnostic evaluates JJA Surface Latent Heat Flux biases relative to ERA5. The two IFS-based models exhibit very similar spatial patterns with moderate biases, while ICON-ESM-ER displays significantly larger bias magnitudes globally, particularly over the Northern Hemisphere oceans and landmasses.
Key Findings
- All three models share a distinct negative bias (reduced evaporation) over the Amazon Basin and Central Africa, suggesting common issues with soil moisture depletion or vegetation transpiration parameterization in the dry season.
- The IFS configurations (FESOM2-SR and NEMO-ER) show remarkable agreement, indicating that atmospheric physics rather than the ocean model formulation (unstructured vs. structured grid) dominate the surface flux biases.
- ICON-ESM-ER exhibits widespread strong positive biases (>30-40 W/m²) over the North Pacific, North Atlantic, and Northern Hemisphere land areas, indicating excessive surface evaporation compared to ERA5 and the IFS models.
- Western Boundary Current regions (Gulf Stream, Kuroshio) show positive latent heat flux biases across all models, likely driven by strong air-sea interaction or SST biases in these eddy-rich regions.
Spatial Patterns
Biases show a zonal structure: generally negative in the deep tropics (ITCZ, SPCZ, eastern tropical oceans) and positive in the subtropics and mid-latitudes (particularly Western Boundary Currents). Over land, there is a sharp contrast between the negative biases in the tropical rainforests (Amazon, Congo) and positive biases over boreal/temperate regions (North America, Europe, Siberia), especially in ICON.
Model Agreement
High agreement between IFS-FESOM2-SR and IFS-NEMO-ER suggests the atmospheric component (IFS) is the primary driver of these flux biases. ICON-ESM-ER diverges significantly in magnitude, showing much stronger positive fluxes globally, but agrees on the sign of biases in key regions like the Amazon (negative) and WBCs (positive).
Physical Interpretation
The positive biases over Western Boundary Currents suggest models may have excessive surface wind speeds or air-sea humidity gradients in these regions. The negative tropical biases likely stem from weak trade winds or a too-moist boundary layer suppressing evaporation. The shared dry bias over the Amazon suggests that even at high resolution, models struggle to maintain realistic soil moisture or evapotranspiration rates during the region's dry season. The intense positive bias in ICON over NH land implies excessive evapotranspiration, possibly linked to precipitation recycling or warm biases.
Caveats
- Biases are relative to ERA5 reanalysis, which itself relies on model physics for surface fluxes.
- Latent heat flux is a coupled variable dependent on SST, wind speed, and near-surface humidity; isolating the root cause requires further variable decomposition.
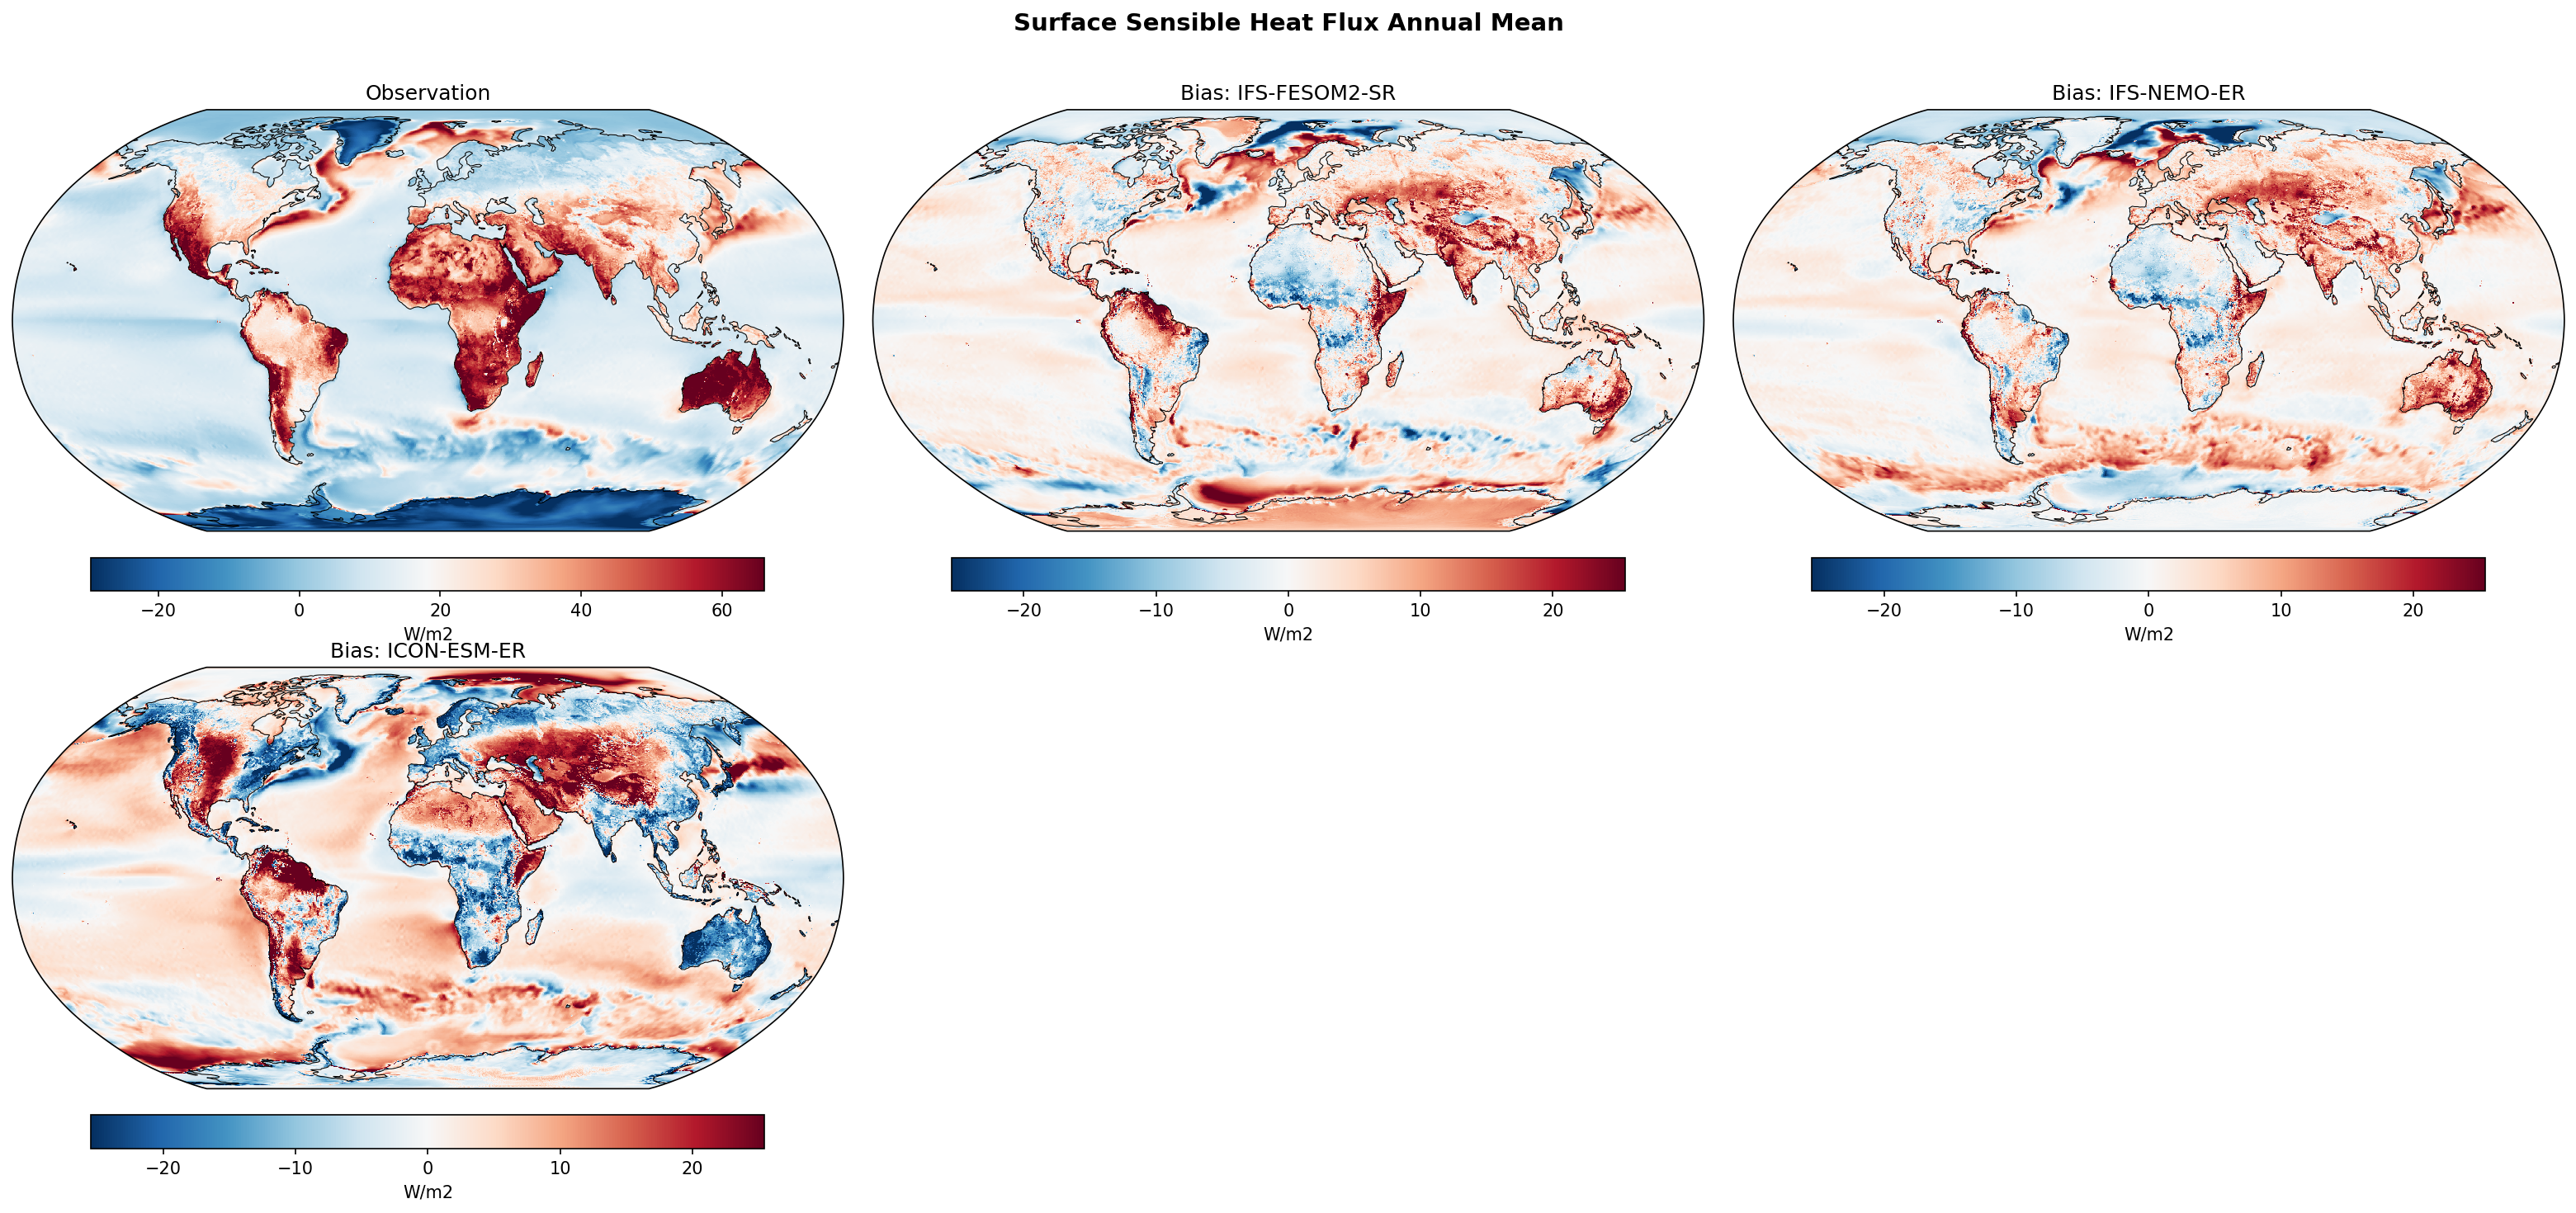
Surface Sensible Heat Flux Annual Mean Bias
| Variables | hfss |
|---|---|
| Models | IFS-FESOM2-SR, IFS-NEMO-ER, ICON-ESM-ER |
| Reference Dataset | ERA5 |
| Units | W/m2 |
| Period | 1980–2014 |
| IFS-FESOM2-SR | Global Mean Bias: 1.74 · Rmse: 6.96 |
| IFS-NEMO-ER | Global Mean Bias: 1.81 · Rmse: 6.60 |
| ICON-ESM-ER | Global Mean Bias: 1.85 · Rmse: 10.43 |
Summary high
This figure evaluates annual mean surface sensible heat flux biases in three high-resolution coupled models (IFS-FESOM2-SR, IFS-NEMO-ER, ICON-ESM-ER) relative to ERA5 reanalysis. The IFS-based models exhibit similar, lower-magnitude errors (RMSE ~6.6-7.0 W/m²), while ICON-ESM-ER shows significantly larger, spatially distinct biases (RMSE ~10.4 W/m²), particularly over land.
Key Findings
- ICON-ESM-ER has nearly double the spatial RMSE of the IFS models, driven largely by strong systematic biases over land: positive biases over deserts (e.g., Sahara, Australia) and negative biases over vegetated regions (Amazon, Boreal forests).
- IFS-FESOM2-SR and IFS-NEMO-ER show remarkably similar bias patterns, indicating that the atmospheric component (IFS) dominates the surface flux characteristics despite different ocean models.
- A common North Atlantic dipole bias exists in all models: negative biases in the subpolar gyre and positive biases in the Gulf Stream extension, likely linked to SST biases (cold subpolar/warm Gulf Stream extension).
- All models exhibit a positive global mean bias (~1.7-1.85 W/m²), indicating they release slightly more sensible heat from the surface than ERA5.
Spatial Patterns
In the North Atlantic, a dipole pattern is evident with suppressed heat flux (blue) south of Greenland and excessive flux (red) along the Gulf Stream path. Over the Southern Ocean, all models show a band of positive bias, strongest in ICON and near the Antarctic coast in IFS-FESOM. Over land, ICON shows a stark contrast: strong positive biases (>20 W/m²) over arid regions (Sahara, Arabian Peninsula, Australia) and strong negative biases (<-20 W/m²) over tropical rainforests and boreal forests. IFS models show widespread but weaker positive biases over Eurasian land masses.
Model Agreement
High agreement between IFS-FESOM2-SR and IFS-NEMO-ER suggests the atmospheric model formulation is the primary control on sensible heat flux errors. ICON-ESM-ER diverges significantly over land, suggesting different land-surface parameterizations. All models agree on the general sign of errors in the North Atlantic and Southern Ocean.
Physical Interpretation
Ocean biases are likely driven by underlying Sea Surface Temperature (SST) errors; for instance, the negative sensible heat flux bias in the North Atlantic subpolar gyre corresponds to the common 'cold blob' SST bias, reducing air-sea temperature gradients. The positive Southern Ocean bias may result from warm SST biases or excessive westerly winds enhancing turbulence. ICON's strong land biases point to issues in its land surface model (e.g., JSBACH) handling of surface roughness, soil moisture, or canopy exchange, leading to excessive heating over deserts and suppressed exchange over forests.
Caveats
- ERA5 is a reanalysis product, so biases in data-sparse regions (e.g., Southern Ocean, Antarctica) involve model-vs-model comparison.
- Sensible heat flux is a derived quantity dependent on both surface temperature and near-surface wind/stability; attributing error solely to one factor requires examining SST and wind fields.
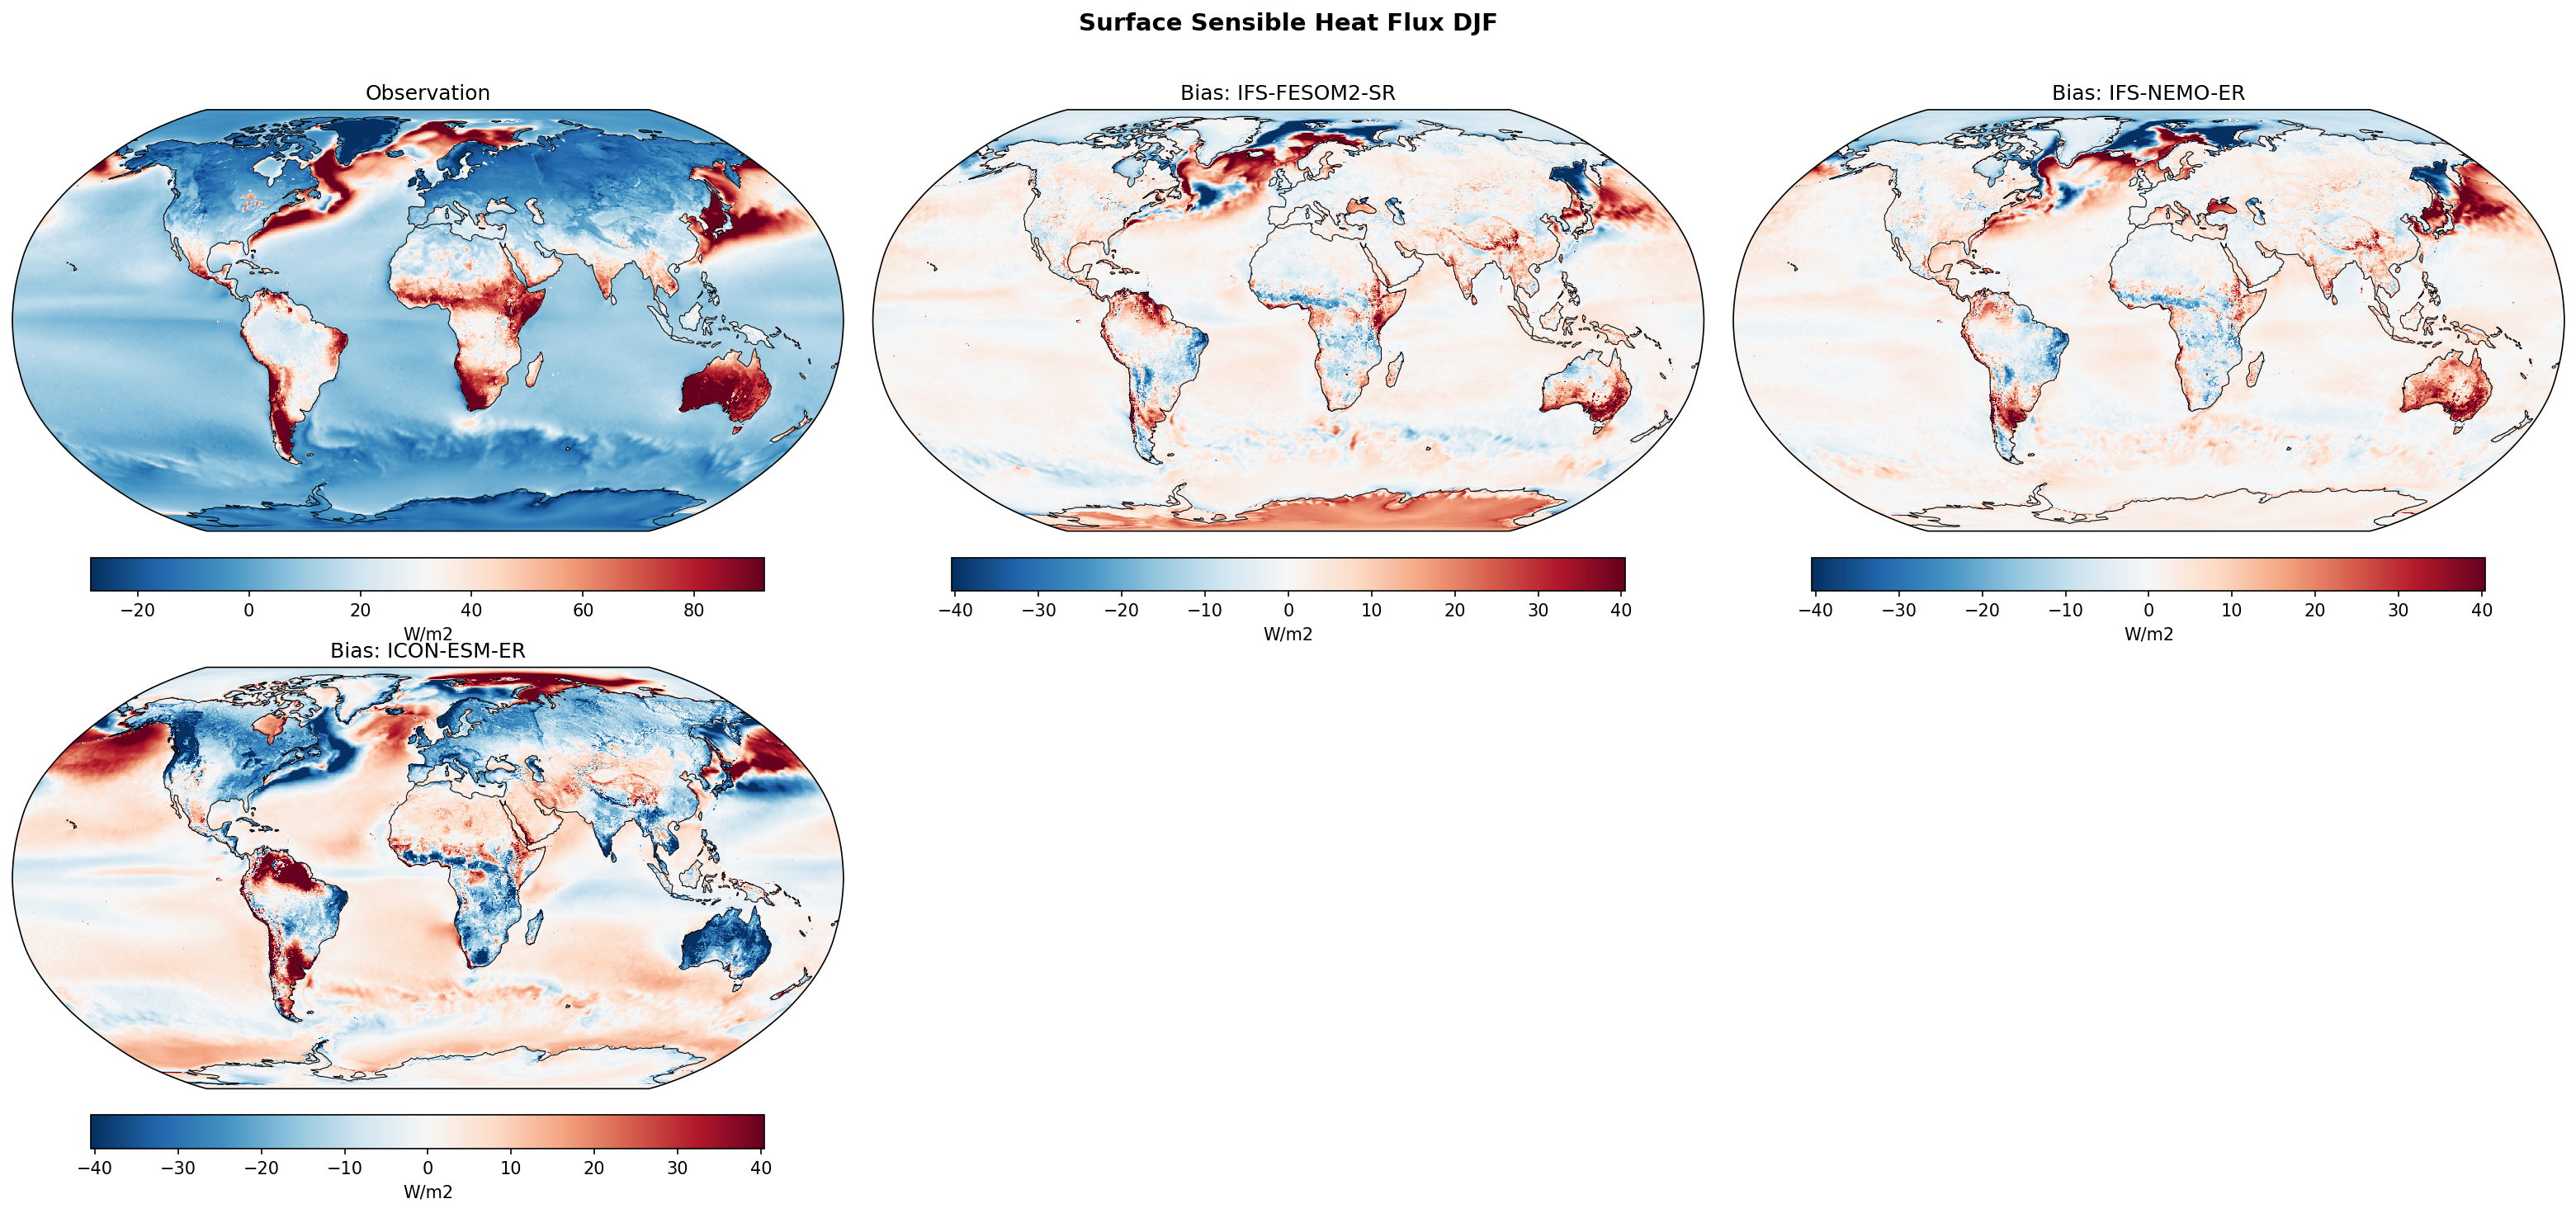
Surface Sensible Heat Flux DJF Bias
| Variables | hfss |
|---|---|
| Models | IFS-FESOM2-SR, IFS-NEMO-ER, ICON-ESM-ER |
| Reference Dataset | ERA5 |
| Units | W/m2 |
| Period | 1980–2014 |
Summary high
This figure displays the global distribution of Surface Sensible Heat Flux (SSHF) biases in DJF for three high-resolution coupled models compared to ERA5 reanalysis.
Key Findings
- IFS-based models (NEMO and FESOM2) exhibit strong dipole biases around Western Boundary Currents (Gulf Stream, Kuroshio), suggesting spatial shifts in current separation or frontal gradients.
- ICON-ESM-ER shows distinct, large-scale biases over land, with strong negative biases over tropical rainforests (Amazon, Congo) and positive biases over arid regions (Sahara, Australia).
- ICON displays a prominent widespread negative bias over the subpolar North Atlantic and Nordic Seas, indicating suppressed surface heat loss compared to ERA5.
- The two IFS models show remarkably similar bias patterns, suggesting atmospheric model physics or common resolution-dependent effective resolution dominates over ocean model differences (unstructured vs. structured grid).
Spatial Patterns
In the IFS models, the North Atlantic and North Pacific feature zonal dipoles (positive north/negative south) along the Gulf Stream and Kuroshio extensions, indicative of northward displacement or excessive overshoot of the warm currents. Over land, IFS models show moderate biases, whereas ICON shows a stark contrast: systematic underestimation of sensible heat over tropical vegetation and overestimation over deserts. High latitudes show positive biases along sea-ice edges in IFS models (e.g., Barents Sea), while ICON shows extensive negative biases in the high North Atlantic.
Model Agreement
There is very high agreement between IFS-FESOM2-SR and IFS-NEMO-ER, implying that the change in ocean component (FESOM vs. NEMO) has minimal impact on the large-scale sensible heat flux bias structure in DJF. ICON-ESM-ER diverges significantly from the IFS group, particularly in the handling of land surface fluxes and high-latitude air-sea interaction.
Physical Interpretation
The dipole biases in Western Boundary Currents in IFS models are consistent with a slight northward displacement of the Gulf Stream and Kuroshio separation points, bringing warm waters and enhanced heat loss to latitudes that are colder in observations. ICON's land biases likely stem from its land-surface scheme's energy partitioning (Bowen ratio), favoring latent over sensible heat in tropics (negative bias) and vice-versa in deserts. The negative bias in the North Atlantic for ICON suggests either cold SST biases (possibly due to AMOC issues or excessive sea ice) or reduced atmospheric mixing efficiency in unstable regimes.
Caveats
- ERA5 is a reanalysis product and relies on bulk aerodynamic formulas for fluxes, which have their own uncertainties, particularly in high wind/high gradient regimes.
- The sign convention is positive upwards (surface to atmosphere); biases are Model minus ERA5.
Surface Sensible Heat Flux JJA Bias
| Variables | hfss |
|---|---|
| Models | IFS-FESOM2-SR, IFS-NEMO-ER, ICON-ESM-ER |
| Reference Dataset | ERA5 |
| Units | W/m2 |
| Period | 1980–2014 |
Summary high
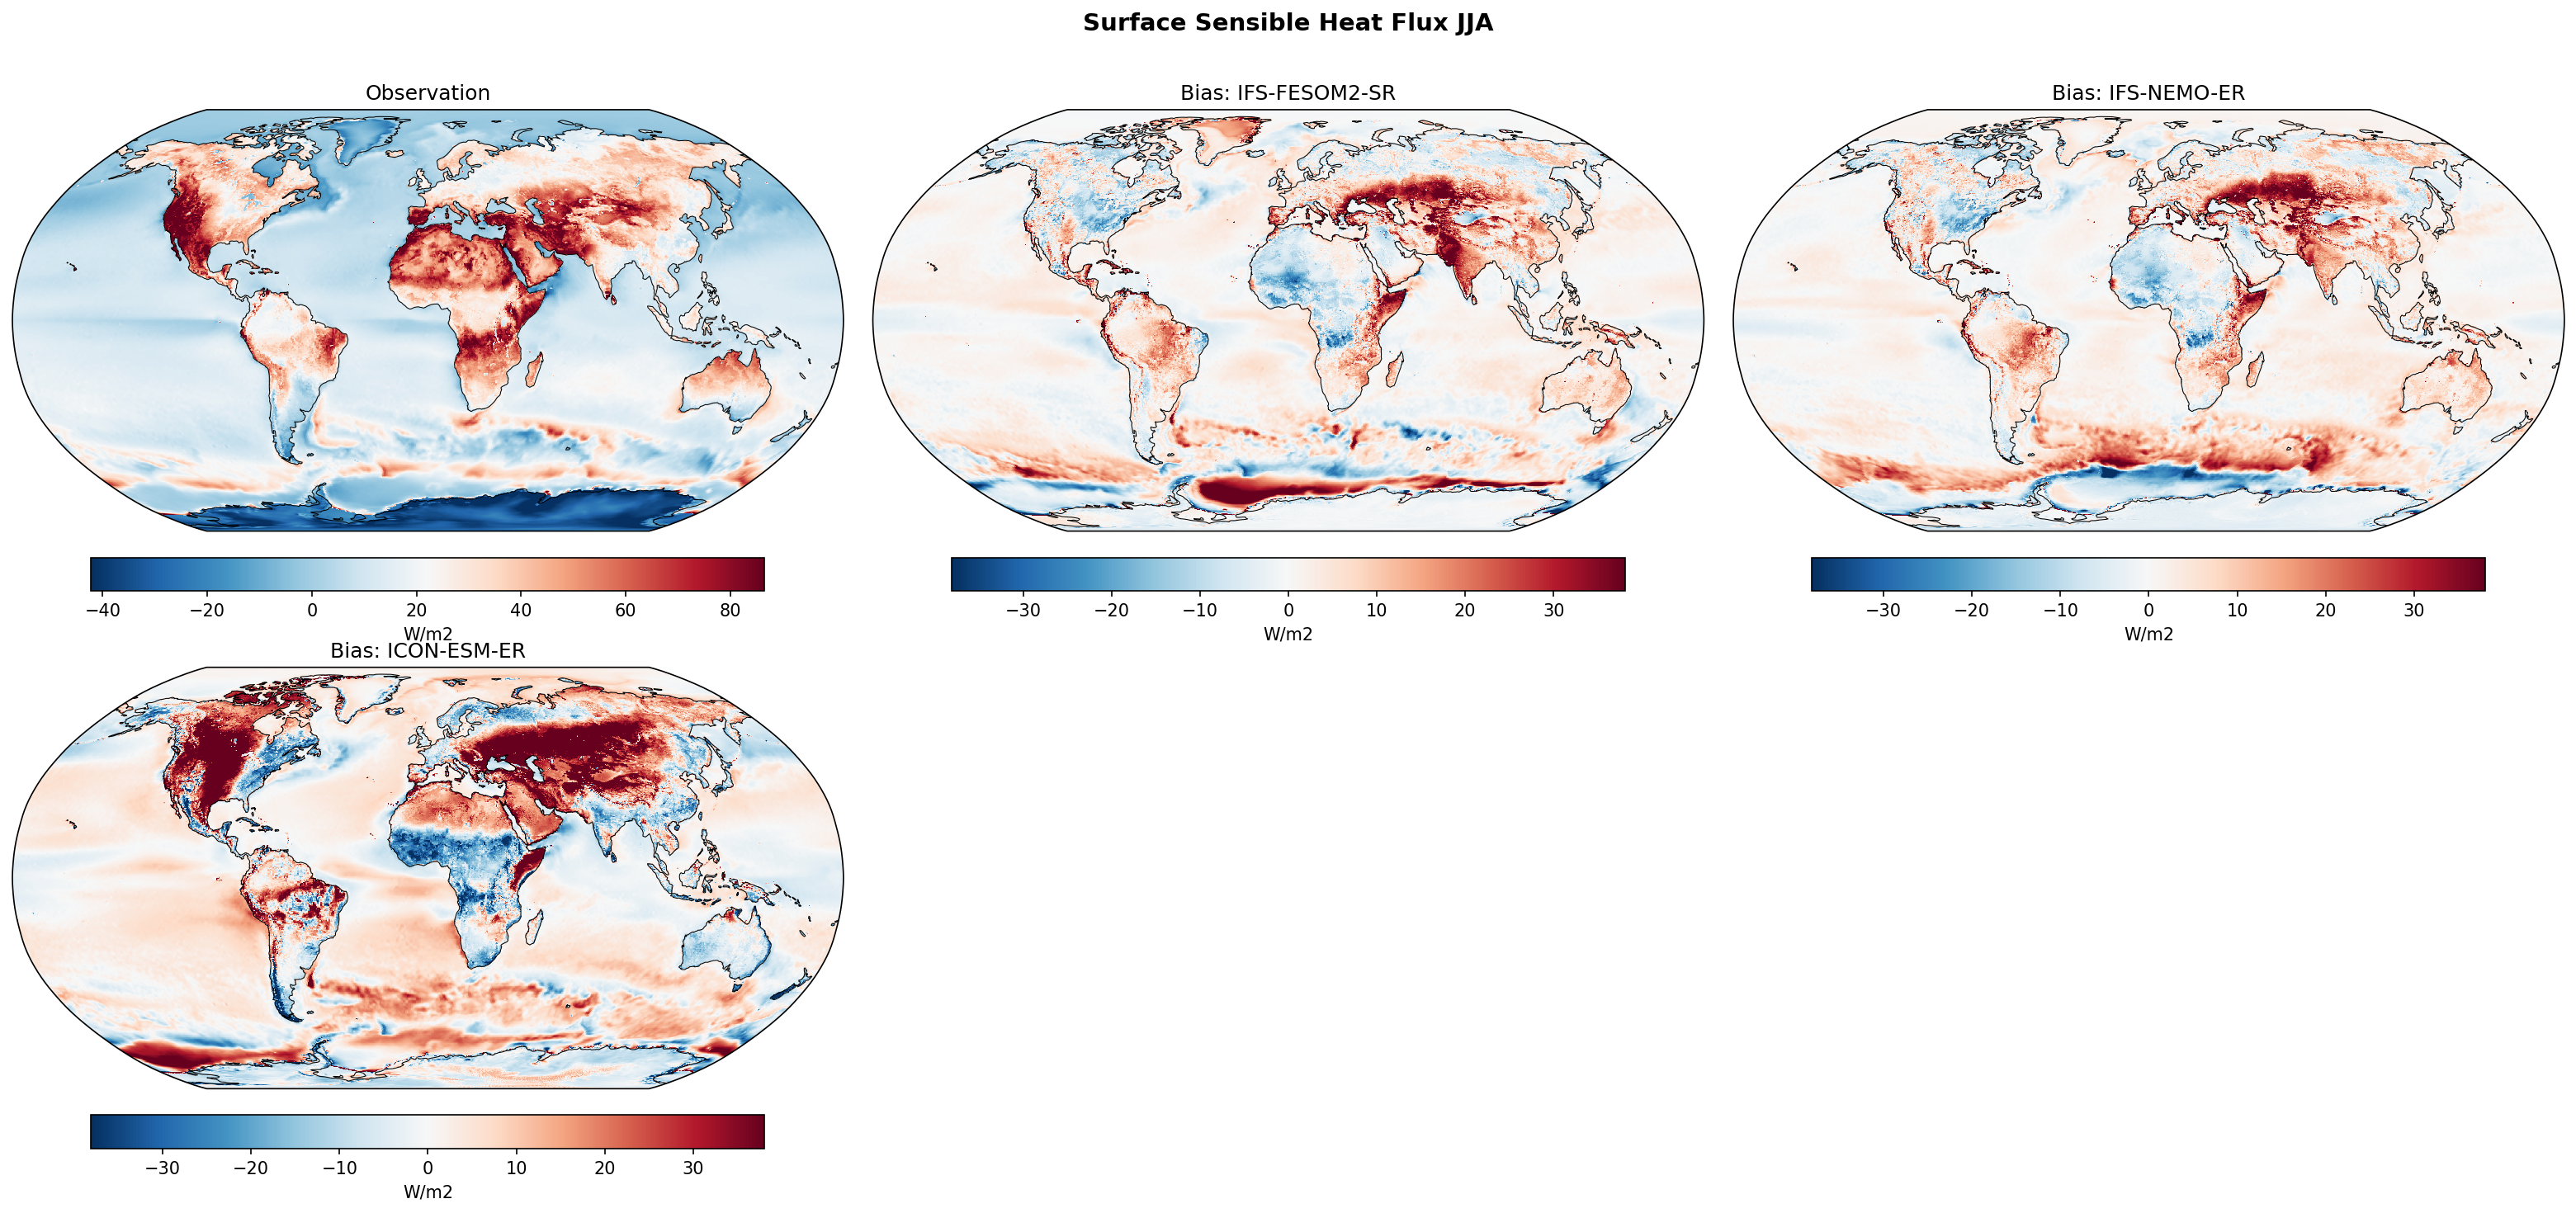
This diagnostic evaluates the climatological biases in Surface Sensible Heat Flux (SHF) for the JJA season against ERA5 reanalysis. All three models exhibit systematic positive biases over Northern Hemisphere land masses (indicating excessive heat transfer to the atmosphere) and negative biases over tropical monsoon regions.
Key Findings
- Widespread positive biases (>20 W/m²) exist over Northern Hemisphere land in summer, particularly Central Asia, Europe, and Western North America, suggesting a 'hot/dry' surface coupling bias.
- Strong negative biases appear over Central Africa and the Indian subcontinent, coincident with the ITCZ and monsoon systems, potentially indicating excessive cloud cooling or distinct Bowen ratio partitioning compared to ERA5.
- The Southern Ocean displays zonal dipole bias patterns near the sea-ice edge (approx. 60°S), likely driven by mismatches in sea ice extent or sea surface temperatures.
- ICON-ESM-ER shows significantly stronger and more widespread positive biases over high-latitude boreal regions (Canada, Siberia) compared to the IFS-based models.
Spatial Patterns
In the Northern Hemisphere summer (JJA), land areas show dominant positive biases (red), with maxima over the Western US, Central Asia, and the Amazon Basin. Conversely, tropical convective zones (Sahel, India) show strong negative anomalies (blue). The Southern Ocean features alternating concentric bands of positive and negative bias, likely tracking the Antarctic Circumpolar Current and seasonal ice edge.
Model Agreement
IFS-FESOM2-SR and IFS-NEMO-ER show high agreement over land, indicating that the atmospheric component (IFS) dominates the land surface flux errors. ICON-ESM-ER diverges significantly in magnitude, particularly in the boreal zones, suggesting different land-surface parameterizations. Ocean biases differ more between FESOM and NEMO versions, reflecting the different ocean cores.
Physical Interpretation
The positive SHF bias over summer land regions is a classic symptom of soil moisture-limited evaporation regimes. If models deplete soil moisture too quickly or lack sufficient precipitation, the surface Bowen ratio shifts, channeling available energy into sensible rather than latent heat. The negative biases in monsoon regions suggest the models may be producing too little sensible heat (possibly due to excessive latent heat flux or cloud shielding) compared to ERA5. Southern Ocean patterns correlate with sea-ice edge discrepancies: a lack of sea ice exposes relatively warm water to cold air, causing a strong positive SHF bias.
Caveats
- ERA5 surface fluxes are themselves model-derived products (reanalysis) and carry uncertainty, particularly over data-sparse regions like the Southern Ocean.
- Biases in SHF are often compensated by opposing biases in Latent Heat Flux, so examining the total turbulent flux would provide a more complete picture of the energy budget.
Total Precipitation Rate Annual Mean Bias
| Variables | pr |
|---|---|
| Models | IFS-FESOM2-SR, IFS-NEMO-ER, ICON-ESM-ER, CMIP6 MMM, MPI-ESM1-2-LR/r1i1p1f1, GISS-E2-1-G/r1i1p1f2, IPSL-CM6A-LR/r1i1p1f1, ACCESS-ESM1-5/r1i1p1f1, EC-Earth3/r1i1p1f1, CNRM-CM6-1/r1i1p1f2, AWI-CM-1-1-MR/r1i1p1f1, CNRM-ESM2-1/r1i1p1f2, FGOALS-g3/r1i1p1f1, INM-CM5-0/r1i1p1f1, MRI-ESM2-0/r1i1p1f1 |
| Reference Dataset | ERA5 |
| Units | kg/m2/s |
| Period | 1980–2014 |
| IFS-FESOM2-SR | Global Mean Bias: 0.00 · Rmse: 0.00 |
| IFS-NEMO-ER | Global Mean Bias: -0.00 · Rmse: 0.00 |
| ICON-ESM-ER | Global Mean Bias: 0.00 · Rmse: 0.00 |
| CMIP6 MMM | Global Mean Bias: 0.00 · Rmse: 0.00 |
| MPI-ESM1-2-LR/r1i1p1f1 | Global Mean Bias: -0.00 · Rmse: 0.00 |
| GISS-E2-1-G/r1i1p1f2 | Global Mean Bias: 0.00 · Rmse: 0.00 |
| IPSL-CM6A-LR/r1i1p1f1 | Global Mean Bias: 0.00 · Rmse: 0.00 |
| ACCESS-ESM1-5/r1i1p1f1 | Global Mean Bias: 0.00 · Rmse: 0.00 |
| EC-Earth3/r1i1p1f1 | Global Mean Bias: -0.00 · Rmse: 0.00 |
| CNRM-CM6-1/r1i1p1f2 | Global Mean Bias: 0.00 · Rmse: 0.00 |
| AWI-CM-1-1-MR/r1i1p1f1 | Global Mean Bias: -0.00 · Rmse: 0.00 |
| CNRM-ESM2-1/r1i1p1f2 | Global Mean Bias: 0.00 · Rmse: 0.00 |
| FGOALS-g3/r1i1p1f1 | Global Mean Bias: -0.00 · Rmse: 0.00 |
| INM-CM5-0/r1i1p1f1 | Global Mean Bias: 0.00 · Rmse: 0.00 |
| MRI-ESM2-0/r1i1p1f1 | Global Mean Bias: 0.00 · Rmse: 0.00 |
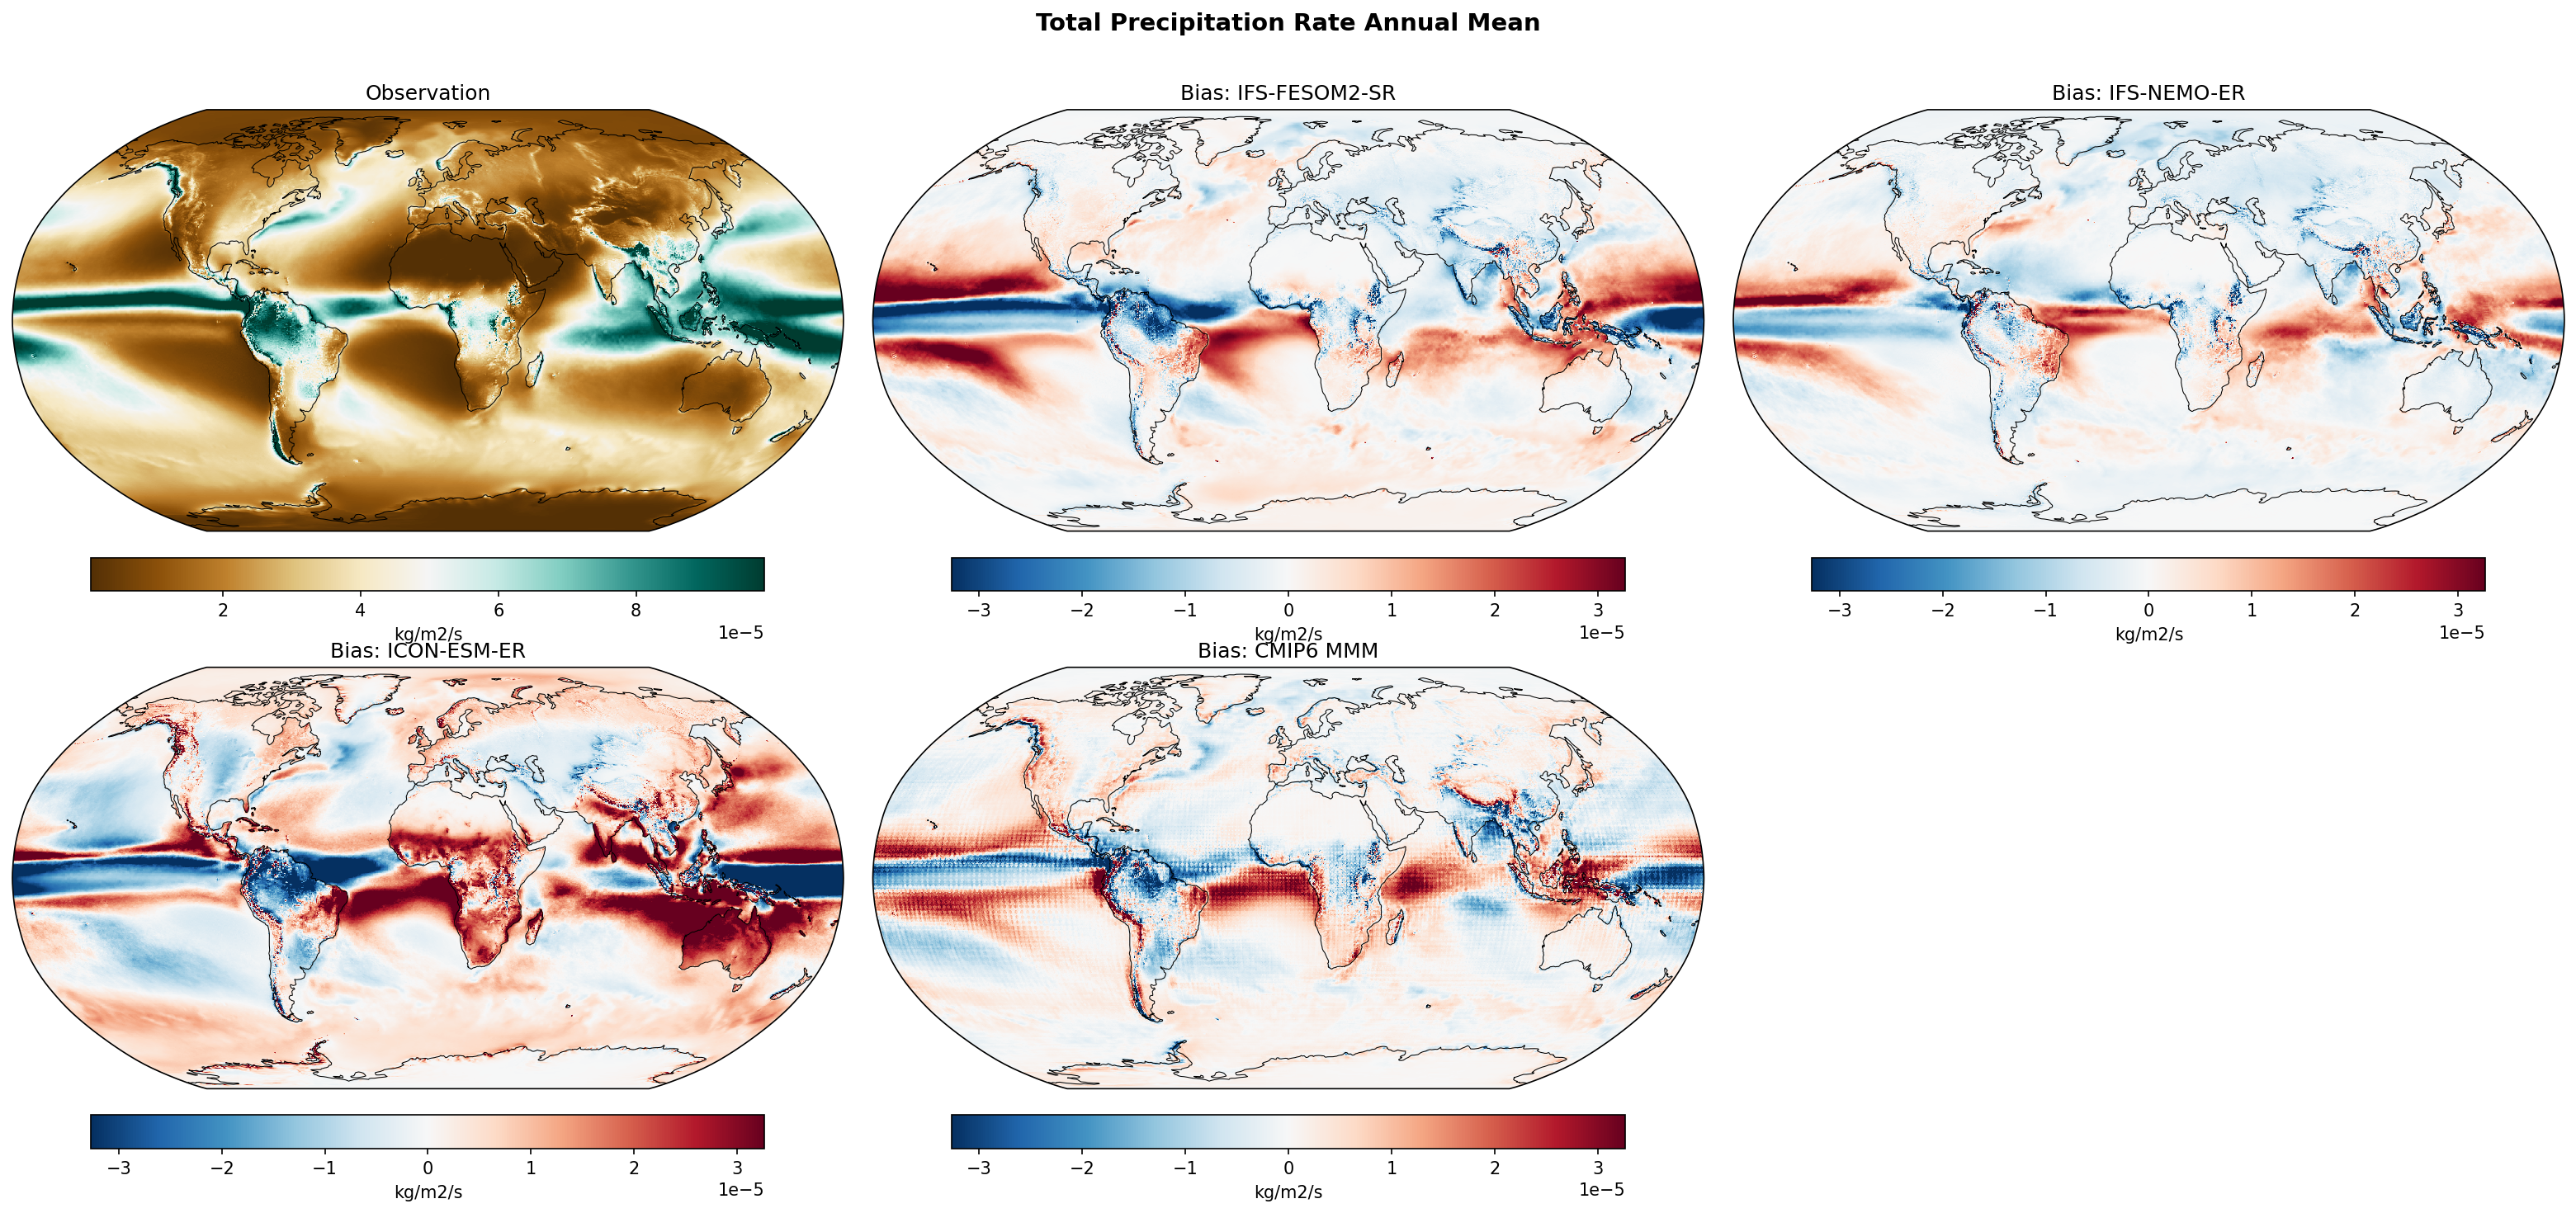
Summary high
This figure evaluates annual mean precipitation rate biases against ERA5, highlighting a stark performance contrast among the high-resolution EERIE models. IFS-NEMO-ER demonstrates superior skill with the lowest global RMSE, while ICON-ESM-ER exhibits severe tropical biases that exceed those of the CMIP6 Multi-Model Mean (MMM).
Key Findings
- IFS-NEMO-ER achieves the lowest RMSE (8.63e-06 kg/m²/s) and visually smallest biases, effectively suppressing the common 'double ITCZ' error found in most coupled models.
- ICON-ESM-ER performs poorly (RMSE 1.84e-05 kg/m²/s), displaying a distinct, intense double ITCZ pattern with excessive precipitation in the southern tropical Pacific and Indian Oceans (>3e-05 kg/m²/s) and severe drying over the Amazon.
- A systematic dry bias over the Amazon basin is prevalent across nearly all models, including the CMIP6 MMM, but is most extreme in ICON-ESM-ER and GISS-E2-1-G.
- While IFS-FESOM2-SR shares the same atmospheric component as IFS-NEMO-ER, it exhibits slightly larger biases (RMSE 1.14e-05 kg/m²/s) and a more visible southern ITCZ band, suggesting ocean coupling (NEMO vs. FESOM) plays a critical role in precipitating the tropical mean state.
Spatial Patterns
The dominant error pattern is the 'double ITCZ'—a zonal band of excessive precipitation south of the equator (0-10°S) in the Pacific and Atlantic—clearly visible in ICON-ESM-ER, ACCESS-ESM1-5, and the CMIP6 MMM. Correspondingly, these models often show dry biases along the equator or in the Maritime Continent. Strong wet biases are also frequent in the western tropical Indian Ocean.
Model Agreement
There is broad inter-model agreement on the sign of biases in the Amazon (dry) and Southern Ocean (often wet), but significant divergence in the tropics. The IFS-based models (NEMO and FESOM) cluster closer to observations than ICON, which aligns more closely with the poorer-performing outlier CMIP6 models (e.g., ACCESS-ESM1-5, FGOALS-g3) regarding tropical precipitation distribution.
Physical Interpretation
The double ITCZ bias is a longstanding coupled model problem, often linked to errors in the SST mean state (e.g., a cold tongue that is too cold or extends too far west) or deep convection parameterizations. The superior performance of IFS-NEMO-ER suggests that its specific combination of eddy-rich ocean resolution and coupling effectively improves the tropical SST gradient and convergence zones. The severe Amazon drying in ICON implies issues with land-atmosphere coupling or moisture transport from the Atlantic.
Caveats
- ERA5 precipitation is a model-generated forecast product (reanalysis) rather than direct observation, though it assimilates vast amounts of data.
- Annual means obscure seasonal shifts; the double ITCZ bias often stems from an inability to break the symmetry during solstices.
Total Precipitation Rate DJF Bias
| Variables | pr |
|---|---|
| Models | IFS-FESOM2-SR, IFS-NEMO-ER, ICON-ESM-ER, CMIP6 MMM, MPI-ESM1-2-LR/r1i1p1f1, GISS-E2-1-G/r1i1p1f2, IPSL-CM6A-LR/r1i1p1f1, ACCESS-ESM1-5/r1i1p1f1, EC-Earth3/r1i1p1f1, CNRM-CM6-1/r1i1p1f2, AWI-CM-1-1-MR/r1i1p1f1, CNRM-ESM2-1/r1i1p1f2, FGOALS-g3/r1i1p1f1, INM-CM5-0/r1i1p1f1, MRI-ESM2-0/r1i1p1f1 |
| Reference Dataset | ERA5 |
| Units | kg/m2/s |
| Period | 1980–2014 |
| CMIP6 MMM | Global Mean Bias: 0.00 · Rmse: None |
| MPI-ESM1-2-LR/r1i1p1f1 | Global Mean Bias: -0.00 · Rmse: None |
| GISS-E2-1-G/r1i1p1f2 | Global Mean Bias: 0.00 · Rmse: None |
| IPSL-CM6A-LR/r1i1p1f1 | Global Mean Bias: 0.00 · Rmse: None |
| ACCESS-ESM1-5/r1i1p1f1 | Global Mean Bias: 0.00 · Rmse: None |
| EC-Earth3/r1i1p1f1 | Global Mean Bias: 0.00 · Rmse: None |
| CNRM-CM6-1/r1i1p1f2 | Global Mean Bias: 0.00 · Rmse: None |
| AWI-CM-1-1-MR/r1i1p1f1 | Global Mean Bias: 0.00 · Rmse: None |
| CNRM-ESM2-1/r1i1p1f2 | Global Mean Bias: 0.00 · Rmse: None |
| FGOALS-g3/r1i1p1f1 | Global Mean Bias: -0.00 · Rmse: None |
| INM-CM5-0/r1i1p1f1 | Global Mean Bias: 0.00 · Rmse: None |
| MRI-ESM2-0/r1i1p1f1 | Global Mean Bias: 0.00 · Rmse: None |
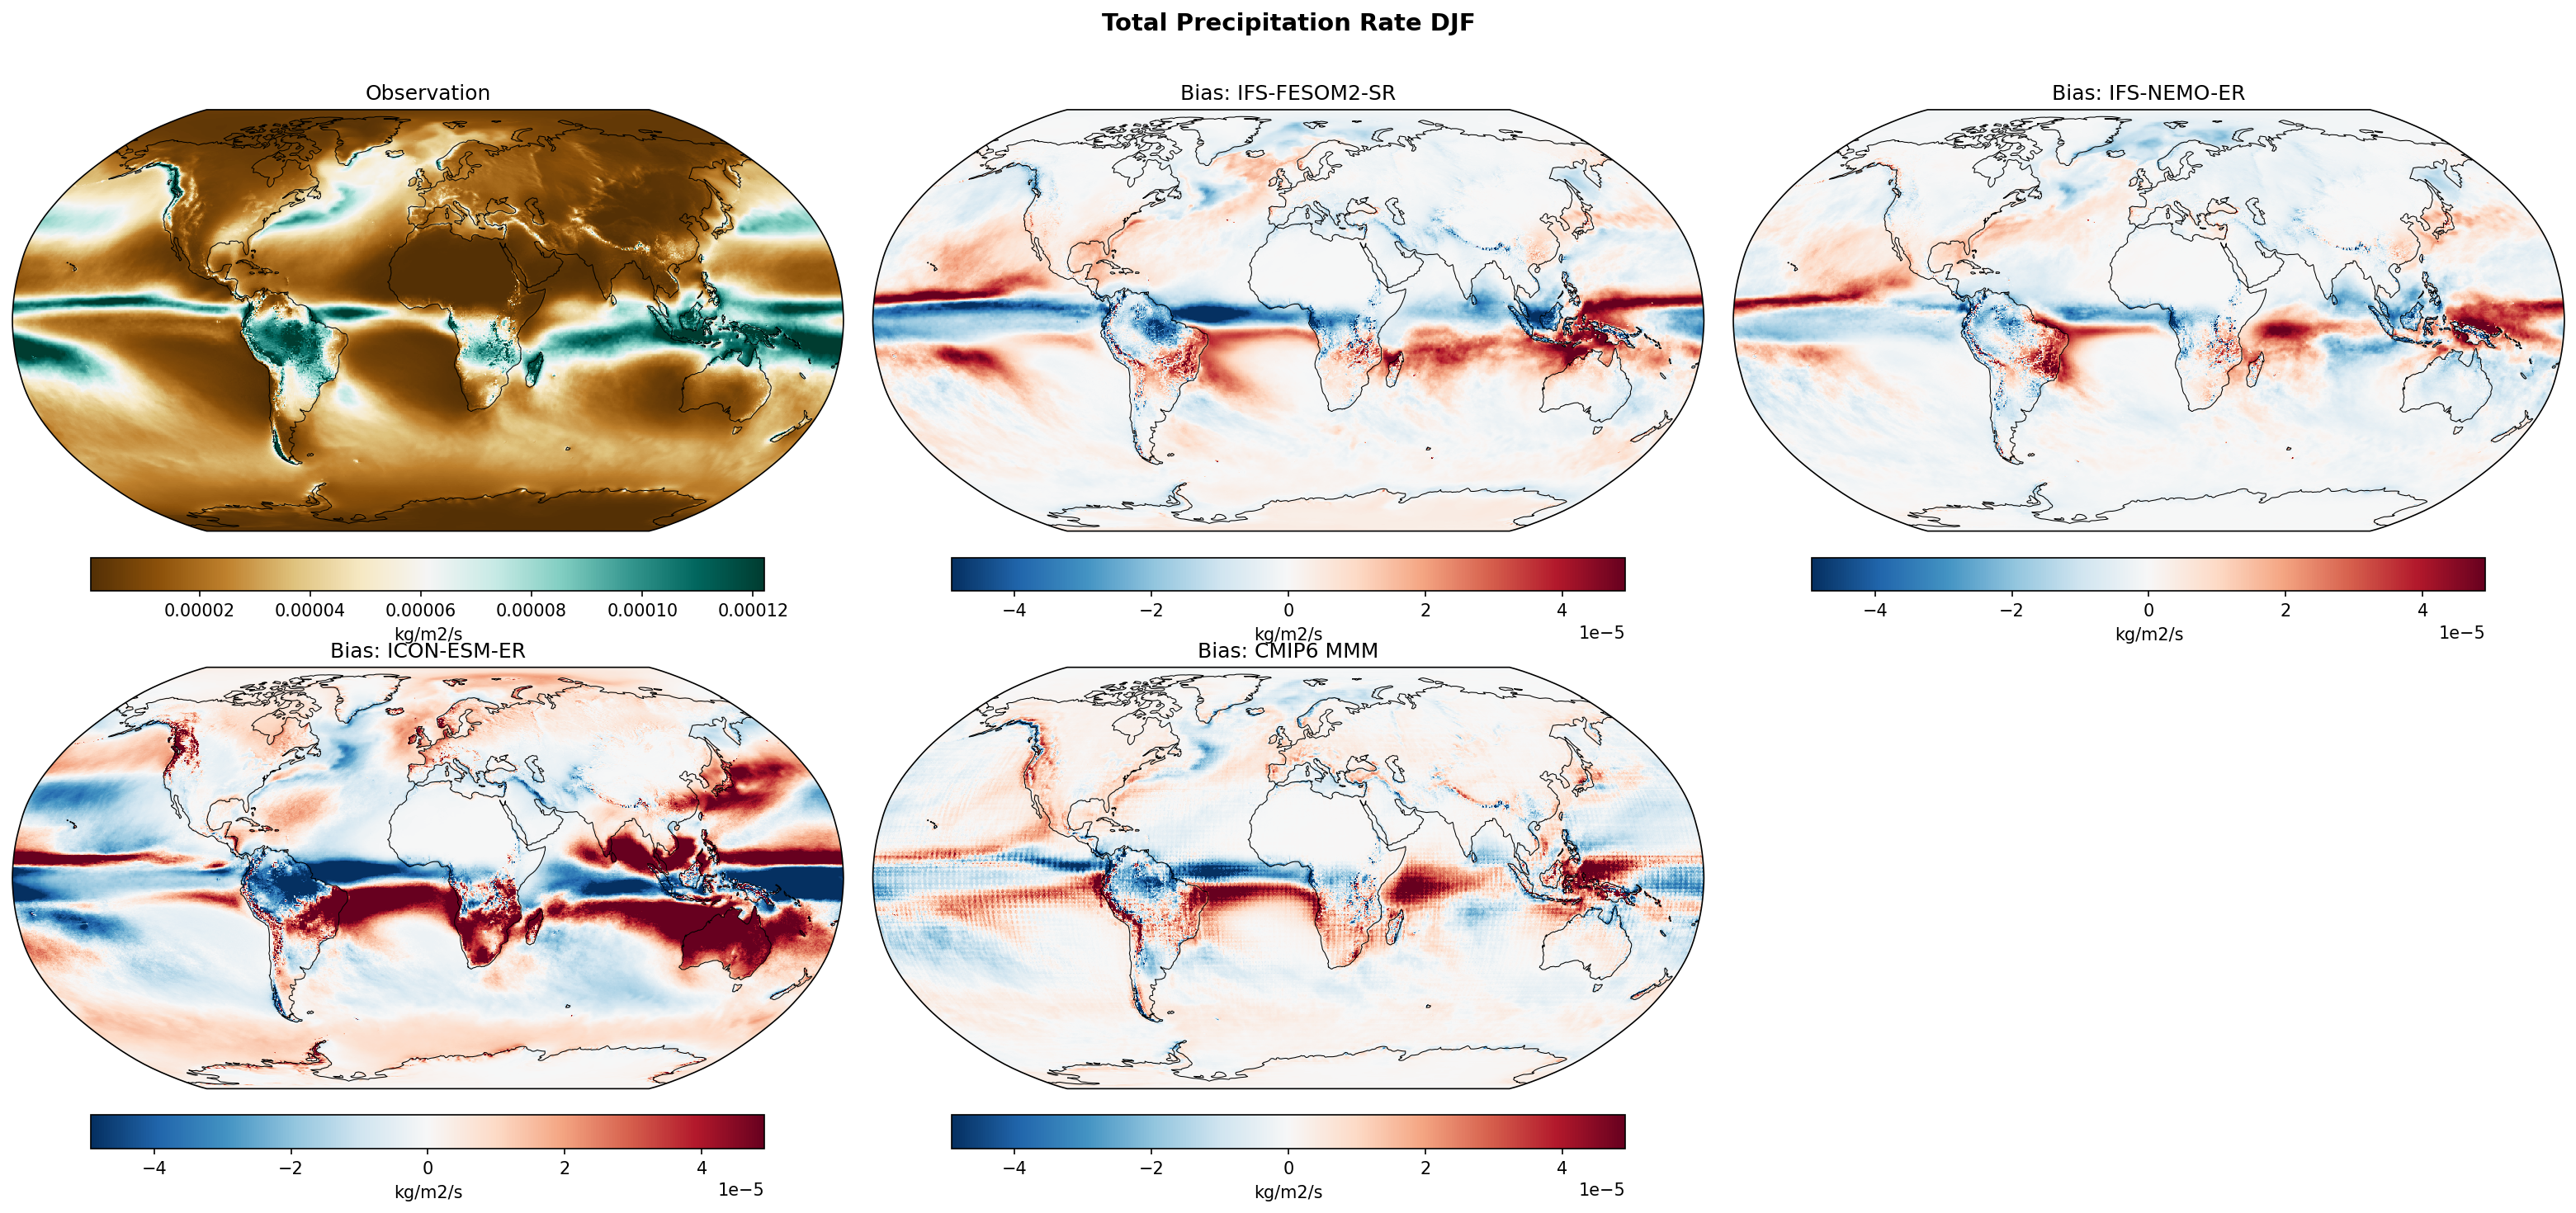
Summary high
This diagnostic evaluates DJF precipitation climatology biases in high-resolution EERIE models (IFS-FESOM2-SR, IFS-NEMO-ER, ICON-ESM-ER) and CMIP6 models relative to ERA5. While the IFS-based models exhibit systematic biases typical of the broader CMIP6 ensemble (e.g., Double ITCZ, dry Amazon), ICON-ESM-ER presents a distinct, intense zonal dipole bias in the Tropical Pacific.
Key Findings
- IFS-FESOM2-SR and IFS-NEMO-ER show nearly identical bias patterns, indicating that the atmospheric component (IFS) dominates precipitation characteristics over the choice of ocean model (FESOM2 vs NEMO).
- ICON-ESM-ER exhibits a unique and strong bias structure with excessive precipitation over the Maritime Continent/Western Pacific (saturated red, >4e-5 kg/m²/s) and a severe dry bias in the Central Pacific.
- A systematic dry bias over the Amazon basin is present in almost all models, including the high-resolution EERIE runs, confirming this remains a persistent challenge regardless of resolution.
Spatial Patterns
The IFS models and the CMIP6 Multi-Model Mean (MMM) display a classic 'Double ITCZ' bias pattern in the Pacific: a distinct band of excessive precipitation in the South East Pacific (red) parallel to a band of deficient precipitation along the equator and ITCZ proper (blue). In contrast, ICON-ESM-ER shows a strong zonal dipole: a 'super-La Niña' like pattern with intense wet biases in the Indo-Pacific warm pool and dry biases extending across the central Pacific. Additionally, wet biases are prominent in the Western Indian Ocean and Southern Ocean storm tracks (approx 50°S) across most models.
Model Agreement
There is high agreement between the two IFS configurations and the CMIP6 MMM, suggesting that the ~10 km resolution in IFS does not immediately rectify large-scale tropical circulation biases like the Double ITCZ. ICON-ESM-ER is an outlier with its extreme Maritime Continent wet bias. Model spread is also visible in the Atlantic ITCZ representation, where some CMIP6 models (e.g., GISS, IPSL) show varying degrees of meridional shift.
Physical Interpretation
The Double ITCZ bias in IFS and CMIP6 models is typically linked to errors in the meridional SST gradient, cloud radiative feedbacks, and convection parameterizations that allow precipitation to form too easily in the SE Pacific. The dry Amazon bias suggests issues with land-atmosphere coupling or moisture recycling efficiency in the wet season. ICON-ESM-ER's pattern implies an overly strong Walker circulation or a convection scheme that is overly sensitive to high SSTs in the Warm Pool, locking precipitation into the far west and suppressing it centrally.
Caveats
- ERA5 is a reanalysis product; while robust, it relies on model physics for precipitation generation where observations are sparse.
- The comparison includes both coupled biases and potential intrinsic atmospheric model biases; separating them requires AMIP runs (not shown).
Total Precipitation Rate JJA Bias
| Variables | pr |
|---|---|
| Models | IFS-FESOM2-SR, IFS-NEMO-ER, ICON-ESM-ER, CMIP6 MMM, MPI-ESM1-2-LR/r1i1p1f1, GISS-E2-1-G/r1i1p1f2, IPSL-CM6A-LR/r1i1p1f1, ACCESS-ESM1-5/r1i1p1f1, EC-Earth3/r1i1p1f1, CNRM-CM6-1/r1i1p1f2, AWI-CM-1-1-MR/r1i1p1f1, CNRM-ESM2-1/r1i1p1f2, FGOALS-g3/r1i1p1f1, INM-CM5-0/r1i1p1f1, MRI-ESM2-0/r1i1p1f1 |
| Reference Dataset | ERA5 |
| Units | kg/m2/s |
| Period | 1980–2014 |
| CMIP6 MMM | Global Mean Bias: 0.00 · Rmse: None |
| MPI-ESM1-2-LR/r1i1p1f1 | Global Mean Bias: -0.00 · Rmse: None |
| GISS-E2-1-G/r1i1p1f2 | Global Mean Bias: -0.00 · Rmse: None |
| IPSL-CM6A-LR/r1i1p1f1 | Global Mean Bias: 0.00 · Rmse: None |
| ACCESS-ESM1-5/r1i1p1f1 | Global Mean Bias: 0.00 · Rmse: None |
| EC-Earth3/r1i1p1f1 | Global Mean Bias: -0.00 · Rmse: None |
| CNRM-CM6-1/r1i1p1f2 | Global Mean Bias: -0.00 · Rmse: None |
| AWI-CM-1-1-MR/r1i1p1f1 | Global Mean Bias: -0.00 · Rmse: None |
| CNRM-ESM2-1/r1i1p1f2 | Global Mean Bias: 0.00 · Rmse: None |
| FGOALS-g3/r1i1p1f1 | Global Mean Bias: -0.00 · Rmse: None |
| INM-CM5-0/r1i1p1f1 | Global Mean Bias: 0.00 · Rmse: None |
| MRI-ESM2-0/r1i1p1f1 | Global Mean Bias: 0.00 · Rmse: None |
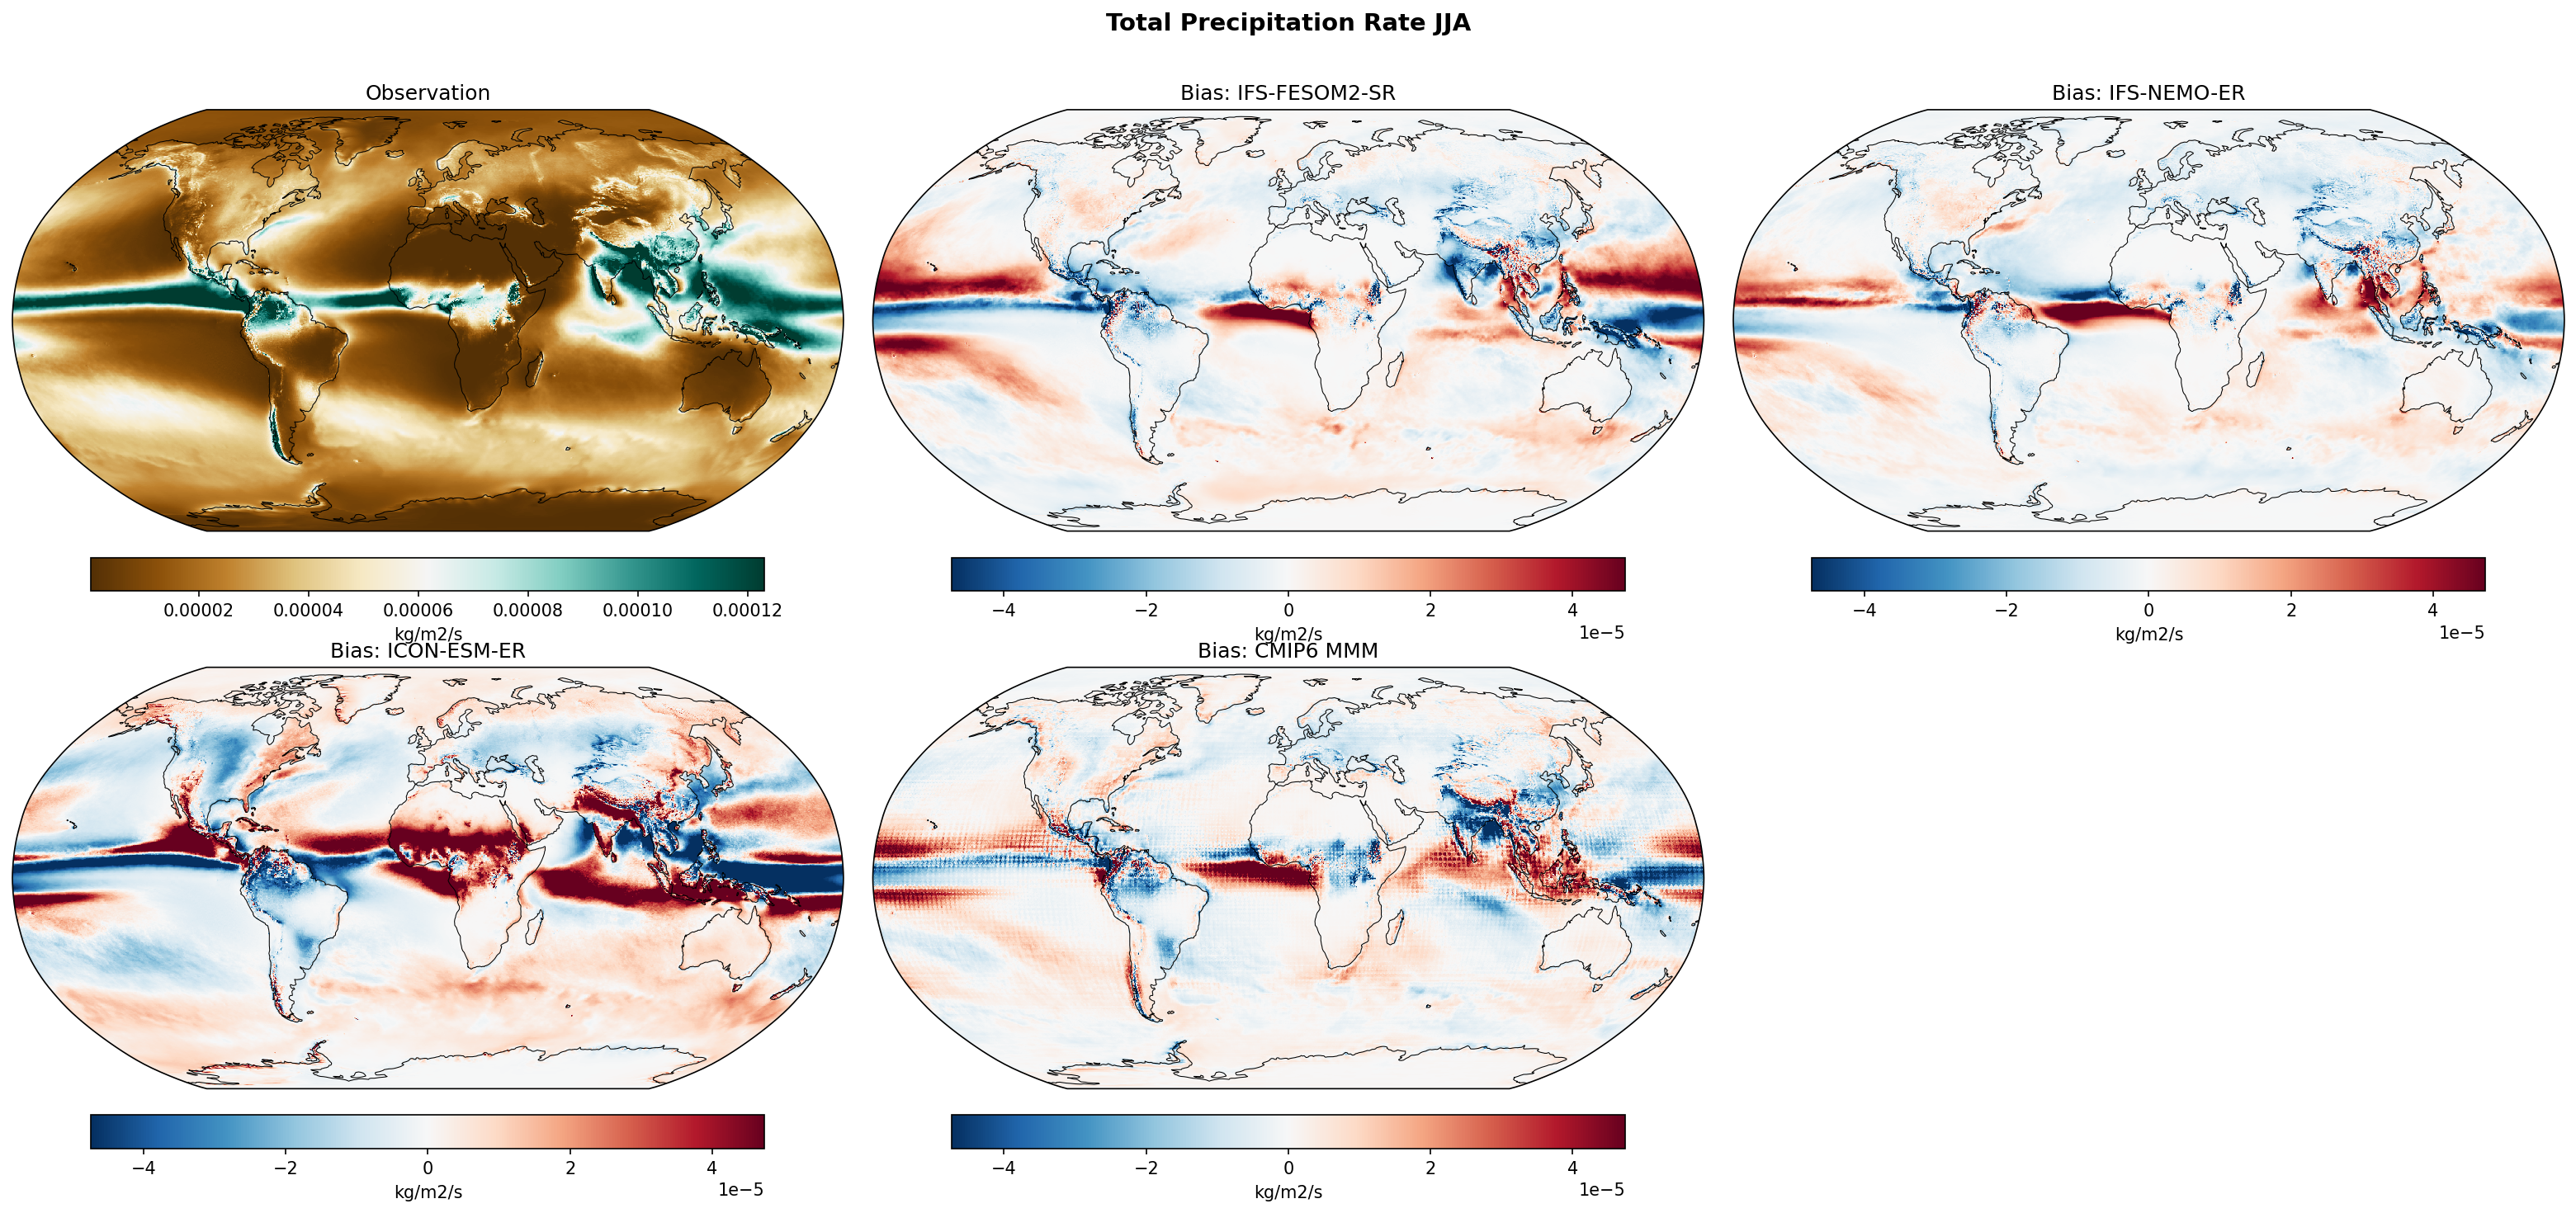
Summary high
This figure evaluates JJA precipitation biases in high-resolution EERIE models (IFS-FESOM2-SR, IFS-NEMO-ER, ICON-ESM-ER) and CMIP6 models against ERA5 reanalysis. The results highlight persistent systematic biases, most notably the 'double ITCZ' syndrome and a weak Indian Summer Monsoon, which appear robust across both high-resolution and standard-resolution ensembles.
Key Findings
- Both EERIE and CMIP6 models exhibit a classic 'double ITCZ' bias pattern in the Pacific and Atlantic, characterized by excessive precipitation south of the equator (blue bias) and insufficient precipitation along the northern climatological ITCZ position (red bias).
- A systematic dry bias over the Indian subcontinent is present in almost all models (including IFS and ICON variants), often accompanied by a wet bias over the adjacent Indian Ocean or Himalayan foothills, indicating a failure to fully propagate the monsoon inland.
- ICON-ESM-ER displays distinct bias magnitudes compared to the IFS models, specifically a more intense wet bias along the equatorial Pacific and a severe dry bias over the West African Sahel.
- The two IFS variants (FESOM2-SR and NEMO-ER) show remarkably similar bias patterns, suggesting that the ocean model formulation (unstructured vs. structured grid) has a secondary effect on atmospheric precipitation biases compared to the atmospheric physics.
Spatial Patterns
The dominant spatial feature is a zonal dipole bias in the tropics: a dry band generally between 5°N-15°N and a wet band near the equator or 5°S, visible across the Pacific and Atlantic basins. In the Indian Monsoon region, a meridional dipole exists with dry conditions over land (India) and wet conditions over the ocean (Arabian Sea/Bay of Bengal) or mountain slopes. High-resolution models show sharper, topographically locked bias features (e.g., along the Andes and Himalayas) compared to the smoother CMIP6 Multi-Model Mean.
Model Agreement
There is strong inter-model agreement regarding the sign and location of major biases (Indian drying, tropical dipoles), indicating these are structural model deficiencies common to the generation of climate models regardless of resolution. The IFS-FESOM2-SR and IFS-NEMO-ER are nearly indistinguishable, while ICON-ESM-ER stands out as an outlier with stronger localized biases in the Sahel and Pacific.
Physical Interpretation
The persistence of the double ITCZ and monsoon biases in high-resolution (~10km) simulations suggests these errors are driven by sub-grid scale parameterizations (convection, cloud microphysics) and coupled feedbacks (e.g., SST-convection coupling) rather than insufficient horizontal resolution. The dry bias over India and the Sahel implies issues with the land-sea thermal contrast or the representation of moisture advection in the monsoonal flow.
Caveats
- ERA5 is a reanalysis product and, while robust, relies on model physics for precipitation generation where observations are sparse, potentially influencing the 'truth' baseline.
- Precipitation biases are inherently noisy; the strong localized wet biases could be influenced by shifts in storm tracks or convergence zones rather than purely thermodynamic errors.
Mean Sea Level Pressure Annual Mean Bias
| Variables | psl |
|---|---|
| Models | IFS-FESOM2-SR, IFS-NEMO-ER, ICON-ESM-ER, CMIP6 MMM, MPI-ESM1-2-LR/r1i1p1f1, GISS-E2-1-G/r1i1p1f2, IPSL-CM6A-LR/r1i1p1f1, ACCESS-ESM1-5/r1i1p1f1, EC-Earth3/r1i1p1f1, CNRM-CM6-1/r1i1p1f2, AWI-CM-1-1-MR/r1i1p1f1, CNRM-ESM2-1/r1i1p1f2, FGOALS-g3/r1i1p1f1, INM-CM5-0/r1i1p1f1, MRI-ESM2-0/r1i1p1f1 |
| Reference Dataset | ERA5 |
| Units | Pa |
| Period | 1980–2014 |
| IFS-FESOM2-SR | Global Mean Bias: -5.87 · Rmse: 101.64 |
| IFS-NEMO-ER | Global Mean Bias: 11.27 · Rmse: 100.14 |
| ICON-ESM-ER | Global Mean Bias: -70.87 · Rmse: 498.55 |
| CMIP6 MMM | Global Mean Bias: -6.21 · Rmse: 87.79 |
| MPI-ESM1-2-LR/r1i1p1f1 | Global Mean Bias: -6.32 · Rmse: 152.40 |
| GISS-E2-1-G/r1i1p1f2 | Global Mean Bias: -140.44 · Rmse: 218.33 |
| IPSL-CM6A-LR/r1i1p1f1 | Global Mean Bias: 38.88 · Rmse: 222.69 |
| ACCESS-ESM1-5/r1i1p1f1 | Global Mean Bias: 41.73 · Rmse: 214.15 |
| EC-Earth3/r1i1p1f1 | Global Mean Bias: -12.01 · Rmse: 106.06 |
| CNRM-CM6-1/r1i1p1f2 | Global Mean Bias: 19.75 · Rmse: 171.00 |
| AWI-CM-1-1-MR/r1i1p1f1 | Global Mean Bias: -20.50 · Rmse: 173.46 |
| CNRM-ESM2-1/r1i1p1f2 | Global Mean Bias: 14.90 · Rmse: 163.48 |
| FGOALS-g3/r1i1p1f1 | Global Mean Bias: 55.43 · Rmse: 296.48 |
| INM-CM5-0/r1i1p1f1 | Global Mean Bias: -72.56 · Rmse: 179.03 |
| MRI-ESM2-0/r1i1p1f1 | Global Mean Bias: 13.57 · Rmse: 182.31 |
Summary high
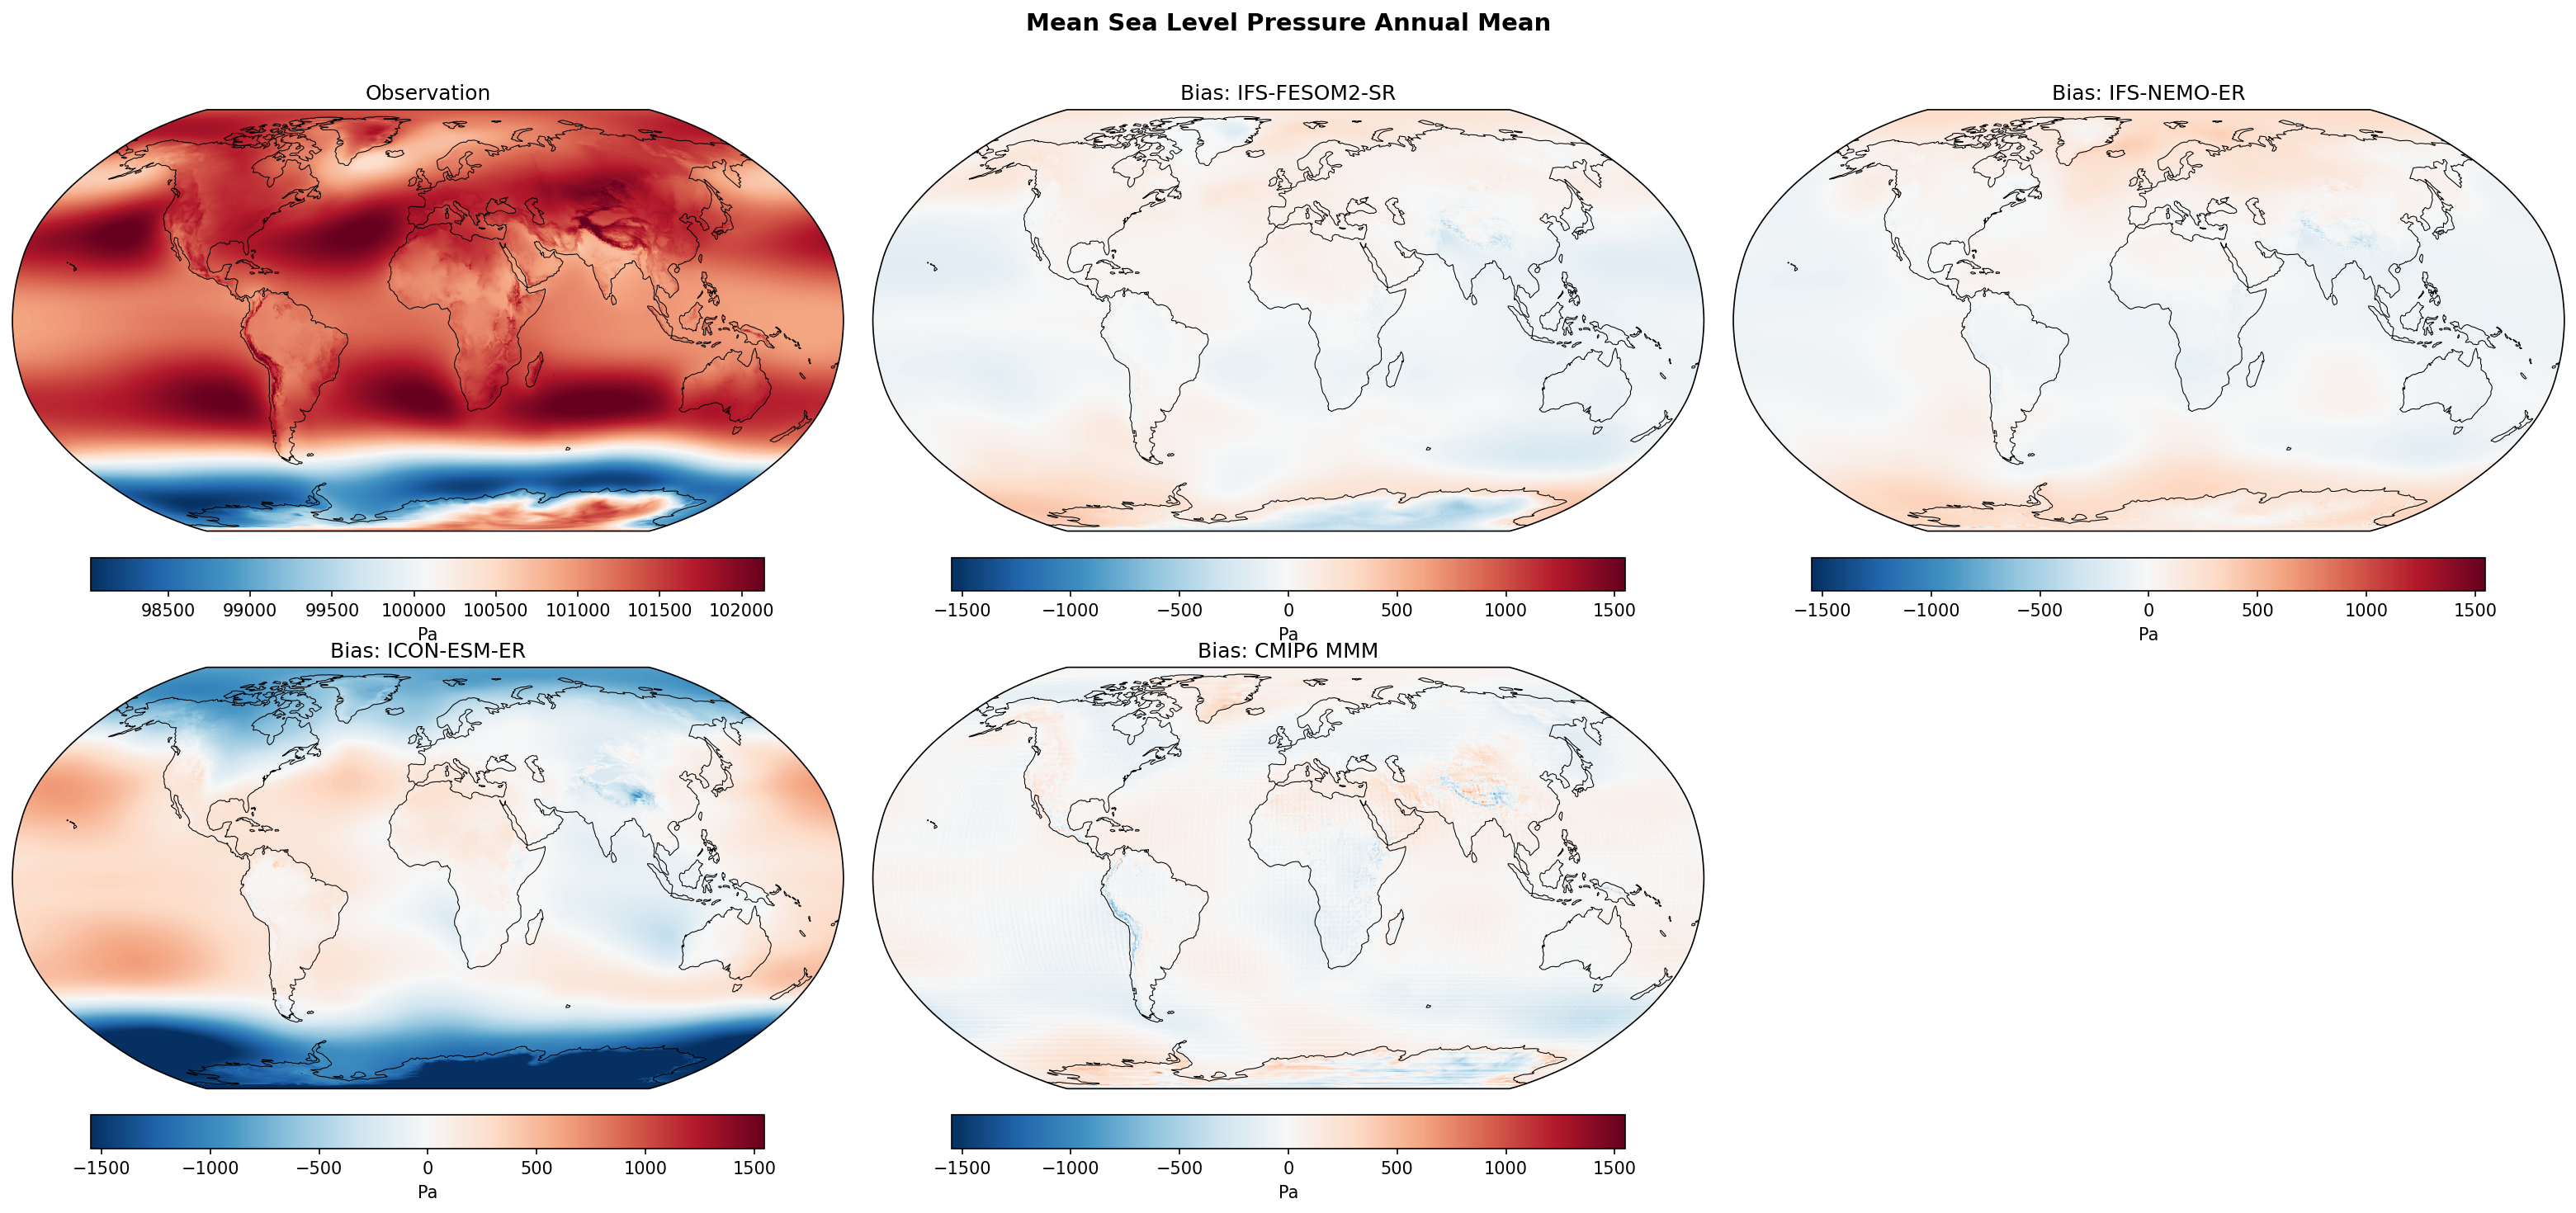
The figure evaluates annual mean Mean Sea Level Pressure (MSLP) biases relative to ERA5 for EERIE high-resolution models and a suite of CMIP6 models. The IFS-based simulations (including EC-Earth3) demonstrate superior performance with low global RMSE (~100 Pa), whereas ICON-ESM-ER and several CMIP6 models exhibit larger systematic biases, particularly in the Southern Hemisphere.
Key Findings
- IFS-FESOM2-SR and IFS-NEMO-ER show remarkably similar bias patterns and low RMSE (~100-101 Pa), comparable to the CMIP6 Multi-Model Mean (RMSE ~88 Pa).
- ICON-ESM-ER displays a prominent zonal bias structure with a strong negative bias in the Southern Ocean (exceeding -1000 Pa) and compensating positive biases in the subtropics and mid-latitudes, resulting in the highest RMSE (~498 Pa) among the highlighted models.
- Biases over high orography (e.g., Himalayas, Antarctica) vary significantly across models (e.g., strong positive bias in IPSL-CM6A-LR, strong negative in ACCESS-ESM1-5), likely reflecting differences in pressure reduction methods or local circulation errors.
Spatial Patterns
The IFS models exhibit weak, spatially incoherent biases, mostly confined to high latitudes (slight negative bias in polar lows) and continents. In contrast, ICON-ESM-ER shows a distinct hemispheric-scale annular mode-like bias pattern, with excessively deep pressure centered around 60°S and high pressure ridges in the mid-latitudes. Many CMIP6 models (e.g., GISS-E2-1-G, INM-CM5-0) show widespread blue (negative) biases or specific regional dipole errors, while the CMIP6 MMM effectively smooths these out.
Model Agreement
There is strong agreement between IFS-FESOM2-SR, IFS-NEMO-ER, and the CMIP6 model EC-Earth3 (which uses the IFS atmosphere), suggesting that the atmospheric component is the primary driver of MSLP climatology rather than the ocean coupling (FESOM vs. NEMO). Inter-model spread is largest over the Southern Ocean and Antarctica.
Physical Interpretation
The strong negative bias in the Southern Ocean for ICON-ESM-ER implies an overly deep Circumpolar Trough, likely associated with excessively strong or poleward-shifted westerly winds (Southern Annular Mode bias). The similarity between the IFS variants confirms that changing the ocean model (unstructured FESOM2 vs. structured NEMO) has minimal impact on the time-mean atmospheric mass distribution, which is dynamically constrained by the atmospheric solver and parameterizations.
Caveats
- Biases over high elevation regions (Himalayas, Greenland, Antarctica) should be interpreted with caution due to the dependence on mathematical reduction of surface pressure to sea level.
- The color scale saturation at ±1000 Pa (10 hPa) may mask the full magnitude of biases in extreme cases like the ICON Southern Ocean anomaly.
Mean Sea Level Pressure DJF Bias
| Variables | psl |
|---|---|
| Models | IFS-FESOM2-SR, IFS-NEMO-ER, ICON-ESM-ER, CMIP6 MMM, MPI-ESM1-2-LR/r1i1p1f1, GISS-E2-1-G/r1i1p1f2, IPSL-CM6A-LR/r1i1p1f1, ACCESS-ESM1-5/r1i1p1f1, EC-Earth3/r1i1p1f1, CNRM-CM6-1/r1i1p1f2, AWI-CM-1-1-MR/r1i1p1f1, CNRM-ESM2-1/r1i1p1f2, FGOALS-g3/r1i1p1f1, INM-CM5-0/r1i1p1f1, MRI-ESM2-0/r1i1p1f1 |
| Reference Dataset | ERA5 |
| Units | Pa |
| Period | 1980–2014 |
| CMIP6 MMM | Global Mean Bias: 5.51 · Rmse: None |
| MPI-ESM1-2-LR/r1i1p1f1 | Global Mean Bias: 16.28 · Rmse: None |
| GISS-E2-1-G/r1i1p1f2 | Global Mean Bias: -133.09 · Rmse: None |
| IPSL-CM6A-LR/r1i1p1f1 | Global Mean Bias: 47.54 · Rmse: None |
| ACCESS-ESM1-5/r1i1p1f1 | Global Mean Bias: 50.70 · Rmse: None |
| EC-Earth3/r1i1p1f1 | Global Mean Bias: -6.60 · Rmse: None |
| CNRM-CM6-1/r1i1p1f2 | Global Mean Bias: 23.11 · Rmse: None |
| AWI-CM-1-1-MR/r1i1p1f1 | Global Mean Bias: 1.57 · Rmse: None |
| CNRM-ESM2-1/r1i1p1f2 | Global Mean Bias: 17.29 · Rmse: None |
| FGOALS-g3/r1i1p1f1 | Global Mean Bias: 77.08 · Rmse: None |
| INM-CM5-0/r1i1p1f1 | Global Mean Bias: -58.32 · Rmse: None |
| MRI-ESM2-0/r1i1p1f1 | Global Mean Bias: 26.13 · Rmse: None |
Summary high
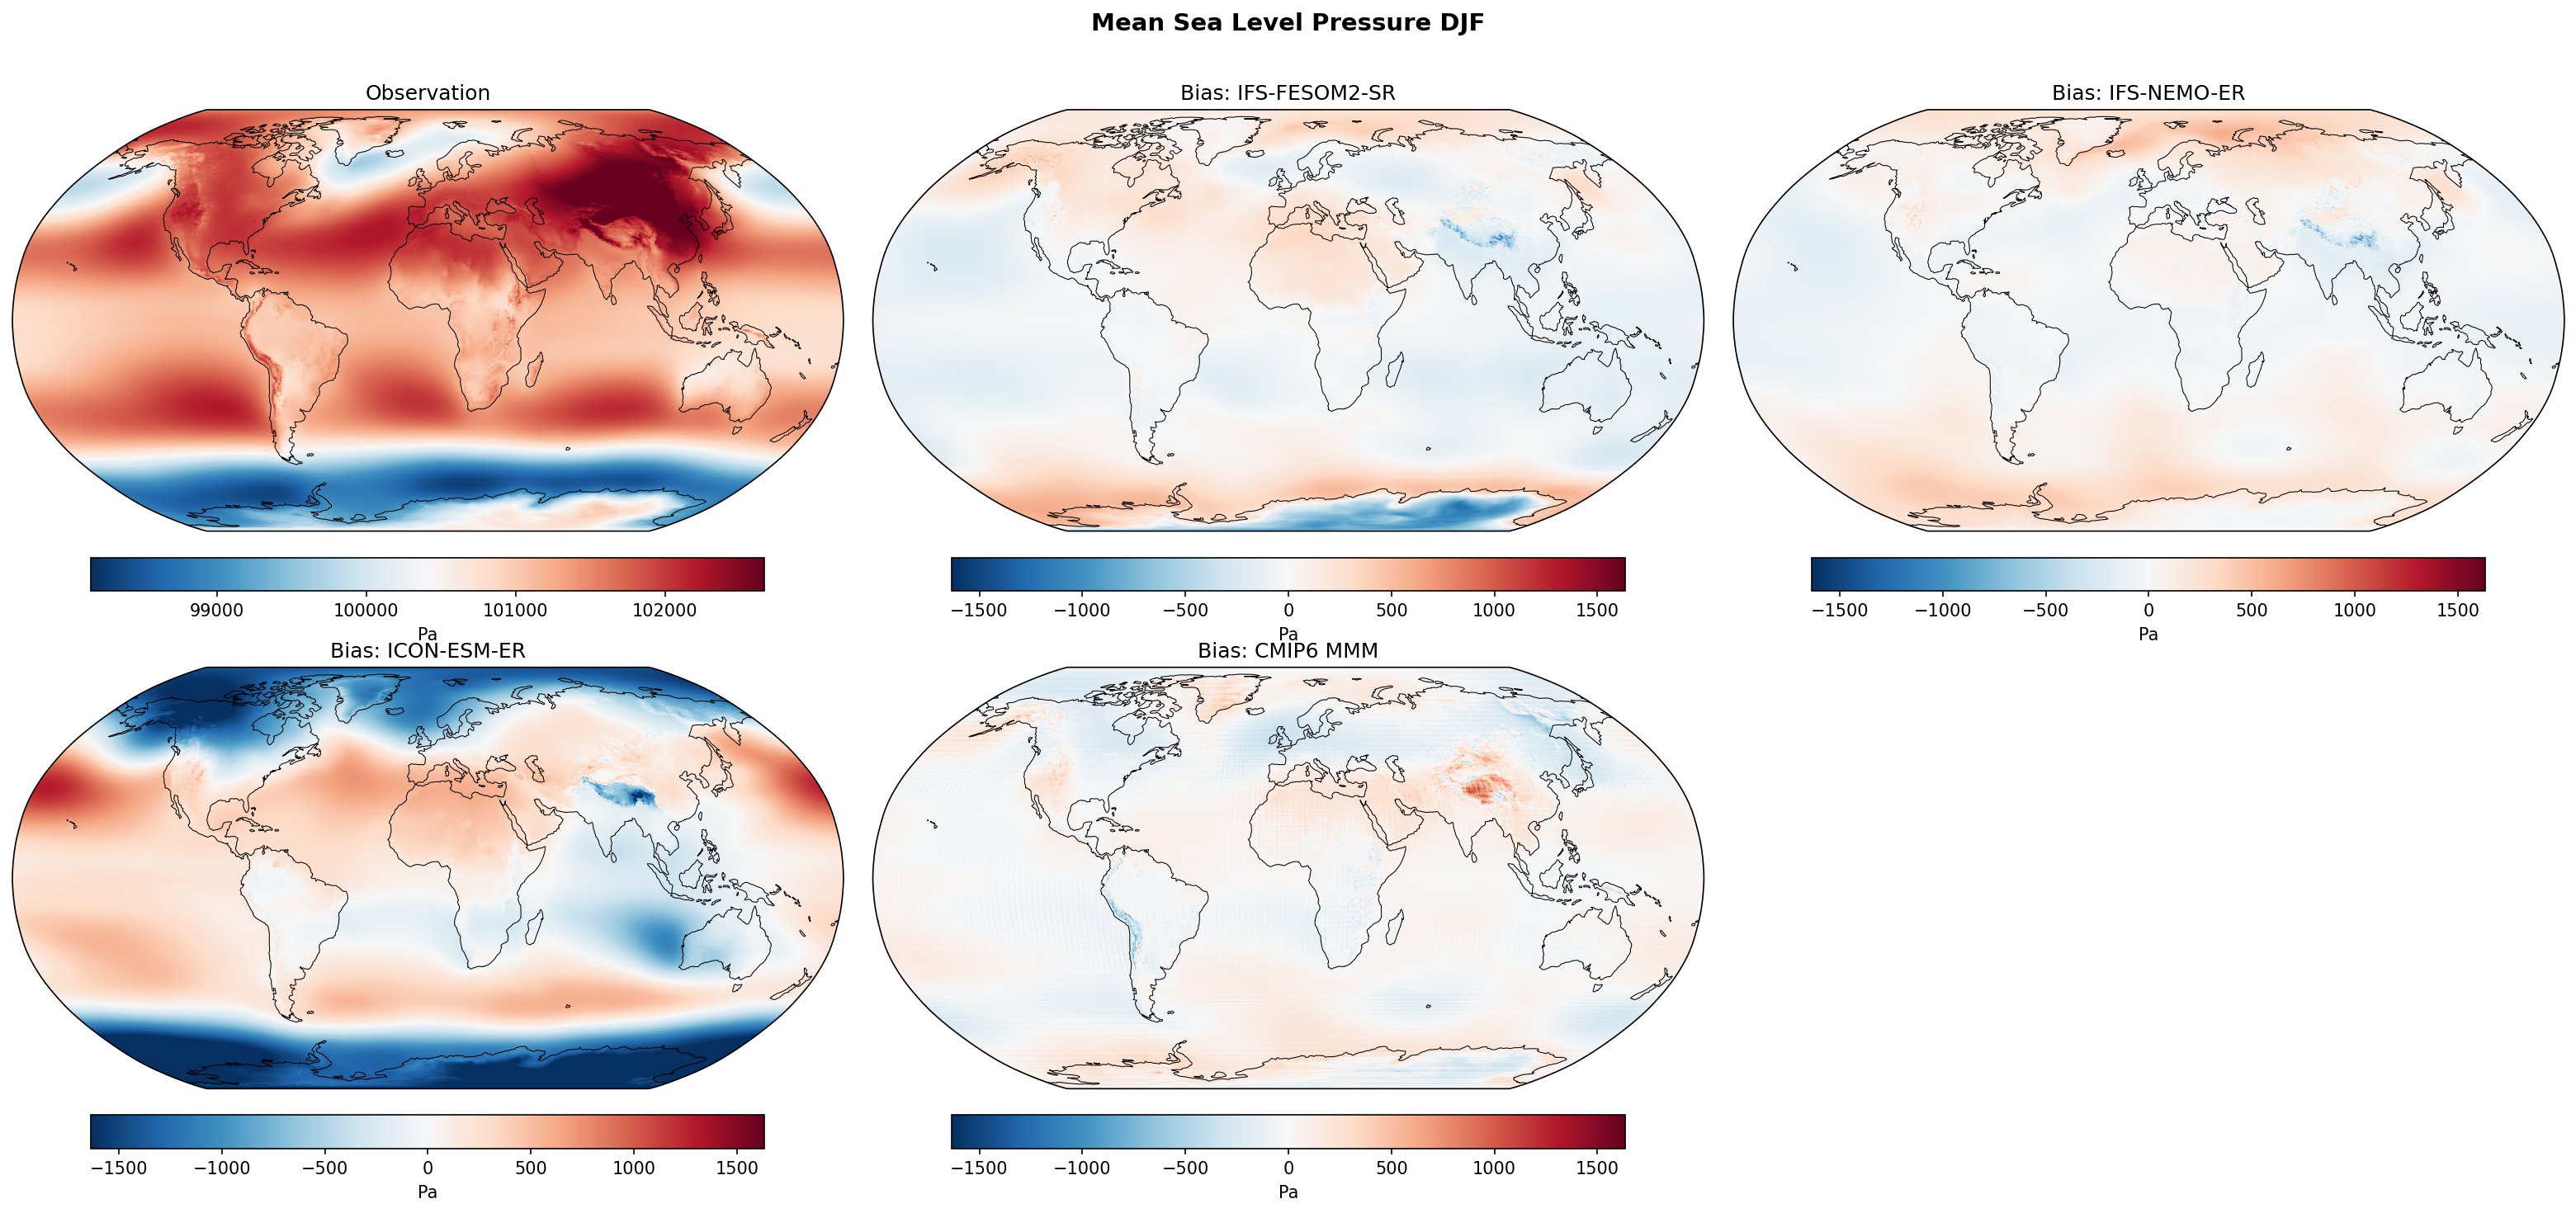
This diagnostic compares DJF Mean Sea Level Pressure (psl) climatological biases relative to ERA5 for three EERIE high-resolution coupled models (IFS-FESOM2-SR, IFS-NEMO-ER, ICON-ESM-ER) and a range of CMIP6 models.
Key Findings
- The two IFS-based models (IFS-FESOM2-SR and IFS-NEMO-ER) exhibit remarkably low biases globally (mostly within ±2 hPa), significantly outperforming ICON-ESM-ER and the CMIP6 Multi-Model Mean.
- ICON-ESM-ER displays severe large-scale biases, characterized by a weakening of the Northern Hemisphere semi-permanent lows (Aleutian and Icelandic) and a strong meridional dipole in the Southern Hemisphere.
- Several low-resolution CMIP6 models (e.g., IPSL-CM6A-LR, FGOALS-g3) show distinct orographic pressure biases over the Himalayas, which are largely absent in the higher-resolution EERIE models.
Spatial Patterns
ICON-ESM-ER shows strong positive biases (>10 hPa, dark red) over the North Pacific and North Atlantic, indicating substantially weaker-than-observed Aleutian and Icelandic Lows. In the Southern Hemisphere, ICON shows a pronounced zonal banding structure: positive bias in mid-latitudes (40–60°S) and negative bias over Antarctica. IFS models show only minor negative biases near the Antarctic coast. CMIP6 models show varied patterns, with GISS-E2-1-G showing a unique wave-like bias in high latitudes.
Model Agreement
There is a stark divergence between the EERIE models: the IFS family shows high fidelity to observations, while ICON-ESM-ER diverges significantly, showing larger biases than the CMIP6 Multi-Model Mean in key circulation regions.
Physical Interpretation
The positive biases in the centers of the Aleutian and Icelandic Lows in ICON-ESM-ER suggest the model underestimates the depth and intensity of wintertime extratropical cyclones (or storm track activity). The Southern Hemisphere dipole in ICON (high pressure bias in mid-latitudes, low over the pole) indicates an excessive meridional pressure gradient and likely overly strong or poleward-shifted westerlies (positive SAM bias). The IFS models' superior performance likely benefits from advanced atmospheric physics parametrizations tuned for NWP.
Caveats
- Analysis is limited to the DJF season; circulation biases often vary seasonally.
- The cause of ICON's large biases (resolution tuning vs. structural physics) cannot be isolated from this plot alone.
Mean Sea Level Pressure JJA Bias
| Variables | psl |
|---|---|
| Models | IFS-FESOM2-SR, IFS-NEMO-ER, ICON-ESM-ER, CMIP6 MMM, MPI-ESM1-2-LR/r1i1p1f1, GISS-E2-1-G/r1i1p1f2, IPSL-CM6A-LR/r1i1p1f1, ACCESS-ESM1-5/r1i1p1f1, EC-Earth3/r1i1p1f1, CNRM-CM6-1/r1i1p1f2, AWI-CM-1-1-MR/r1i1p1f1, CNRM-ESM2-1/r1i1p1f2, FGOALS-g3/r1i1p1f1, INM-CM5-0/r1i1p1f1, MRI-ESM2-0/r1i1p1f1 |
| Reference Dataset | ERA5 |
| Units | Pa |
| Period | 1980–2014 |
| CMIP6 MMM | Global Mean Bias: -19.52 · Rmse: None |
| MPI-ESM1-2-LR/r1i1p1f1 | Global Mean Bias: -28.57 · Rmse: None |
| GISS-E2-1-G/r1i1p1f2 | Global Mean Bias: -153.91 · Rmse: None |
| IPSL-CM6A-LR/r1i1p1f1 | Global Mean Bias: 25.92 · Rmse: None |
| ACCESS-ESM1-5/r1i1p1f1 | Global Mean Bias: 32.87 · Rmse: None |
| EC-Earth3/r1i1p1f1 | Global Mean Bias: -14.80 · Rmse: None |
| CNRM-CM6-1/r1i1p1f2 | Global Mean Bias: 17.60 · Rmse: None |
| AWI-CM-1-1-MR/r1i1p1f1 | Global Mean Bias: -42.66 · Rmse: None |
| CNRM-ESM2-1/r1i1p1f2 | Global Mean Bias: 14.80 · Rmse: None |
| FGOALS-g3/r1i1p1f1 | Global Mean Bias: 30.64 · Rmse: None |
| INM-CM5-0/r1i1p1f1 | Global Mean Bias: -93.68 · Rmse: None |
| MRI-ESM2-0/r1i1p1f1 | Global Mean Bias: -3.18 · Rmse: None |
Summary high
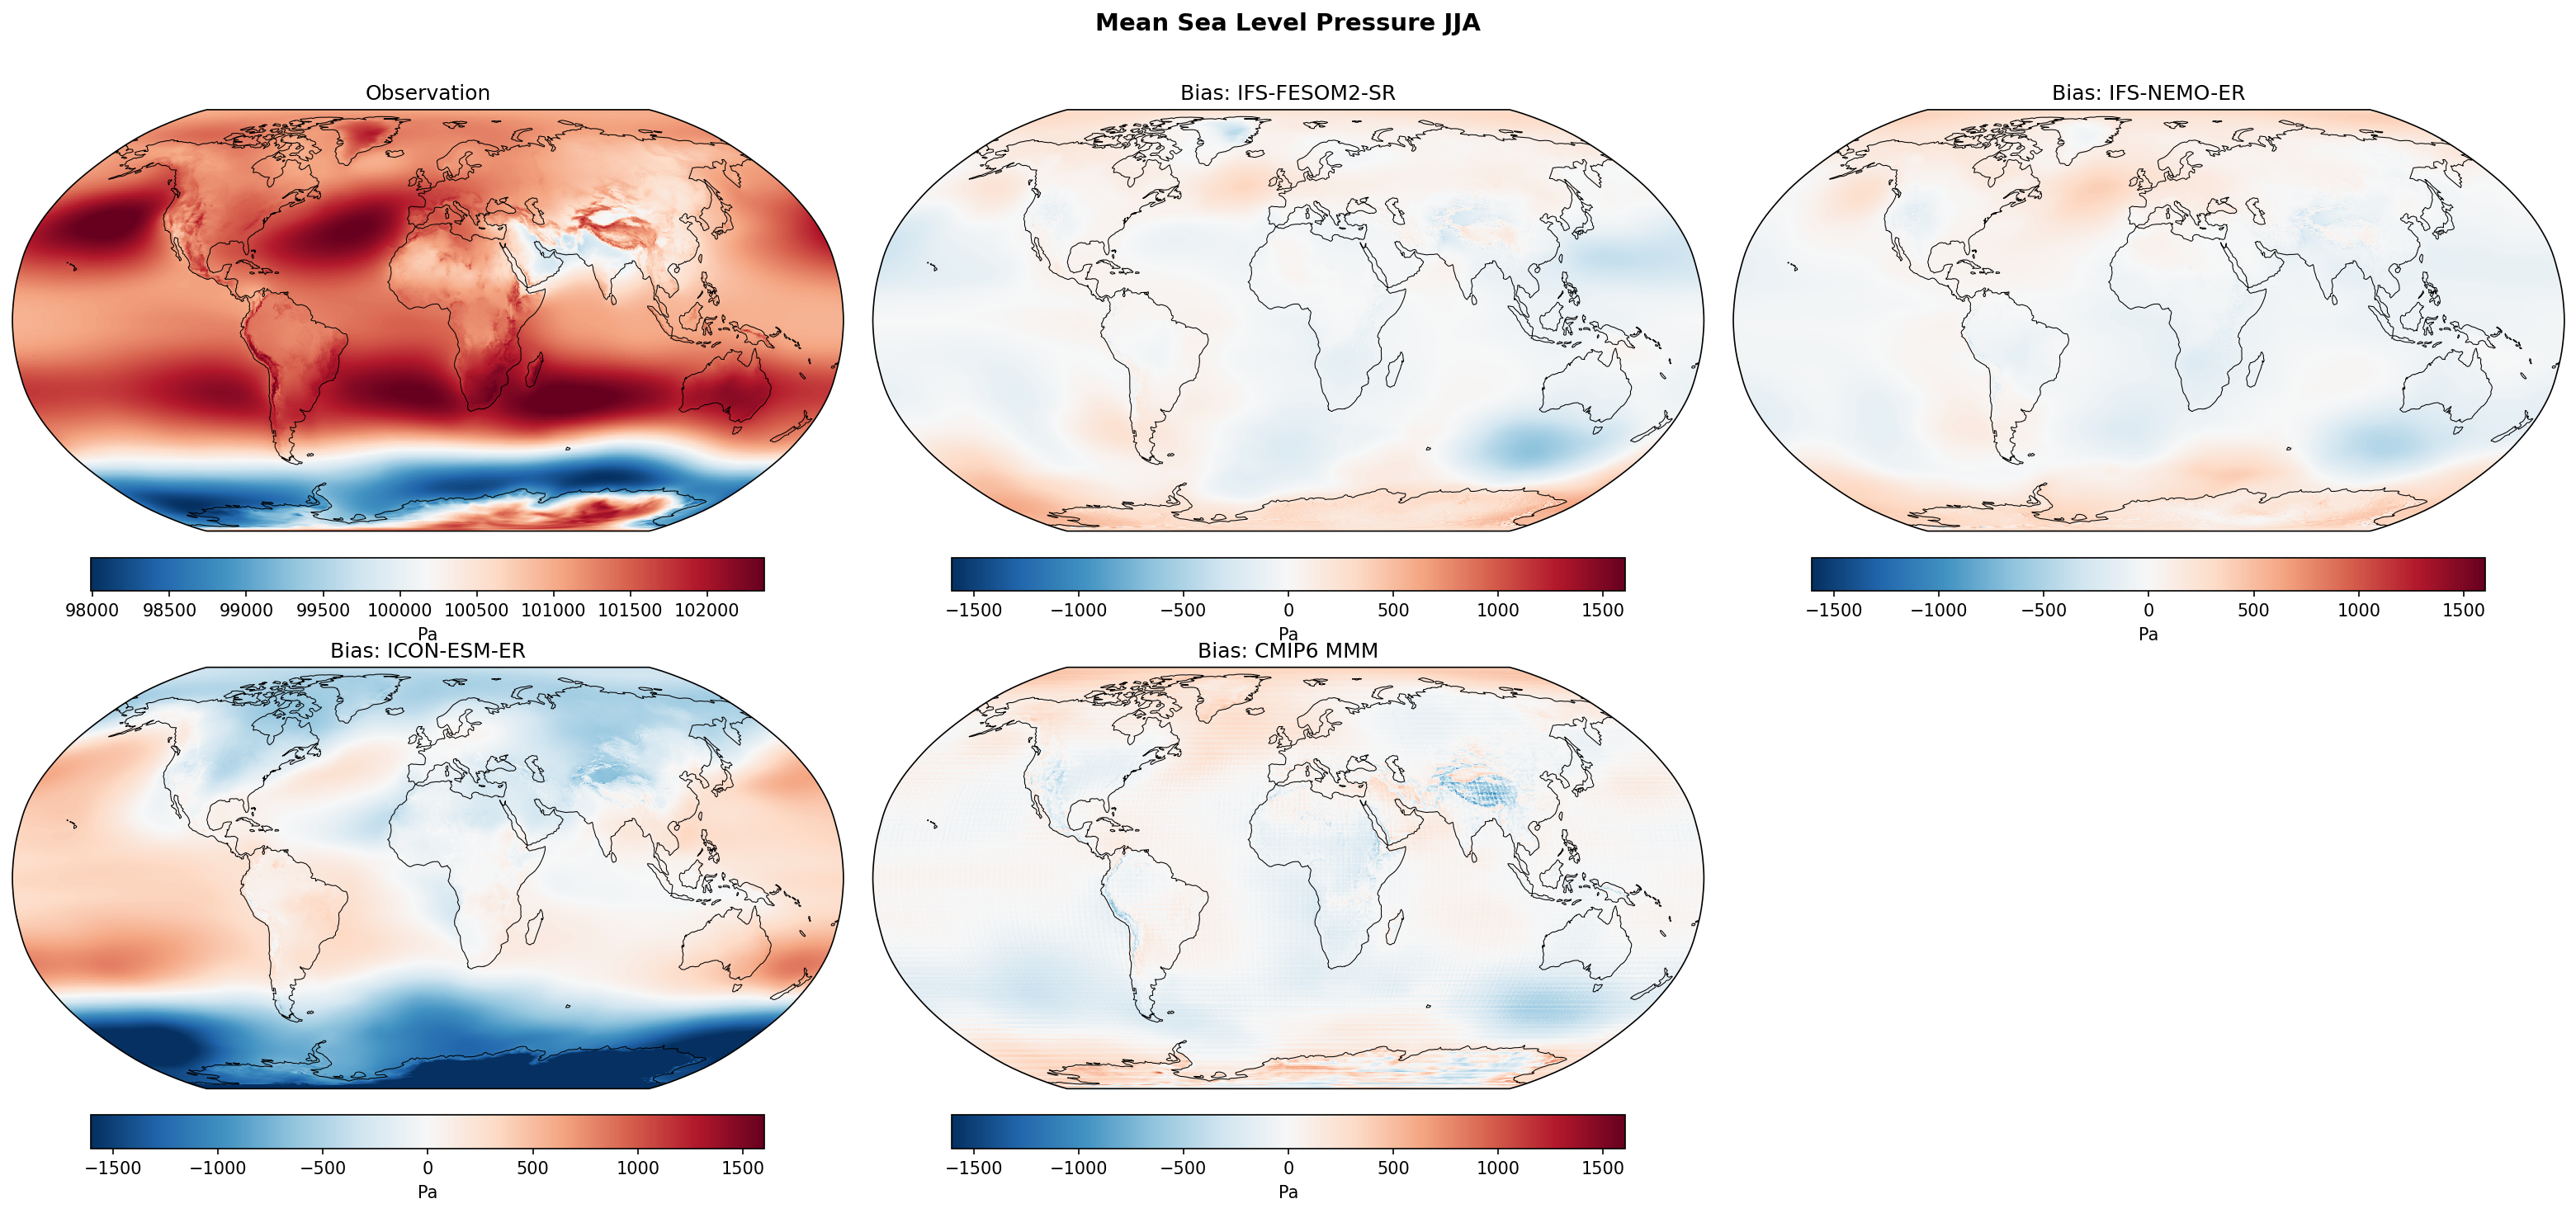
This figure evaluates Mean Sea Level Pressure (PSL) biases for JJA climatology in three high-resolution EERIE models (IFS-FESOM2-SR, IFS-NEMO-ER, ICON-ESM-ER) and the CMIP6 ensemble against ERA5. The IFS-based models demonstrate superior performance with minimal global biases, whereas ICON-ESM-ER exhibits pronounced zonal bias structures similar to some CMIP6 models.
Key Findings
- IFS-FESOM2-SR and IFS-NEMO-ER show remarkably similar and low-magnitude bias patterns, suggesting the atmospheric model component (IFS) dominates the PSL mean state skill rather than the choice of ocean model (FESOM vs NEMO).
- ICON-ESM-ER displays strong systematic biases: a deep negative bias belt in the Southern Ocean (exceeding -1000 Pa) and strong positive biases in the subtropical highs of both hemispheres (particularly North Pacific and South Indian Ocean).
- The IFS models significantly outperform the CMIP6 Multi-Model Mean (MMM) and most individual CMIP6 models, which typically struggle with excessive Southern Ocean low pressure and overestimated subtropical highs.
- Positive pressure biases over the Arctic and Greenland are visible in the IFS models, though less severe than the biases seen in ICON or many CMIP6 members.
Spatial Patterns
In the Southern Hemisphere (winter in JJA), ICON-ESM-ER shows a distinct annular mode bias with pressure too low around 60°S and too high around 30-40°S, implying an overly strong meridional pressure gradient and intensified westerlies. In the Northern Hemisphere (summer), ICON overestimates the strength of the North Pacific High. The IFS models are much neutral, with weak positive biases over the North Pacific and weak negative biases restricted to the Amundsen Sea sector.
Model Agreement
There is extremely high agreement between the two IFS variants, indicating robustness to ocean coupling strategy. There is significant divergence between the IFS class and the ICON model; ICON's bias morphology more closely resembles 'traditional' CMIP6 biases (e.g., ACCESS-ESM1-5, FGOALS-g3) than the IFS pattern.
Physical Interpretation
The deep negative bias in the Southern Ocean in ICON-ESM-ER indicates an intensification of the storm track and a positive SAM-like bias (too strong westerlies), a common issue in climate models often linked to cloud-radiative feedback errors or momentum flux parameterization. The superior performance of IFS likely results from its operational weather forecasting heritage, where minimizing pressure biases is a primary tuning objective. The positive biases over subtropical oceans in ICON suggest overly strong subsidence.
Caveats
- Biases over high topography (Antarctica, Greenland, Himalayas) strongly depend on the pressure reduction method to sea level and should be interpreted with caution.
- The color scale saturates at ±1000 Pa; biases in ICON's Southern Ocean region likely exceed this range significantly.
Surface Downwelling Longwave Annual Mean Bias
| Variables | rlds |
|---|---|
| Models | IFS-FESOM2-SR, IFS-NEMO-ER, ICON-ESM-ER, CMIP6 MMM, MPI-ESM1-2-LR/r1i1p1f1, GISS-E2-1-G/r1i1p1f2, IPSL-CM6A-LR/r1i1p1f1, ACCESS-ESM1-5/r1i1p1f1, EC-Earth3/r1i1p1f1, CNRM-CM6-1/r1i1p1f2, AWI-CM-1-1-MR/r1i1p1f1, CNRM-ESM2-1/r1i1p1f2, FGOALS-g3/r1i1p1f1, INM-CM5-0/r1i1p1f1, MRI-ESM2-0/r1i1p1f1 |
| Reference Dataset | ERA5 |
| Units | W/m2 |
| Period | 1980–2014 |
| IFS-FESOM2-SR | Global Mean Bias: 0.02 · Rmse: 6.70 |
| IFS-NEMO-ER | Global Mean Bias: -6.25 · Rmse: 8.20 |
| ICON-ESM-ER | Global Mean Bias: 1.38 · Rmse: 13.02 |
| CMIP6 MMM | Global Mean Bias: 1.23 · Rmse: 6.44 |
| MPI-ESM1-2-LR/r1i1p1f1 | Global Mean Bias: 3.94 · Rmse: 11.49 |
| GISS-E2-1-G/r1i1p1f2 | Global Mean Bias: 9.58 · Rmse: 15.66 |
| IPSL-CM6A-LR/r1i1p1f1 | Global Mean Bias: 4.04 · Rmse: 11.78 |
| ACCESS-ESM1-5/r1i1p1f1 | Global Mean Bias: 6.05 · Rmse: 10.28 |
| EC-Earth3/r1i1p1f1 | Global Mean Bias: -0.65 · Rmse: 9.22 |
| CNRM-CM6-1/r1i1p1f2 | Global Mean Bias: -3.47 · Rmse: 8.07 |
| AWI-CM-1-1-MR/r1i1p1f1 | Global Mean Bias: 3.82 · Rmse: 9.52 |
| CNRM-ESM2-1/r1i1p1f2 | Global Mean Bias: -0.10 · Rmse: 7.39 |
| FGOALS-g3/r1i1p1f1 | Global Mean Bias: -6.56 · Rmse: 12.81 |
| INM-CM5-0/r1i1p1f1 | Global Mean Bias: -5.62 · Rmse: 11.15 |
| MRI-ESM2-0/r1i1p1f1 | Global Mean Bias: 2.51 · Rmse: 8.12 |
Summary high
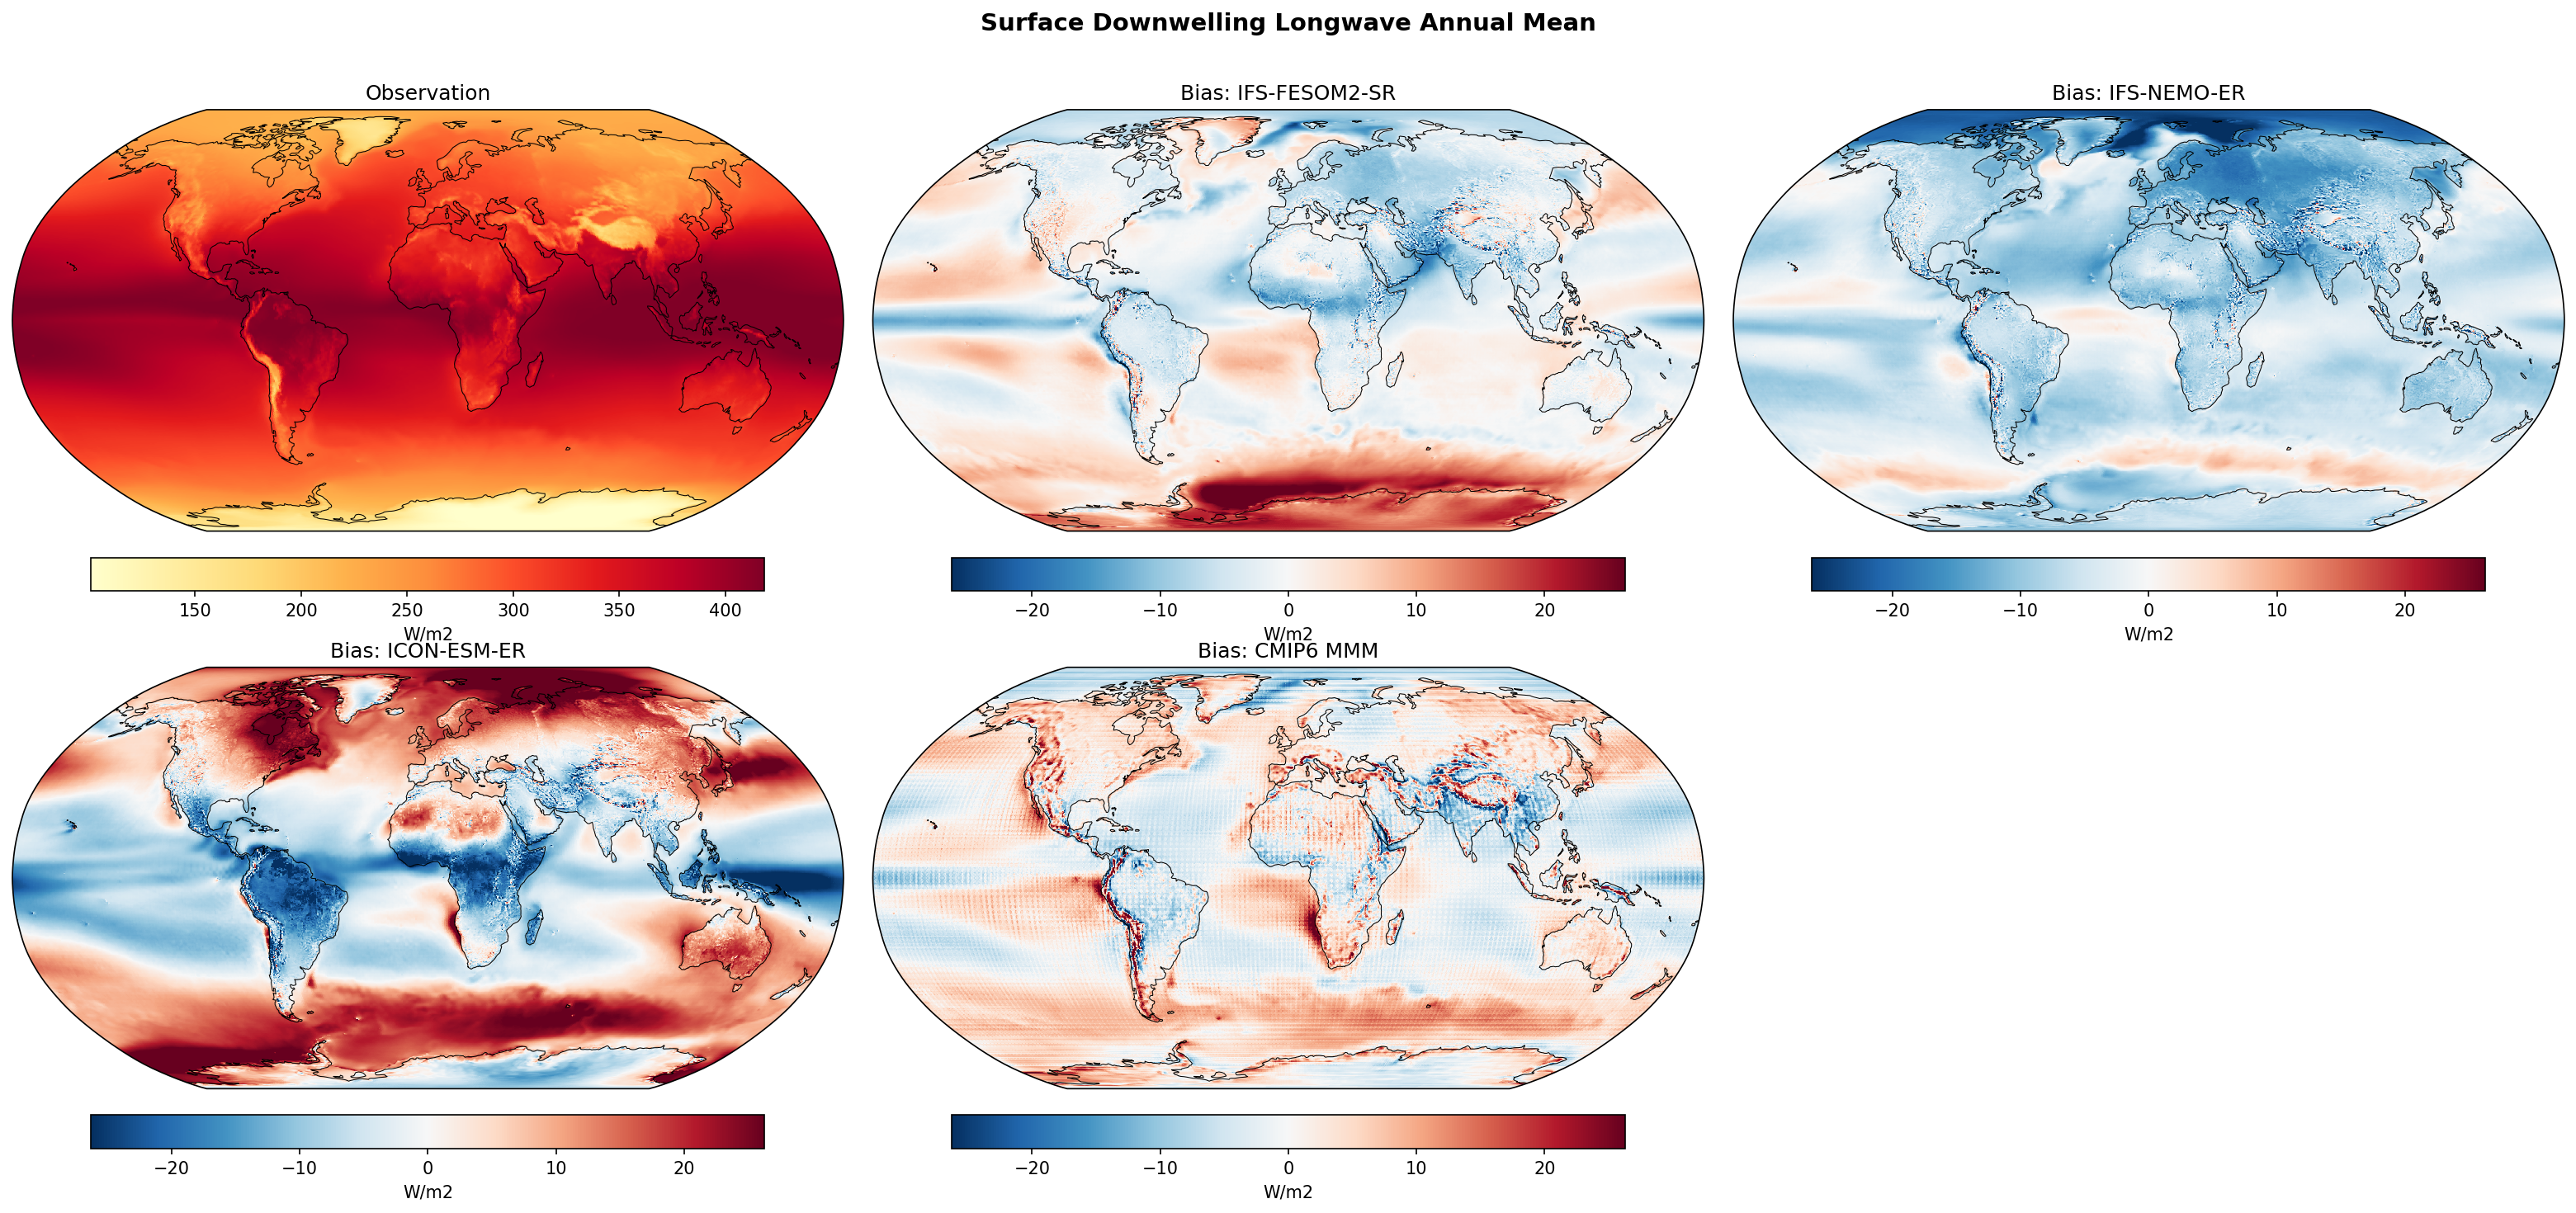
IFS-FESOM2-SR demonstrates remarkable accuracy with a near-zero global mean bias, significantly outperforming IFS-NEMO-ER (systematic underestimation) and ICON-ESM-ER (large regional errors). The IFS models generally handle stratocumulus regions better than ICON-ESM-ER and the CMIP6 Multi-Model Mean.
Key Findings
- IFS-FESOM2-SR achieves the lowest global mean bias (+0.02 W/m²) among all evaluated models, though it exhibits a distinct positive bias band in the Southern Ocean.
- IFS-NEMO-ER shows a systematic negative bias (-6.25 W/m²) globally, underestimating downwelling longwave radiation over both ocean and land relative to ERA5.
- ICON-ESM-ER has a high RMSE (13.0 W/m²) driven by strong dipolar biases: excessive downwelling radiation in the ITCZ/SPCZ (positive bias) and deficits in eastern boundary stratocumulus regions (negative bias).
- Common CMIP6 biases, such as negative deficits over stratocumulus decks and deserts, are present in the MMM and ICON but largely ameliorated in IFS-FESOM2-SR.
Spatial Patterns
The Southern Ocean features a zonal band of positive bias in IFS-FESOM2-SR and ICON-ESM-ER, indicating excessive cloudiness or humidity. In contrast, eastern subtropical ocean basins (off Peru, Namibia, California) show strong negative biases in ICON-ESM-ER and the CMIP6 MMM, characteristic of missing low-level stratocumulus clouds. IFS-NEMO-ER lacks these strong regional contrasts but is uniformly too 'cold/clear' (blue bias) everywhere.
Model Agreement
Inter-model spread is large. IFS-FESOM2-SR aligns closest to ERA5. IFS-NEMO-ER and ICON-ESM-ER diverge in opposite directions (systematic negative vs. regionally compensating errors). Several CMIP6 models (e.g., GISS-E2-1-G, ACCESS-ESM1-5) show strong global positive biases (>6 W/m²), while others (FGOALS-g3, INM-CM5-0) match the negative bias of IFS-NEMO-ER.
Physical Interpretation
Surface downwelling longwave radiation is primarily driven by atmospheric temperature, water vapor, and cloud cover. The positive bias in the ITCZ for ICON-ESM-ER suggests excessive deep convective cloud cover or humidity. The negative bias in upwelling regions (ICON/CMIP6) is a classic symptom of underestimated stratocumulus cloud fraction, which reduces atmospheric emissivity. The systematic negative bias in IFS-NEMO-ER implies a generally drier atmosphere or reduced cloud cover compared to its FESOM-coupled counterpart, potentially linked to cooler SSTs or different tuning.
Caveats
- ERA5 is a reanalysis product; while robust for radiative fluxes, it is not a direct observation like CERES.
- Biases in rlds are often coupled with SST biases; interpreting causality (does low rlds cool SST, or does cold SST reduce evaporation/rlds?) requires coupled diagnostics.
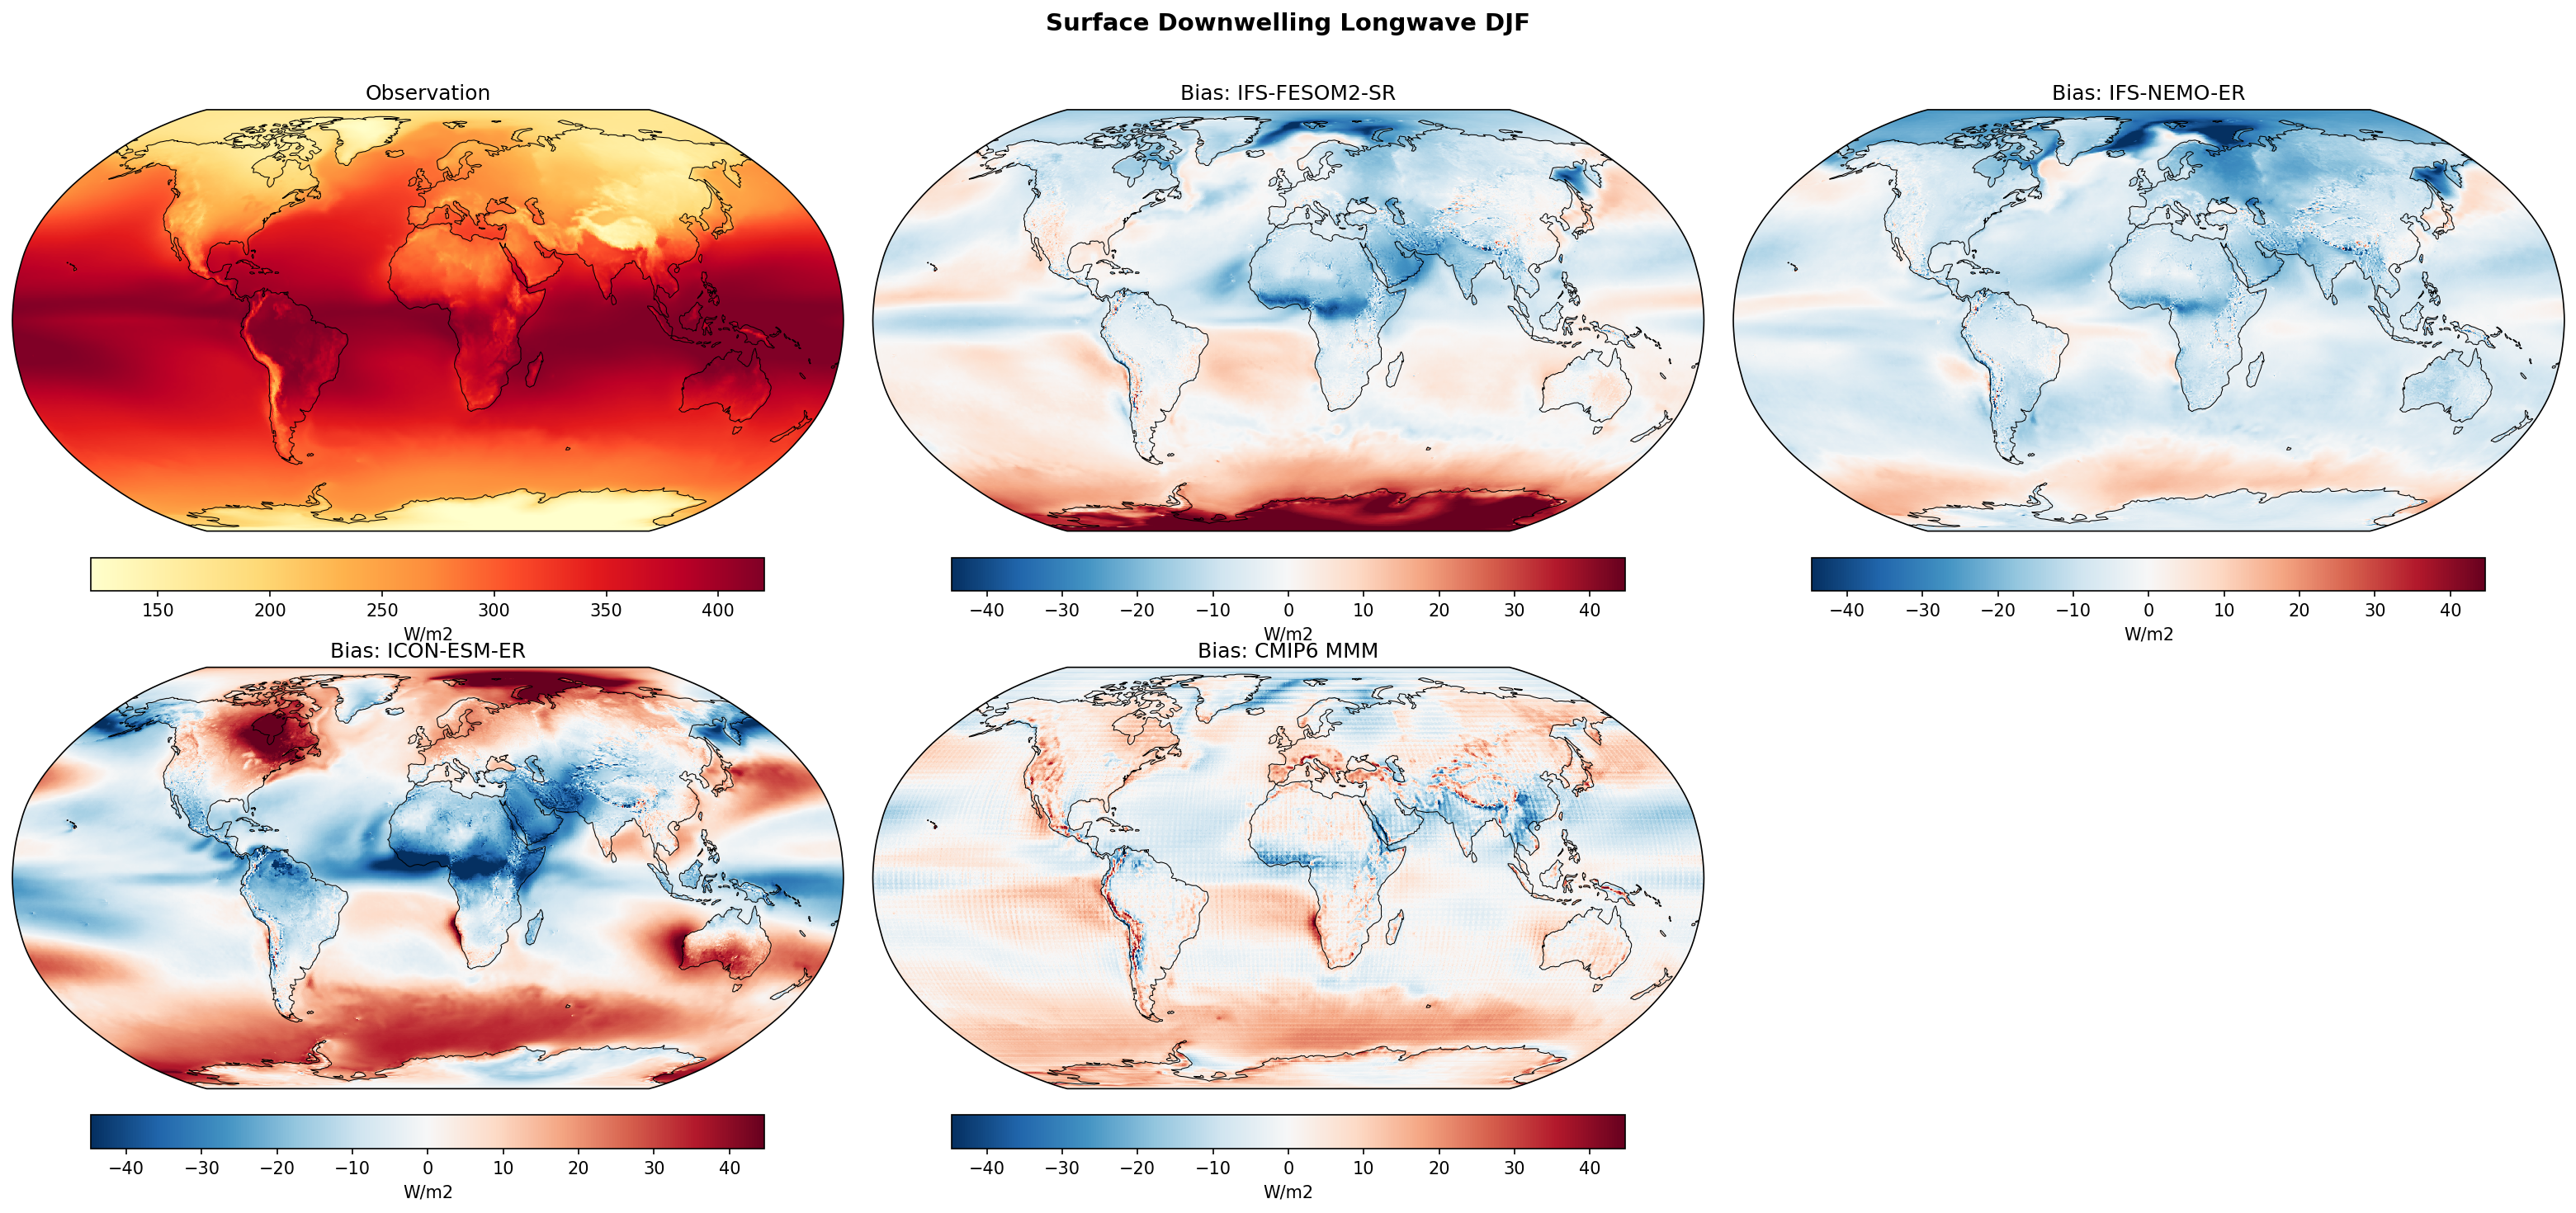
Surface Downwelling Longwave DJF Bias
| Variables | rlds |
|---|---|
| Models | IFS-FESOM2-SR, IFS-NEMO-ER, ICON-ESM-ER, CMIP6 MMM, MPI-ESM1-2-LR/r1i1p1f1, GISS-E2-1-G/r1i1p1f2, IPSL-CM6A-LR/r1i1p1f1, ACCESS-ESM1-5/r1i1p1f1, EC-Earth3/r1i1p1f1, CNRM-CM6-1/r1i1p1f2, AWI-CM-1-1-MR/r1i1p1f1, CNRM-ESM2-1/r1i1p1f2, FGOALS-g3/r1i1p1f1, INM-CM5-0/r1i1p1f1, MRI-ESM2-0/r1i1p1f1 |
| Reference Dataset | ERA5 |
| Units | W/m2 |
| Period | 1980–2014 |
| CMIP6 MMM | Global Mean Bias: 1.77 · Rmse: None |
| MPI-ESM1-2-LR/r1i1p1f1 | Global Mean Bias: 4.06 · Rmse: None |
| GISS-E2-1-G/r1i1p1f2 | Global Mean Bias: 11.30 · Rmse: None |
| IPSL-CM6A-LR/r1i1p1f1 | Global Mean Bias: 3.73 · Rmse: None |
| ACCESS-ESM1-5/r1i1p1f1 | Global Mean Bias: 6.34 · Rmse: None |
| EC-Earth3/r1i1p1f1 | Global Mean Bias: 0.14 · Rmse: None |
| CNRM-CM6-1/r1i1p1f2 | Global Mean Bias: -3.20 · Rmse: None |
| AWI-CM-1-1-MR/r1i1p1f1 | Global Mean Bias: 3.99 · Rmse: None |
| CNRM-ESM2-1/r1i1p1f2 | Global Mean Bias: 0.06 · Rmse: None |
| FGOALS-g3/r1i1p1f1 | Global Mean Bias: -5.69 · Rmse: None |
| INM-CM5-0/r1i1p1f1 | Global Mean Bias: -5.52 · Rmse: None |
| MRI-ESM2-0/r1i1p1f1 | Global Mean Bias: 4.33 · Rmse: None |
Summary high
This diagnostic evaluates DJF surface downwelling longwave radiation (rlds) biases in high-resolution EERIE models against ERA5, revealing significant regional systematic errors that differ between the IFS and ICON atmospheric cores.
Key Findings
- IFS-FESOM2-SR and IFS-NEMO-ER exhibit a strong hemispheric contrast: pervasive negative biases (insufficient downwelling LW) over Northern Hemisphere continents and oceans, and positive biases over the Southern Ocean and Antarctica.
- ICON-ESM-ER displays a distinct bias structure compared to IFS, with strong positive biases (>30 W/m²) in the high latitudes (Arctic, Antarctic, and storm tracks) and negative biases in the tropics.
- The Southern Ocean positive bias is a robust feature across almost all models shown, including the CMIP6 Multi-Model Mean, indicating a common difficulty in simulating the radiative properties of the marine boundary layer in this region.
- GISS-E2-1-G stands out with a massive global positive bias (~11.3 W/m² global mean), significantly warmer than the ensemble.
Spatial Patterns
The IFS models show a zonal 'blue North / red South' asymmetry in DJF. The negative bias is most pronounced over Eurasian and North American landmasses (winter hemisphere). ICON-ESM-ER shows a 'warm poles / cool tropics' radiative bias pattern. The CMIP6 MMM shows a smoother pattern with positive biases in the Arctic and Southern Ocean but weak negative biases in the tropical Pacific.
Model Agreement
There is near-perfect agreement between IFS-FESOM2-SR and IFS-NEMO-ER, confirming that the biases are driven by the common atmospheric component (OpenIFS) and cloud physics rather than the ocean model choice. The inter-model spread within CMIP6 is large, with models like GISS and ACCESS showing strong positive biases, while INM and FGOALS show widespread negative biases.
Physical Interpretation
Biases in rlds are primarily driven by errors in lower tropospheric temperature, humidity, and cloud base height/fraction. The IFS negative bias over NH winter continents suggests a cold lower atmosphere or a lack of insulating low-level clouds/water vapor, which would enhance surface cooling. The pervasive positive bias over the Southern Ocean suggests excessive emission from low clouds (too much liquid water or cloud fraction) or a warm boundary layer bias. ICON's tropical negative bias implies insufficient humidity or cloud radiative forcing in the ITCZ region.
Caveats
- ERA5 is a reanalysis product; while robust, it relies on its own model physics for radiative transfer in data-sparse regions like the Southern Ocean.
- The analysis is limited to DJF (boreal winter/austral summer); biases may shift seasonally.
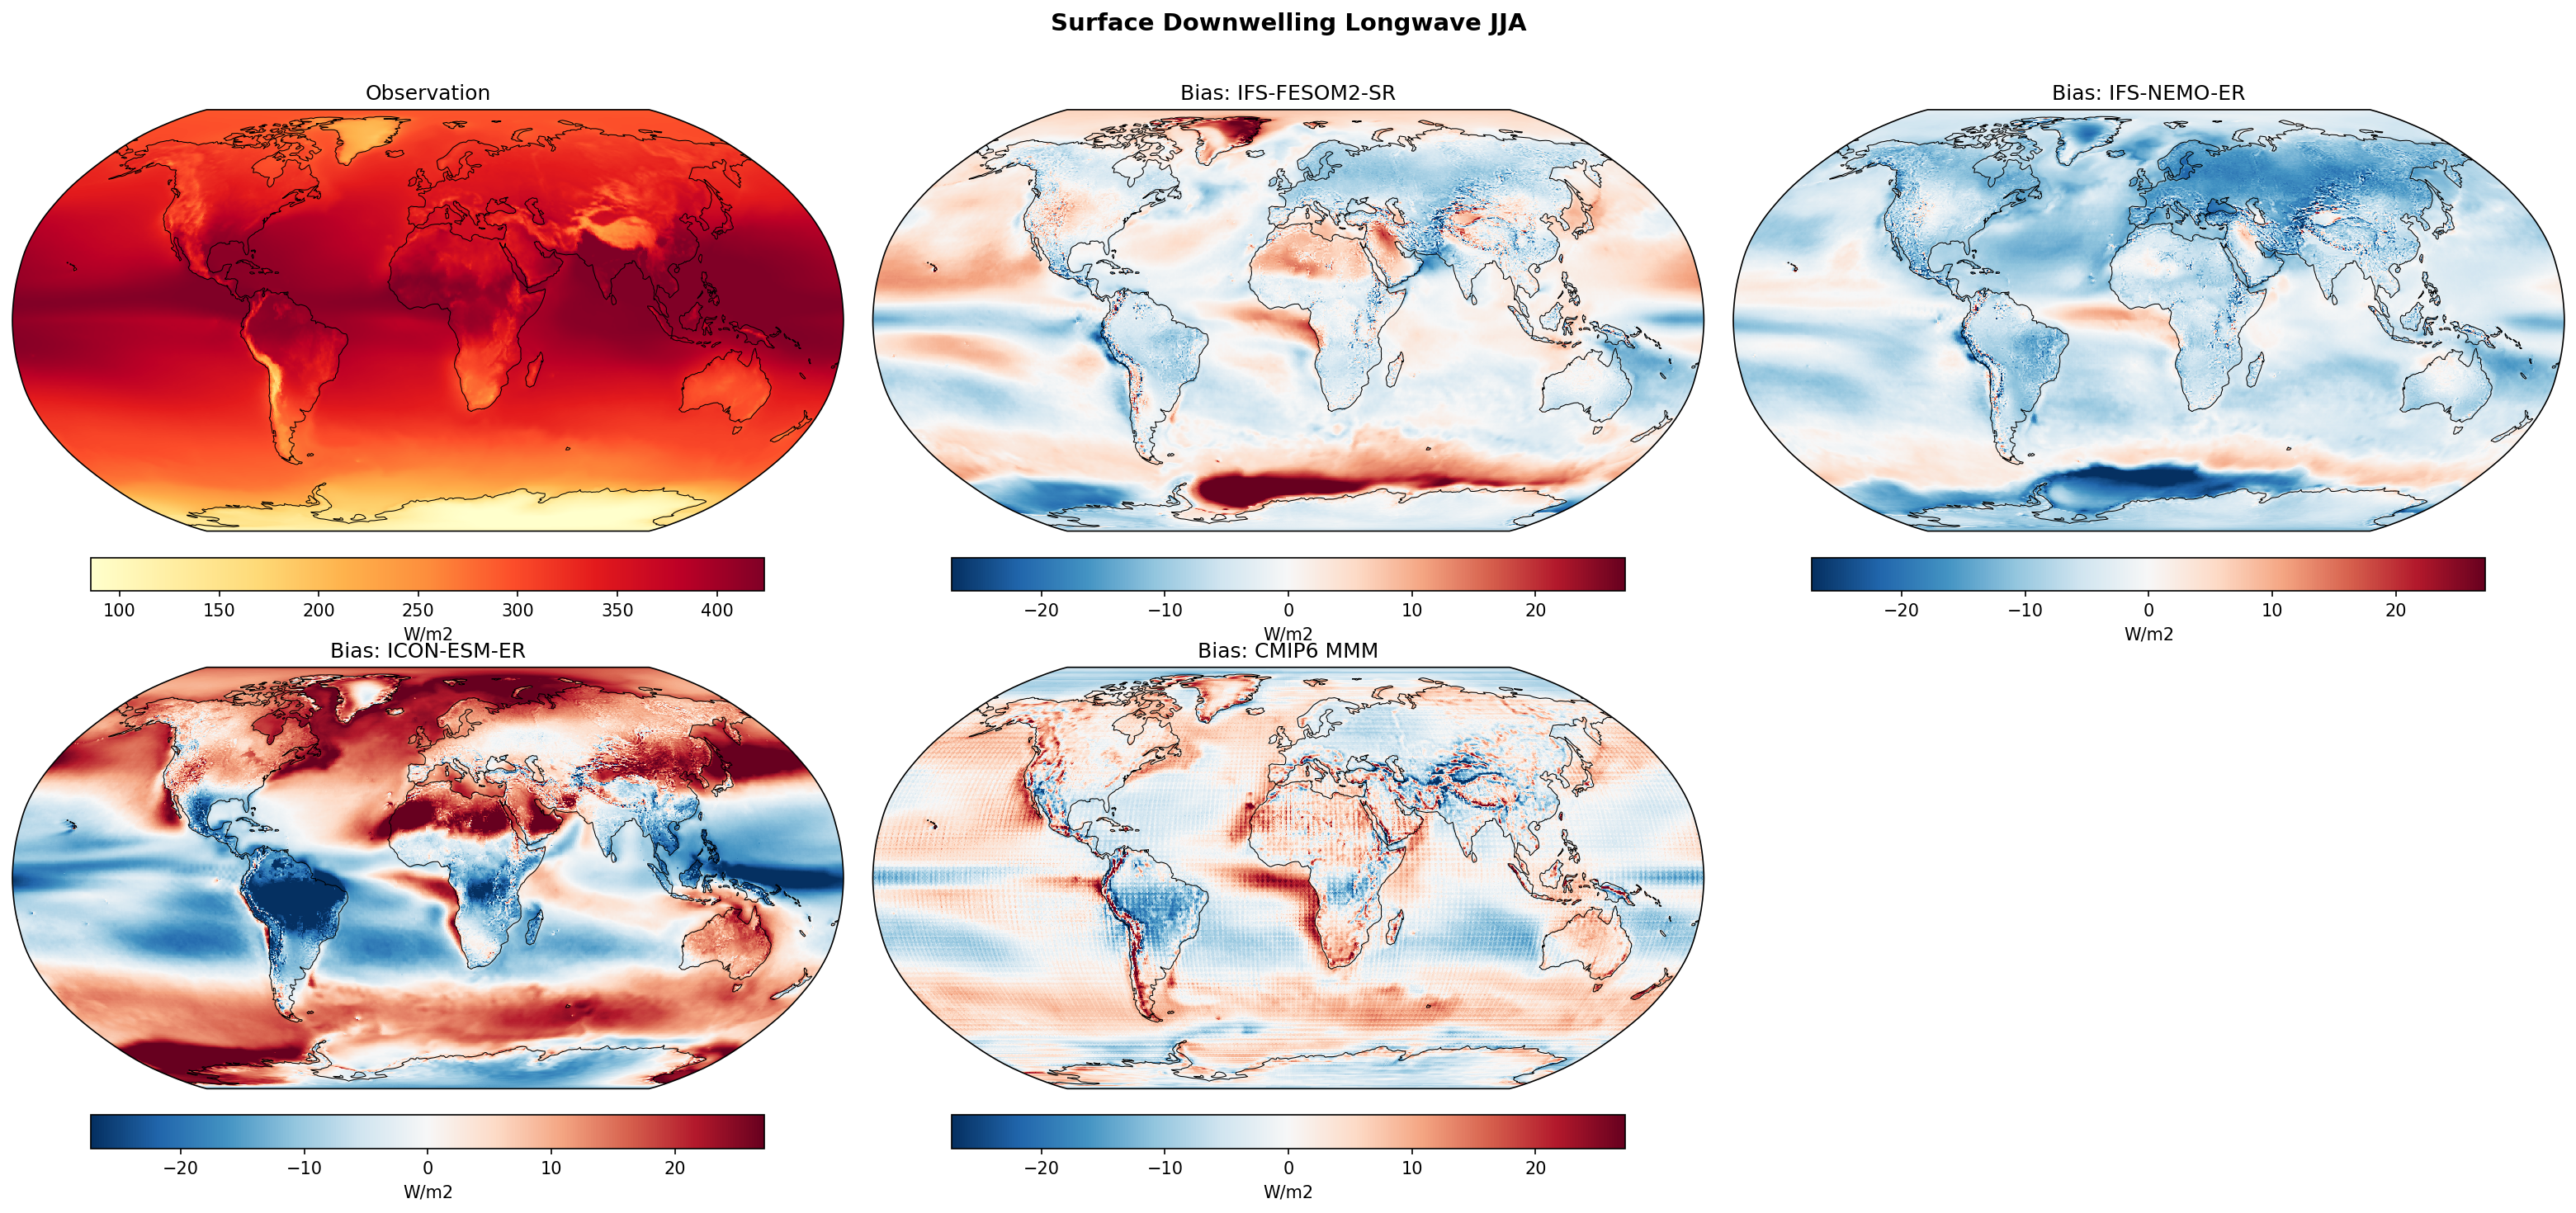
Surface Downwelling Longwave JJA Bias
| Variables | rlds |
|---|---|
| Models | IFS-FESOM2-SR, IFS-NEMO-ER, ICON-ESM-ER, CMIP6 MMM, MPI-ESM1-2-LR/r1i1p1f1, GISS-E2-1-G/r1i1p1f2, IPSL-CM6A-LR/r1i1p1f1, ACCESS-ESM1-5/r1i1p1f1, EC-Earth3/r1i1p1f1, CNRM-CM6-1/r1i1p1f2, AWI-CM-1-1-MR/r1i1p1f1, CNRM-ESM2-1/r1i1p1f2, FGOALS-g3/r1i1p1f1, INM-CM5-0/r1i1p1f1, MRI-ESM2-0/r1i1p1f1 |
| Reference Dataset | ERA5 |
| Units | W/m2 |
| Period | 1980–2014 |
| CMIP6 MMM | Global Mean Bias: 0.68 · Rmse: None |
| MPI-ESM1-2-LR/r1i1p1f1 | Global Mean Bias: 3.77 · Rmse: None |
| GISS-E2-1-G/r1i1p1f2 | Global Mean Bias: 7.37 · Rmse: None |
| IPSL-CM6A-LR/r1i1p1f1 | Global Mean Bias: 3.08 · Rmse: None |
| ACCESS-ESM1-5/r1i1p1f1 | Global Mean Bias: 5.78 · Rmse: None |
| EC-Earth3/r1i1p1f1 | Global Mean Bias: -1.00 · Rmse: None |
| CNRM-CM6-1/r1i1p1f2 | Global Mean Bias: -3.65 · Rmse: None |
| AWI-CM-1-1-MR/r1i1p1f1 | Global Mean Bias: 3.64 · Rmse: None |
| CNRM-ESM2-1/r1i1p1f2 | Global Mean Bias: -0.09 · Rmse: None |
| FGOALS-g3/r1i1p1f1 | Global Mean Bias: -7.16 · Rmse: None |
| INM-CM5-0/r1i1p1f1 | Global Mean Bias: -5.57 · Rmse: None |
| MRI-ESM2-0/r1i1p1f1 | Global Mean Bias: 1.40 · Rmse: None |
Summary high
The figure displays JJA Surface Downwelling Longwave Radiation biases relative to ERA5 for high-resolution EERIE models (IFS, ICON) and a selection of CMIP6 models. The two IFS-based simulations show high consistency with each other and generally low biases globally except for a strong positive anomaly over Antarctica, whereas ICON-ESM-ER exhibits a distinct pattern of negative tropical ocean biases and positive Northern Hemisphere land biases.
Key Findings
- IFS-FESOM2-SR and IFS-NEMO-ER exhibit nearly identical bias patterns, characterized by a prominent positive bias (>30 W/m²) over the Antarctic continent during austral winter and slight negative biases over the Southern Ocean.
- ICON-ESM-ER diverges significantly from the IFS models, showing widespread negative biases (-20 to -30 W/m²) over tropical oceans (particularly the ITCZ region) and strong positive biases over Northern Hemisphere land masses (North America, Eurasia).
- Many CMIP6 models (e.g., ACCESS-ESM1-5, MPI-ESM1-2-LR) show strong positive biases over the Southern Ocean, a feature not shared by the IFS models (which are negative there) but partially seen in ICON.
- The CMIP6 Multi-Model Mean (MMM) shows a relatively smooth bias field with weak positive biases in high latitudes and weak negative biases in the tropics, generally outperforming outliers like GISS-E2-1-G (strong positive) and FGOALS-g3 (strong negative).
Spatial Patterns
The most striking spatial feature for the IFS models is the localized positive bias over Antarctica in JJA (winter), suggesting issues with polar stable boundary layers or excessive cloud radiative forcing. For ICON-ESM-ER, a land-sea contrast is evident in the Northern Hemisphere summer, with positive biases over land and negative biases over the ocean. The Southern Ocean exhibits significant inter-model spread, with IFS models showing negative biases while many CMIP6 models show strong positive biases.
Model Agreement
There is very high agreement between IFS-FESOM2-SR and IFS-NEMO-ER, confirming that the atmospheric component dominates downwelling longwave fluxes. Agreement between IFS and ICON is low, with opposite signs in key regions (e.g., tropical oceans). The IFS models appear to have lower global spatially-averaged biases compared to ICON and several CMIP6 members.
Physical Interpretation
Surface downwelling longwave radiation is primarily a function of near-surface atmospheric temperature, humidity, and cloud cover. The positive Antarctic bias in IFS suggests the atmosphere is too warm or too cloudy in the polar winter, preventing radiative cooling. ICON's negative tropical ocean bias implies a deficit in atmospheric humidity or cloud cover (likely low clouds) in the ITCZ region. Conversely, ICON's positive bias over NH land suggests excessive heating or humidity/cloudiness in the summer hemisphere.
Caveats
- ERA5 is a reanalysis product and relies on its own radiative transfer model, which carries uncertainty, particularly in polar regions.
- Biases in downwelling longwave are often tightly coupled to surface temperature biases; without looking at T2m or SST biases, it is difficult to separate cause (atmospheric radiation) from effect (surface response).
Surface Downwelling Shortwave Annual Mean Bias
| Variables | rsds |
|---|---|
| Models | IFS-FESOM2-SR, IFS-NEMO-ER, ICON-ESM-ER, CMIP6 MMM, MPI-ESM1-2-LR/r1i1p1f1, GISS-E2-1-G/r1i1p1f2, IPSL-CM6A-LR/r1i1p1f1, ACCESS-ESM1-5/r1i1p1f1, EC-Earth3/r1i1p1f1, CNRM-CM6-1/r1i1p1f2, AWI-CM-1-1-MR/r1i1p1f1, CNRM-ESM2-1/r1i1p1f2, FGOALS-g3/r1i1p1f1, INM-CM5-0/r1i1p1f1, MRI-ESM2-0/r1i1p1f1 |
| Reference Dataset | ERA5 |
| Units | W/m2 |
| Period | 1980–2014 |
| IFS-FESOM2-SR | Global Mean Bias: -1.27 · Rmse: 9.31 |
| IFS-NEMO-ER | Global Mean Bias: -1.00 · Rmse: 8.28 |
| ICON-ESM-ER | Global Mean Bias: 1.03 · Rmse: 14.27 |
| CMIP6 MMM | Global Mean Bias: 3.72 · Rmse: 9.01 |
| MPI-ESM1-2-LR/r1i1p1f1 | Global Mean Bias: -1.43 · Rmse: 14.22 |
| GISS-E2-1-G/r1i1p1f2 | Global Mean Bias: -3.52 · Rmse: 14.65 |
| IPSL-CM6A-LR/r1i1p1f1 | Global Mean Bias: 0.96 · Rmse: 13.86 |
| ACCESS-ESM1-5/r1i1p1f1 | Global Mean Bias: 6.55 · Rmse: 15.60 |
| EC-Earth3/r1i1p1f1 | Global Mean Bias: 3.78 · Rmse: 11.24 |
| CNRM-CM6-1/r1i1p1f2 | Global Mean Bias: 6.26 · Rmse: 13.14 |
| AWI-CM-1-1-MR/r1i1p1f1 | Global Mean Bias: 2.45 · Rmse: 14.07 |
| CNRM-ESM2-1/r1i1p1f2 | Global Mean Bias: 6.87 · Rmse: 13.66 |
| FGOALS-g3/r1i1p1f1 | Global Mean Bias: 4.11 · Rmse: 14.35 |
| INM-CM5-0/r1i1p1f1 | Global Mean Bias: 11.11 · Rmse: 16.92 |
| MRI-ESM2-0/r1i1p1f1 | Global Mean Bias: 3.73 · Rmse: 12.29 |
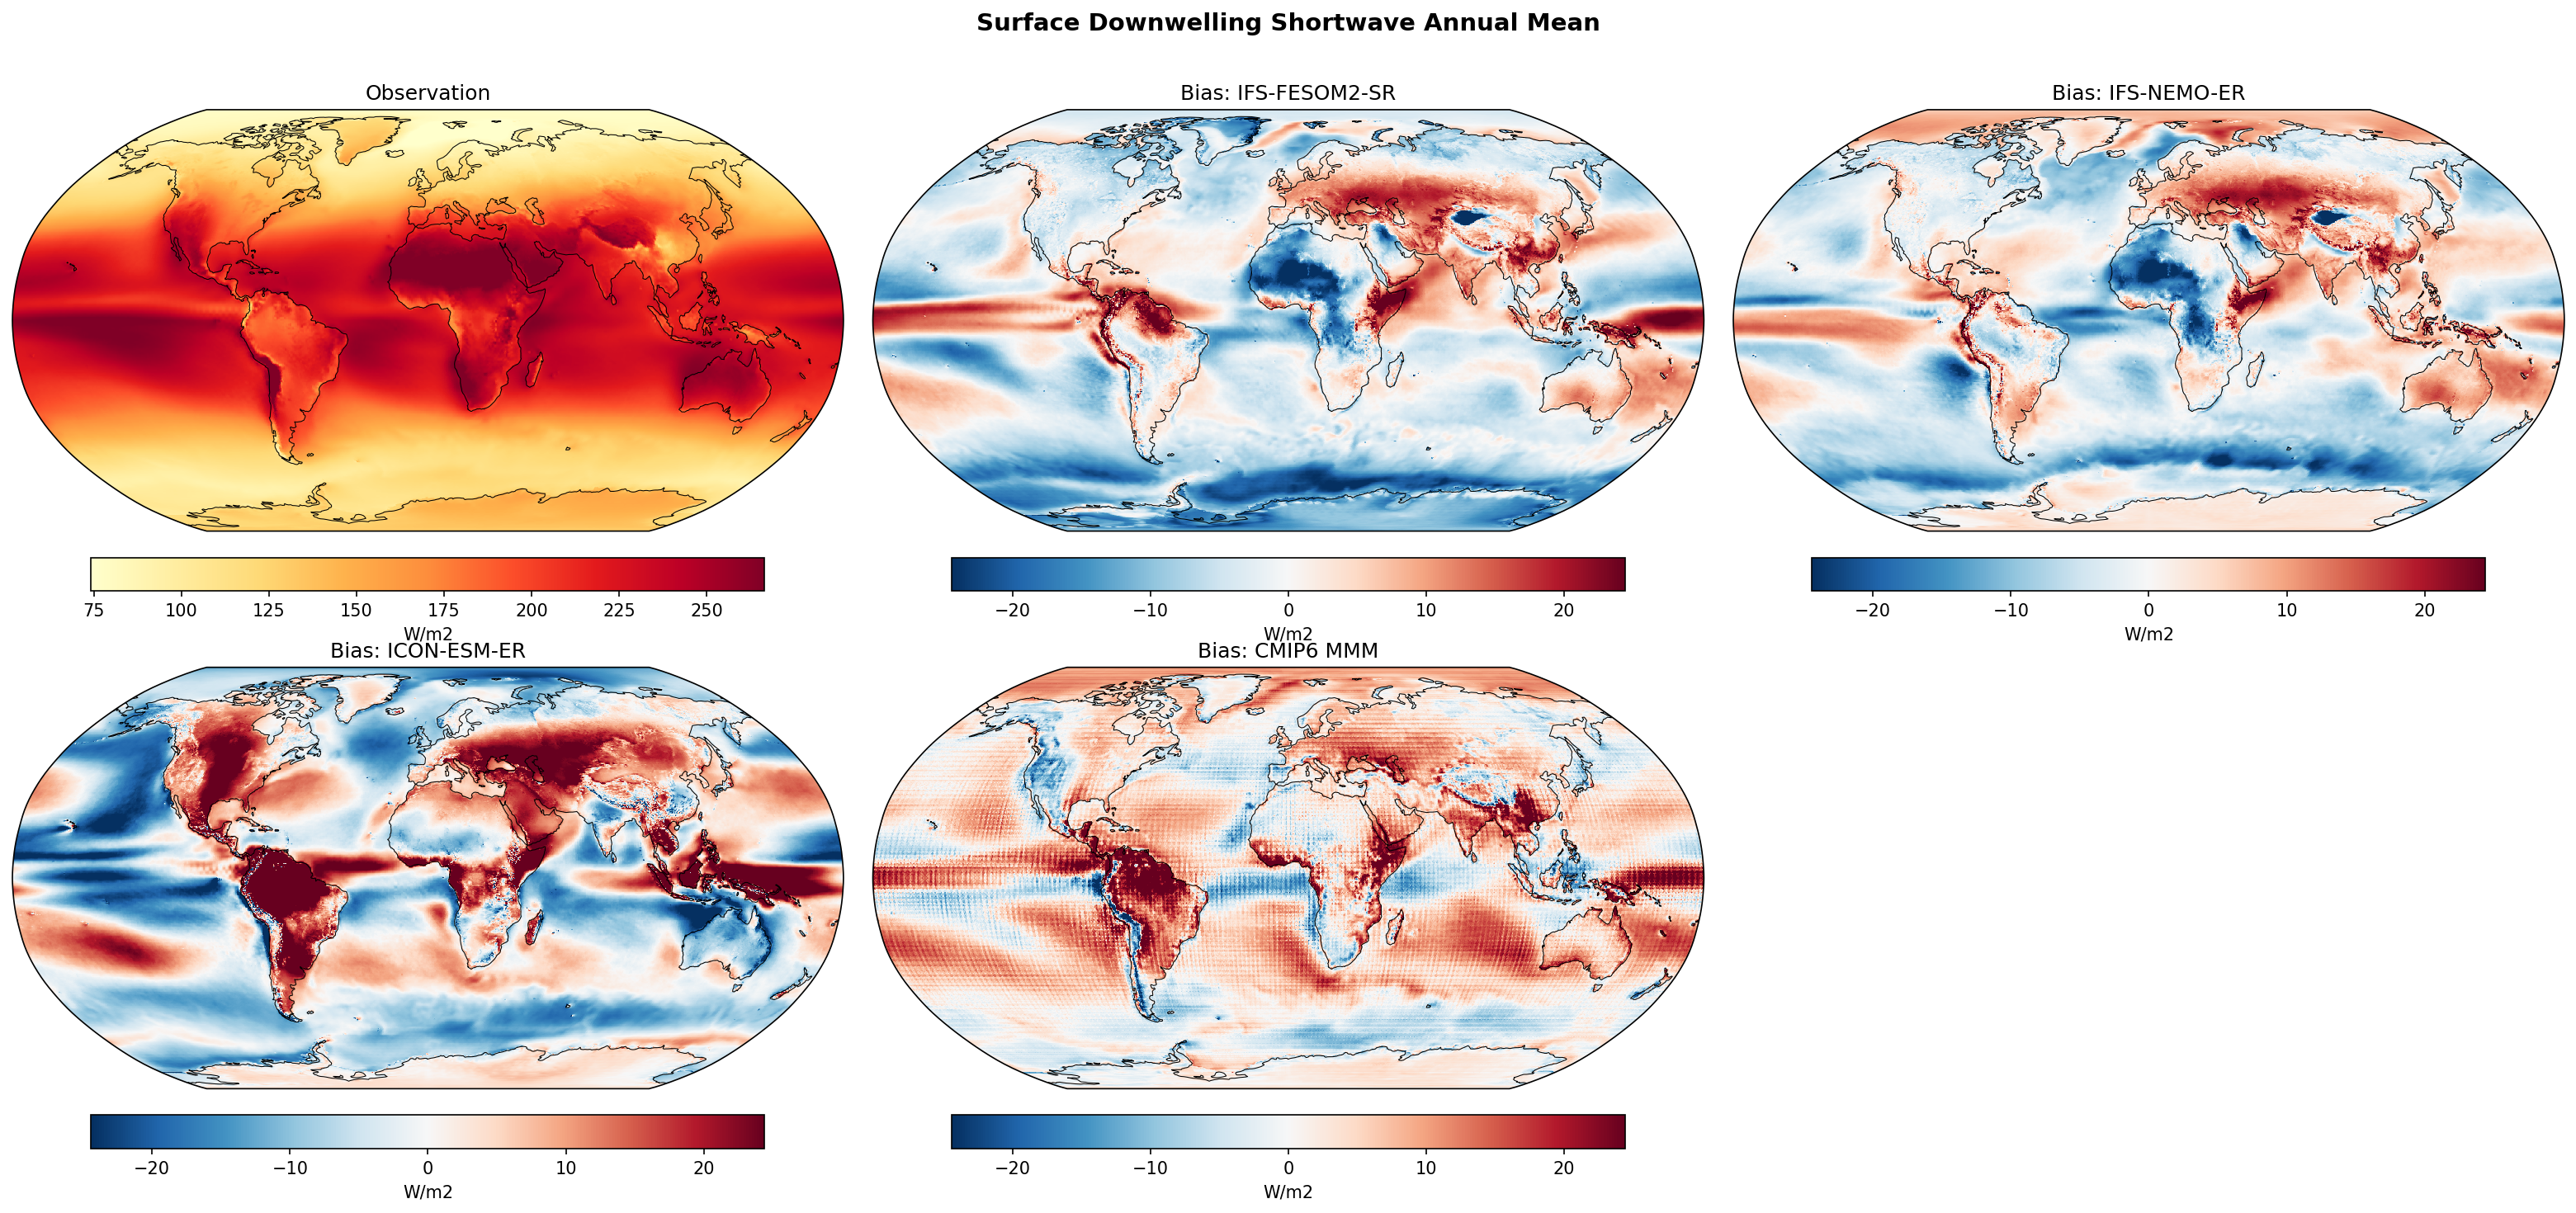
Summary high
The high-resolution IFS models (NEMO and FESOM2) demonstrate superior skill in reproducing surface downwelling shortwave radiation compared to ICON-ESM-ER and the CMIP6 ensemble, effectively mitigating longstanding cloud biases. While IFS models achieve RMSE values below 10 W/m², ICON-ESM-ER retains systematic errors typical of lower-resolution CMIP6 models, such as excessive solar absorption over the Southern Ocean.
Key Findings
- IFS-NEMO-ER achieves the best performance with the lowest RMSE (8.28 W/m²) and minimal global bias (-1.00 W/m²), significantly outperforming the CMIP6 Multi-Model Mean (RMSE 9.01 W/m²).
- ICON-ESM-ER exhibits high RMSE (14.27 W/m²) and strong positive biases over the Southern Ocean and eastern subtropical stratocumulus decks, mirroring systematic errors seen in many CMIP6 models (e.g., ACCESS-ESM1-5, CNRM-CM6-1).
- A distinct land-sea contrast is visible in ICON and several CMIP6 models: excessive insolation over oceans (positive bias) versus insufficient insolation over tropical rainforests (negative bias in Amazon/Congo).
Spatial Patterns
The most prominent spatial features are the bands of positive bias (red, >20 W/m²) in the Southern Ocean (40°S–60°S) and eastern boundary upwelling regions (Peru, Namibia, California) present in ICON-ESM-ER and the CMIP6 MMM. These indicate regions where too much sunlight reaches the surface. Conversely, ICON shows strong negative biases (blue) over tropical land masses (Amazon, Congo, Maritime Continent). The IFS models are remarkably neutral in these key regions, showing only faint biases, though IFS-FESOM2-SR shows slightly more structure than IFS-NEMO-ER.
Model Agreement
There is strong agreement between the two IFS variants (FESOM2 and NEMO), suggesting that the atmospheric model physics (IFS) is the dominant factor in radiation performance, independent of the ocean coupler. Conversely, ICON-ESM-ER diverges from the IFS results and aligns closely with the spatial bias patterns of the CMIP6 ensemble (specifically ACCESS and CNRM), suggesting that high resolution alone does not resolve structural cloud parameterization deficiencies.
Physical Interpretation
The positive biases over the Southern Ocean and eastern subtropical oceans in ICON and CMIP6 models are driven by deficiencies in simulating low-level clouds (stratocumulus and mixed-phase clouds). Specifically, the 'too much sun' bias implies an underestimation of cloud fraction, cloud optical depth, or liquid water path (lack of supercooled liquid) in these regimes. The negative bias over tropical land in ICON suggests excessively optically thick convective clouds or 'double ITCZ' issues. The IFS models' superior performance likely results from advanced cloud microphysics and boundary layer parameterizations derived from operational weather forecasting tuning.
Caveats
- The observational reference is ERA5 (reanalysis), which, while robust, is model-derived; comparisons against direct satellite products like CERES-EBAF might show slight differences in magnitude.
- Annual means may mask compensating seasonal errors, particularly in semi-permanent cloud decks or sea-ice zones.
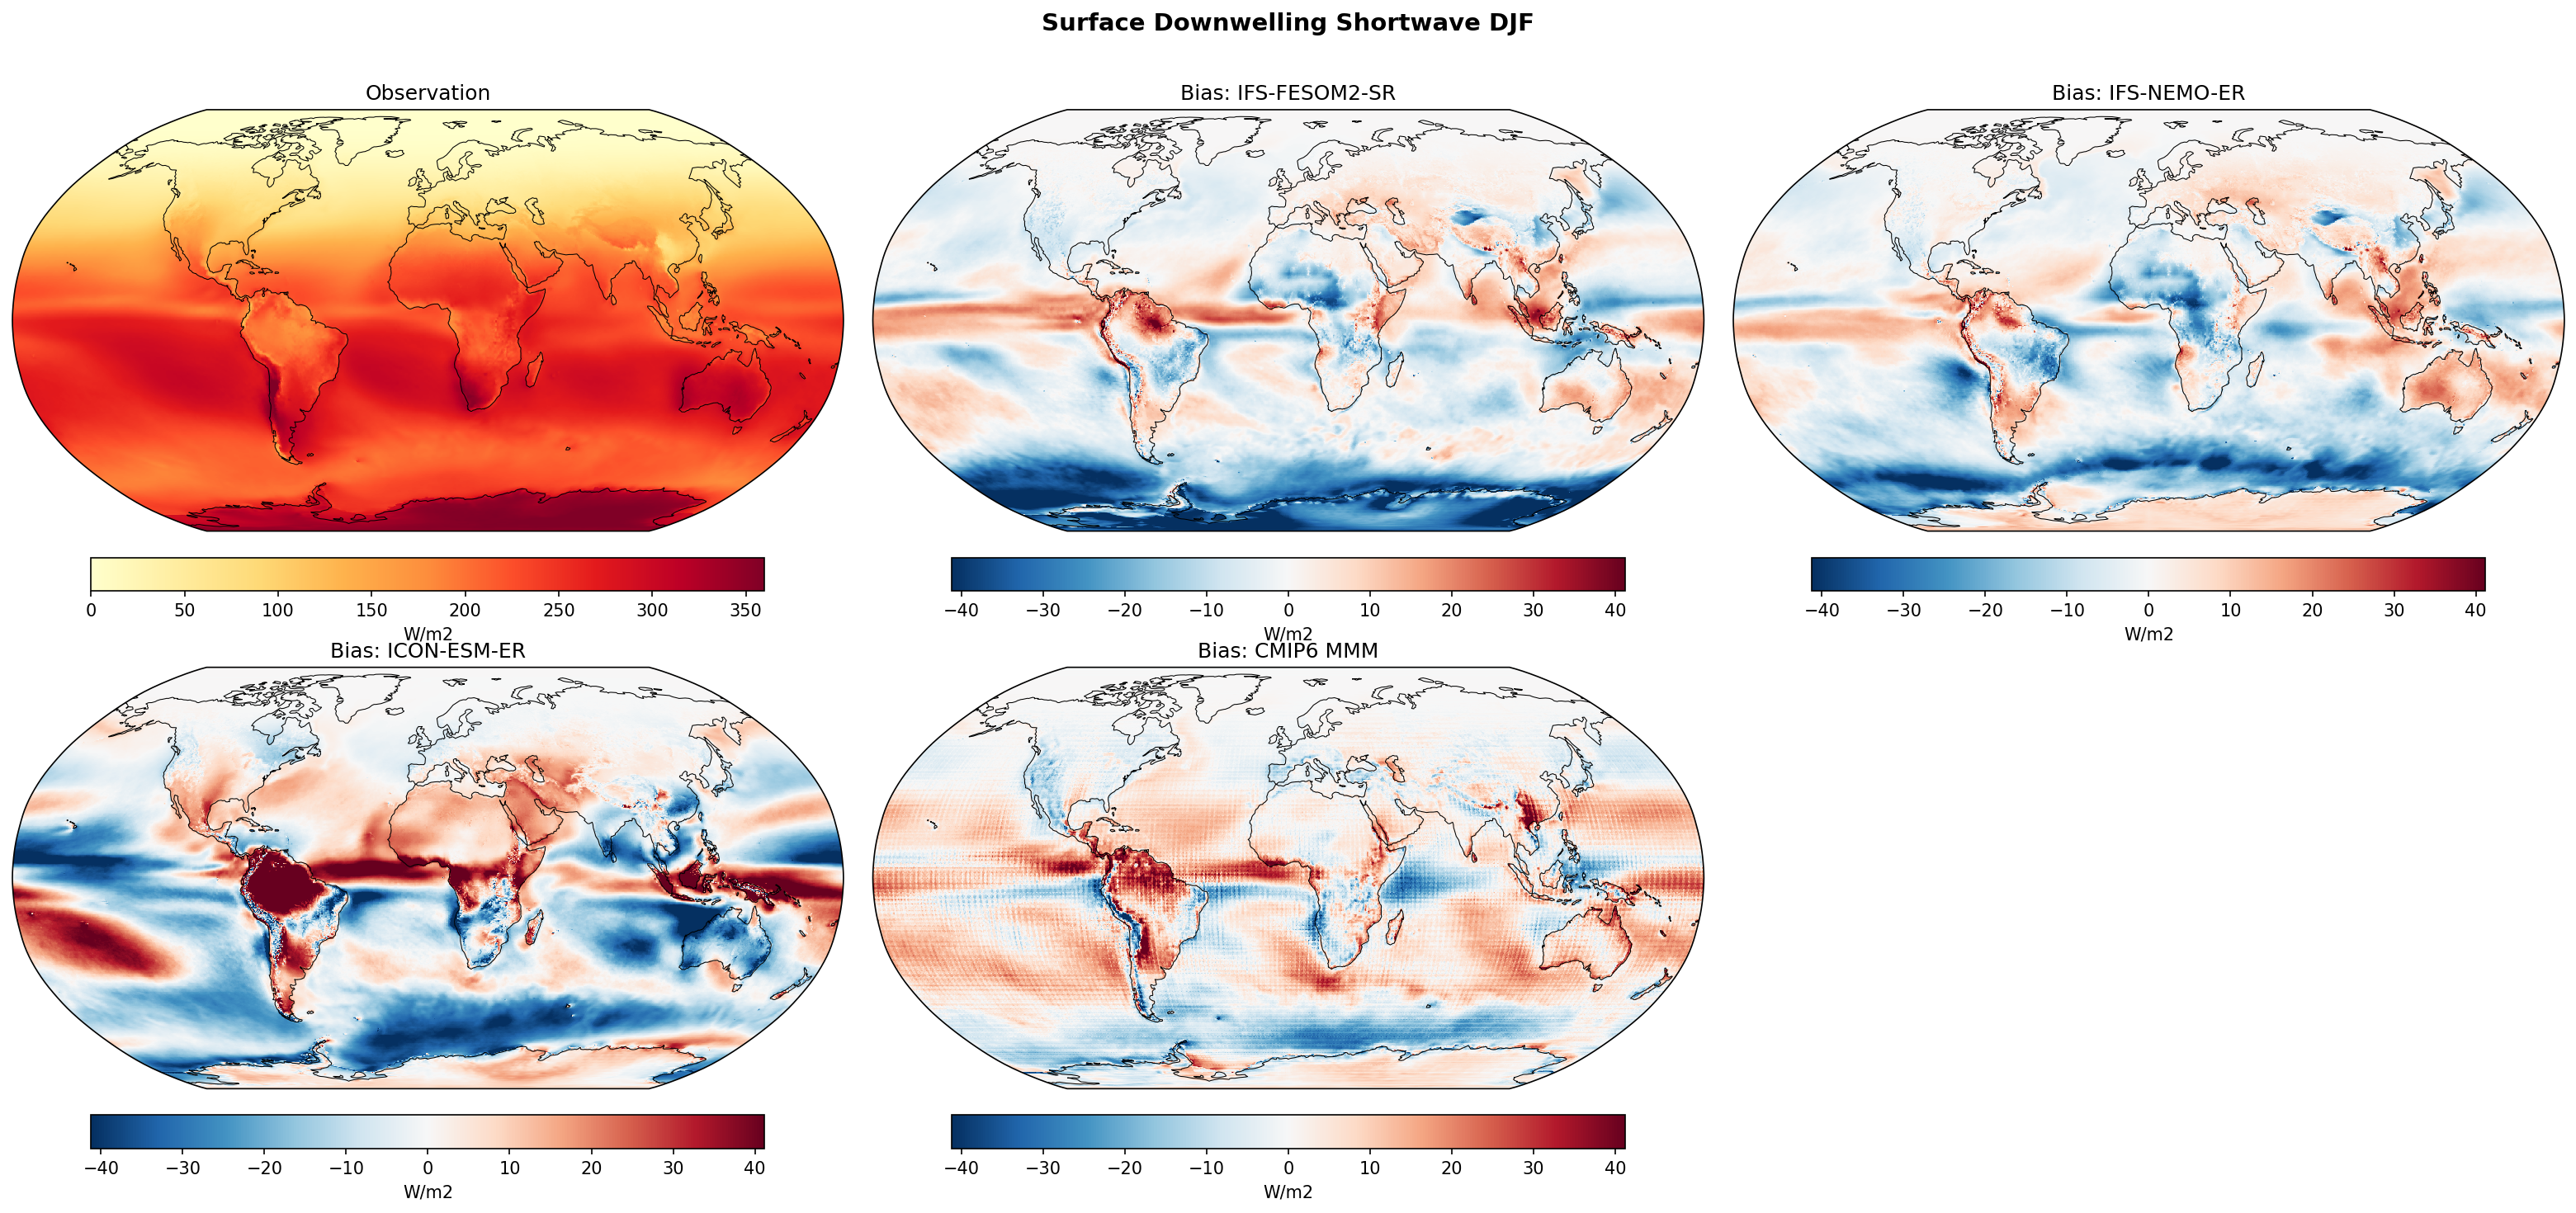
Surface Downwelling Shortwave DJF Bias
| Variables | rsds |
|---|---|
| Models | IFS-FESOM2-SR, IFS-NEMO-ER, ICON-ESM-ER, CMIP6 MMM, MPI-ESM1-2-LR/r1i1p1f1, GISS-E2-1-G/r1i1p1f2, IPSL-CM6A-LR/r1i1p1f1, ACCESS-ESM1-5/r1i1p1f1, EC-Earth3/r1i1p1f1, CNRM-CM6-1/r1i1p1f2, AWI-CM-1-1-MR/r1i1p1f1, CNRM-ESM2-1/r1i1p1f2, FGOALS-g3/r1i1p1f1, INM-CM5-0/r1i1p1f1, MRI-ESM2-0/r1i1p1f1 |
| Reference Dataset | ERA5 |
| Units | W/m2 |
| Period | 1980–2014 |
| CMIP6 MMM | Global Mean Bias: 2.26 · Rmse: None |
| MPI-ESM1-2-LR/r1i1p1f1 | Global Mean Bias: -2.58 · Rmse: None |
| GISS-E2-1-G/r1i1p1f2 | Global Mean Bias: -4.29 · Rmse: None |
| IPSL-CM6A-LR/r1i1p1f1 | Global Mean Bias: -0.30 · Rmse: None |
| ACCESS-ESM1-5/r1i1p1f1 | Global Mean Bias: 6.28 · Rmse: None |
| EC-Earth3/r1i1p1f1 | Global Mean Bias: 1.81 · Rmse: None |
| CNRM-CM6-1/r1i1p1f2 | Global Mean Bias: 5.70 · Rmse: None |
| AWI-CM-1-1-MR/r1i1p1f1 | Global Mean Bias: 1.05 · Rmse: None |
| CNRM-ESM2-1/r1i1p1f2 | Global Mean Bias: 6.07 · Rmse: None |
| FGOALS-g3/r1i1p1f1 | Global Mean Bias: 0.15 · Rmse: None |
| INM-CM5-0/r1i1p1f1 | Global Mean Bias: 10.30 · Rmse: None |
| MRI-ESM2-0/r1i1p1f1 | Global Mean Bias: 0.67 · Rmse: None |
Summary high
This figure displays the climatological bias in Surface Downwelling Shortwave Radiation (rsds) for DJF relative to ERA5, comparing high-resolution EERIE models (IFS and ICON) against the CMIP6 ensemble. The analysis highlights significant regional biases in cloud radiative effects, particularly over tropical land masses and the Southern Ocean.
Key Findings
- Persistent positive biases (>30 W/m²) appear over tropical convective land regions (Amazon, Congo Basin) in all EERIE models and the CMIP6 MMM, indicating a systematic underestimation of cloud cover or optical thickness in the ITCZ.
- The Southern Ocean exhibits a zonal band of negative bias (~-20 to -30 W/m²) in the EERIE models (IFS and ICON) and several CMIP6 members, suggesting these models simulate more extensive or optically thicker cloud decks than ERA5 in this region.
- ICON-ESM-ER shows strong positive biases in eastern boundary upwelling regions (e.g., off Peru and Namibia), characteristic of the 'too few stratocumulus clouds' bias common in CMIP6; notably, the IFS-based models avoid this specific error, showing neutral to slightly negative biases in these zones.
Spatial Patterns
Biases show strong land-sea contrasts in the tropics. Over land (South America, Southern Africa), biases are strongly positive (red). Over oceans, patterns vary: the Southern Ocean is consistently negative (blue) across high-res models, while the tropical oceans show model-dependent behavior (ICON is red in Sc decks; IFS is neutral/blue). The North Atlantic generally shows weak negative biases.
Model Agreement
The two IFS variants (IFS-FESOM2-SR and IFS-NEMO-ER) show nearly identical bias patterns, confirming that the atmospheric model physics dominates the surface radiation budget. ICON-ESM-ER shares the land convection bias with IFS but diverges in the marine stratocumulus regions, resembling the systematic errors of the CMIP6 MMM more closely. Individual CMIP6 models show a very wide spread in global mean bias (ranging from -4.3 to +10.3 W/m²).
Physical Interpretation
The positive bias over tropical land suggests deficiencies in deep convection parameterizations, likely generating insufficient anvil cloud area or optical depth during the wet season (DJF). The negative bias in the Southern Ocean implies these newer models generate reflective cloud decks that exceed ERA5's opacity, potentially an overcorrection of the historical 'too absorbed SW' bias in this region. ICON's positive stratocumulus bias points to difficulties in maintaining planetary boundary layer clouds.
Caveats
- Biases are calculated against ERA5 reanalysis, which itself is a model-data product and may have uncertainties in cloud radiative transfer compared to direct satellite observations (CERES).
- The analysis is for DJF only; seasonal shifts in the ITCZ and sea ice extent during other seasons are not assessed here.
Surface Downwelling Shortwave JJA Bias
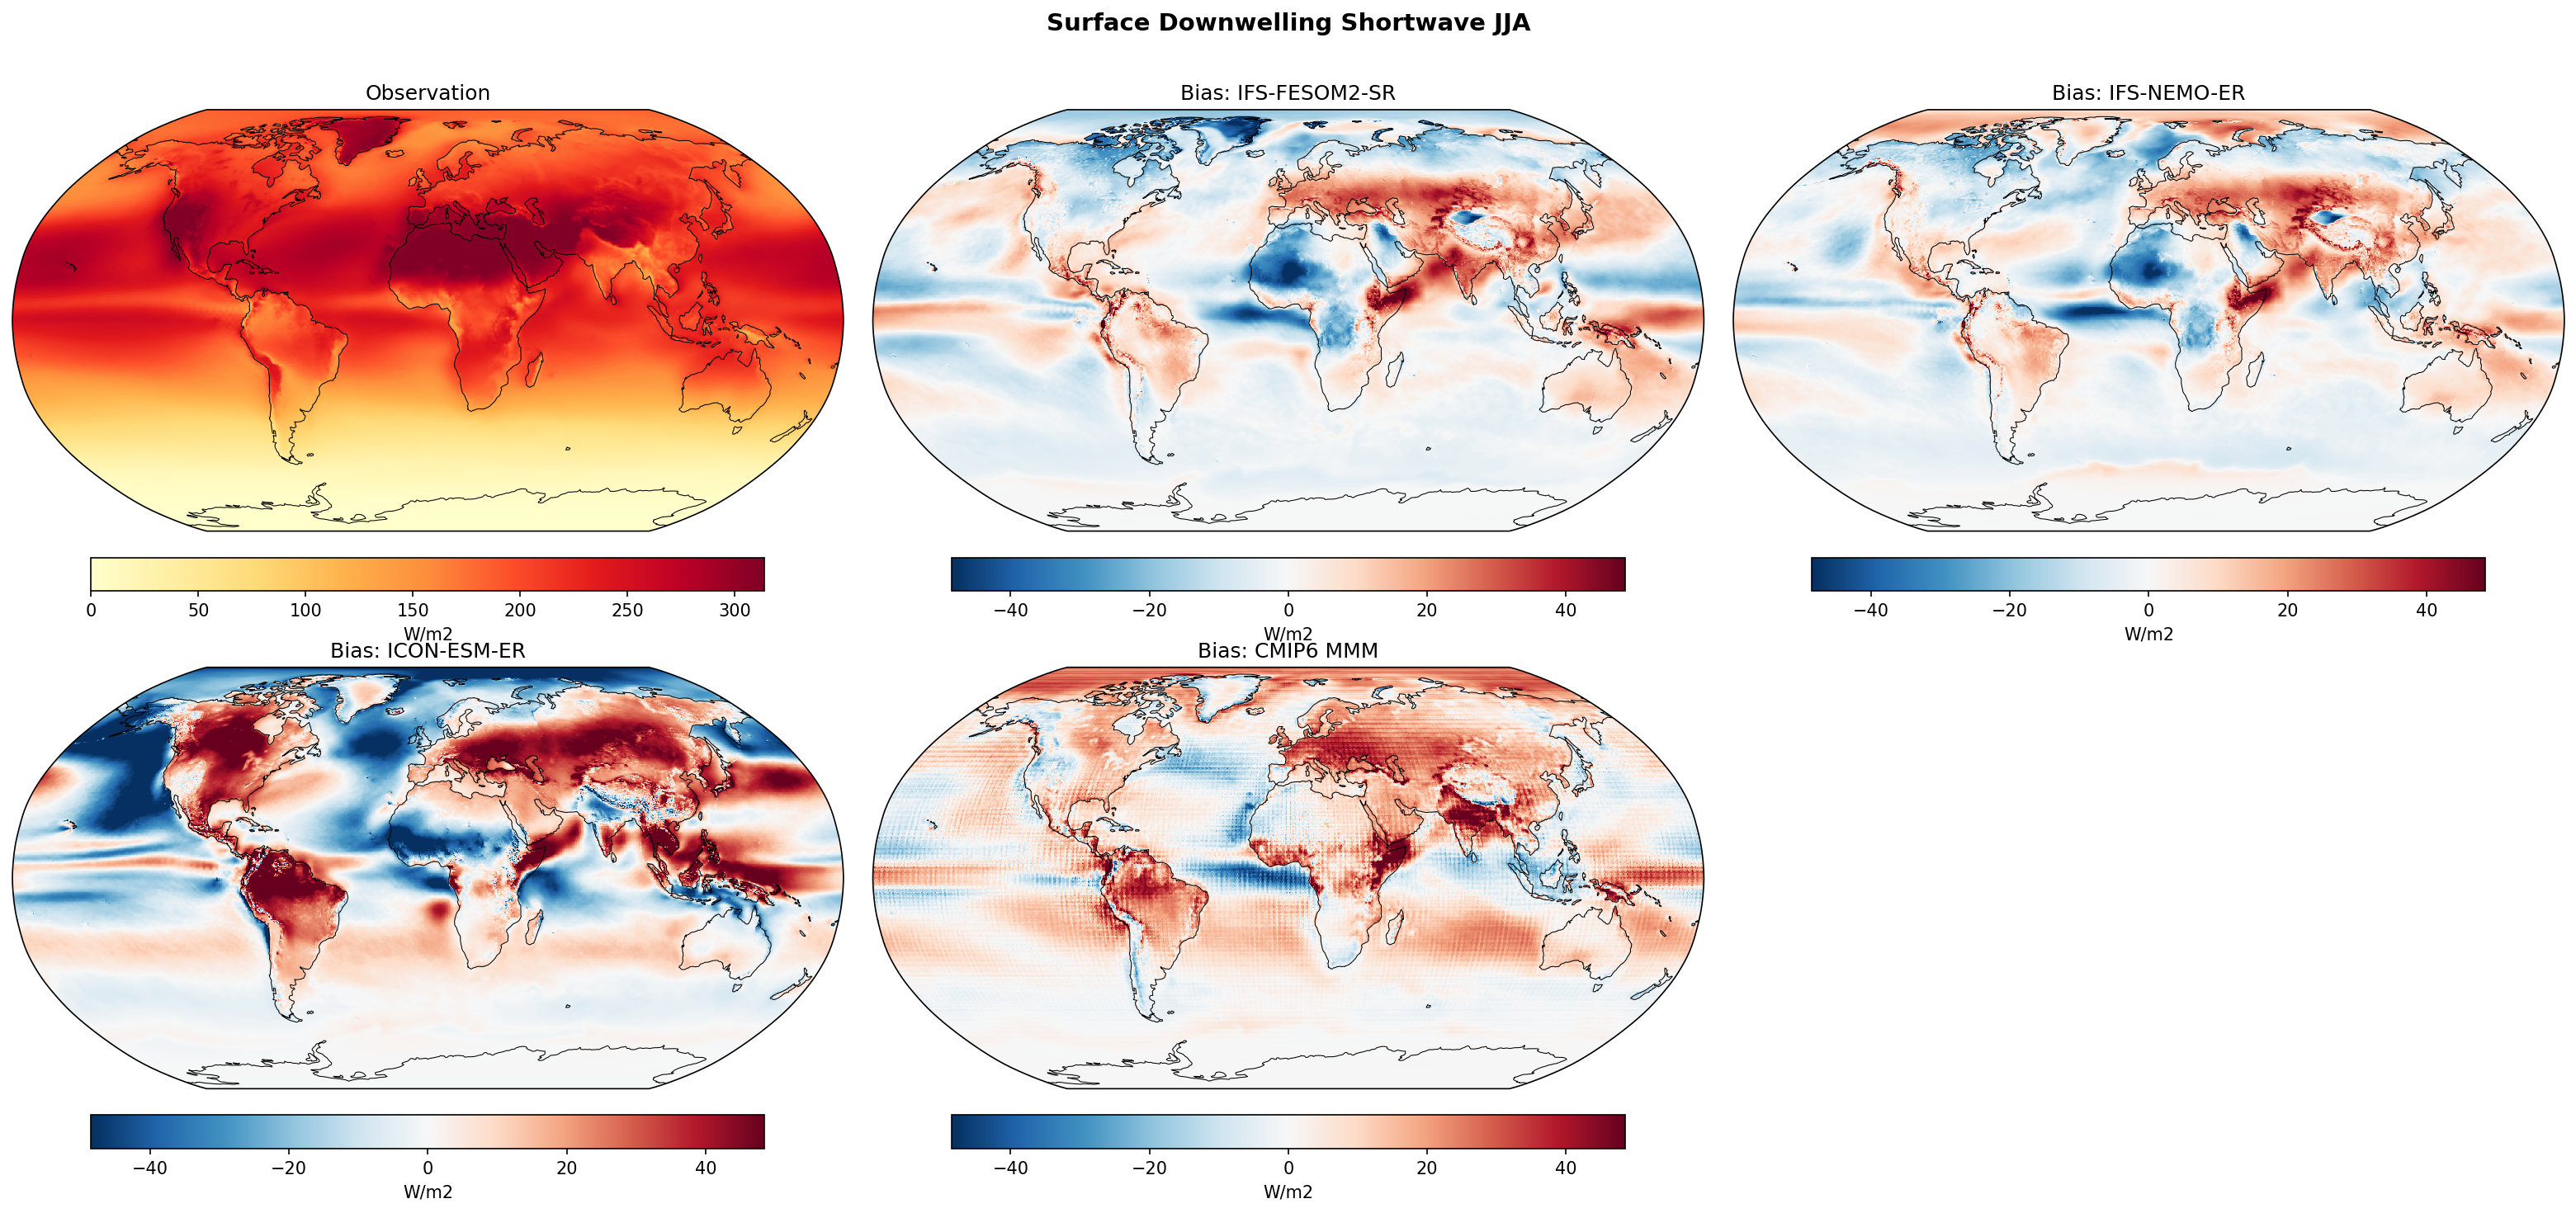
| Variables | rsds |
|---|---|
| Models | IFS-FESOM2-SR, IFS-NEMO-ER, ICON-ESM-ER, CMIP6 MMM, MPI-ESM1-2-LR/r1i1p1f1, GISS-E2-1-G/r1i1p1f2, IPSL-CM6A-LR/r1i1p1f1, ACCESS-ESM1-5/r1i1p1f1, EC-Earth3/r1i1p1f1, CNRM-CM6-1/r1i1p1f2, AWI-CM-1-1-MR/r1i1p1f1, CNRM-ESM2-1/r1i1p1f2, FGOALS-g3/r1i1p1f1, INM-CM5-0/r1i1p1f1, MRI-ESM2-0/r1i1p1f1 |
| Reference Dataset | ERA5 |
| Units | W/m2 |
| Period | 1980–2014 |
| CMIP6 MMM | Global Mean Bias: 5.48 · Rmse: None |
| MPI-ESM1-2-LR/r1i1p1f1 | Global Mean Bias: -1.46 · Rmse: None |
| GISS-E2-1-G/r1i1p1f2 | Global Mean Bias: -0.89 · Rmse: None |
| IPSL-CM6A-LR/r1i1p1f1 | Global Mean Bias: 5.65 · Rmse: None |
| ACCESS-ESM1-5/r1i1p1f1 | Global Mean Bias: 8.09 · Rmse: None |
| EC-Earth3/r1i1p1f1 | Global Mean Bias: 4.79 · Rmse: None |
| CNRM-CM6-1/r1i1p1f2 | Global Mean Bias: 7.64 · Rmse: None |
| AWI-CM-1-1-MR/r1i1p1f1 | Global Mean Bias: 3.05 · Rmse: None |
| CNRM-ESM2-1/r1i1p1f2 | Global Mean Bias: 8.73 · Rmse: None |
| FGOALS-g3/r1i1p1f1 | Global Mean Bias: 6.07 · Rmse: None |
| INM-CM5-0/r1i1p1f1 | Global Mean Bias: 12.44 · Rmse: None |
| MRI-ESM2-0/r1i1p1f1 | Global Mean Bias: 6.28 · Rmse: None |
Summary high
This figure evaluates JJA Surface Downwelling Shortwave (SW) radiation biases against ERA5. The high-resolution IFS models (FESOM and NEMO coupled) exhibit widespread negative biases (too little solar radiation) over tropical oceans, contrasting with the positive biases typical of CMIP6 models in upwelling regions, while ICON-ESM-ER shows strong positive biases over Northern Hemisphere land.
Key Findings
- IFS-FESOM2-SR and IFS-NEMO-ER share nearly identical bias patterns, dominated by negative SW biases (-20 to -40 W/m²) over the tropical Pacific, Indian Ocean, and Eastern Boundary Upwelling Systems (EBUS), suggesting optically thicker clouds or higher cloud fraction than ERA5.
- ICON-ESM-ER diverges significantly from the IFS models, showing strong positive biases (>+30 W/m²) over Northern Hemisphere land (North America, Eurasia) and the Southern Ocean, indicating insufficient cloud cover or optical depth in these regions.
- The CMIP6 Multi-Model Mean displays the canonical positive SW bias in EBUS regions (off Peru/Chile, Namibia, California) and the Southern Ocean; notably, the high-resolution IFS models reverse this EBUS bias to negative, implying an over-correction or excessive low cloudiness in these specific setups.
Spatial Patterns
In the tropics (ITCZ/SPCZ), IFS models and several CMIP6 models (e.g., MPI-ESM) show negative biases. Over NH land during summer (JJA), ICON, IPSL, and INM show extensive positive biases, likely contributing to warm surface temperature biases. The Southern Ocean (40°S-60°S) generally exhibits positive biases across the CMIP6 MMM and ICON, a longstanding issue linked to cloud phase partitioning, though the IFS models show reduced or mixed biases here.
Model Agreement
There is very high agreement between the two IFS-based simulations (atmosphere dominance). Inter-model spread within CMIP6 is large, ranging from strongly positive global biases (INM-CM5-0, +12.4 W/m²) to slightly negative (GISS-E2-1-G, -0.9 W/m²). ICON aligns more with the 'brighter' CMIP6 models (like IPSL) over land but differs in ocean patterns.
Physical Interpretation
Positive biases (Red) typically result from underestimated cloud fraction or optical thickness (common in Stratocumulus decks and Summer convection). Negative biases (Blue), prominent in IFS tropical oceans, suggest excessive convective activity, anvil cirrus, or too-reflective low clouds. The strong positive bias in ICON over summer land suggests a potential deficiency in land-atmosphere coupling, where dry soils might suppress cloud formation, leading to excessive insolation.
Caveats
- The reference dataset is ERA5 reanalysis, which is a model-data blend and may contain its own SW radiation biases compared to direct satellite observations like CERES-EBAF.
- JJA represents Northern Hemisphere summer; Southern Ocean biases occur during winter (low insolation), so relative errors may be large even if absolute flux differences appear moderate.
2m Temperature Annual Mean Bias
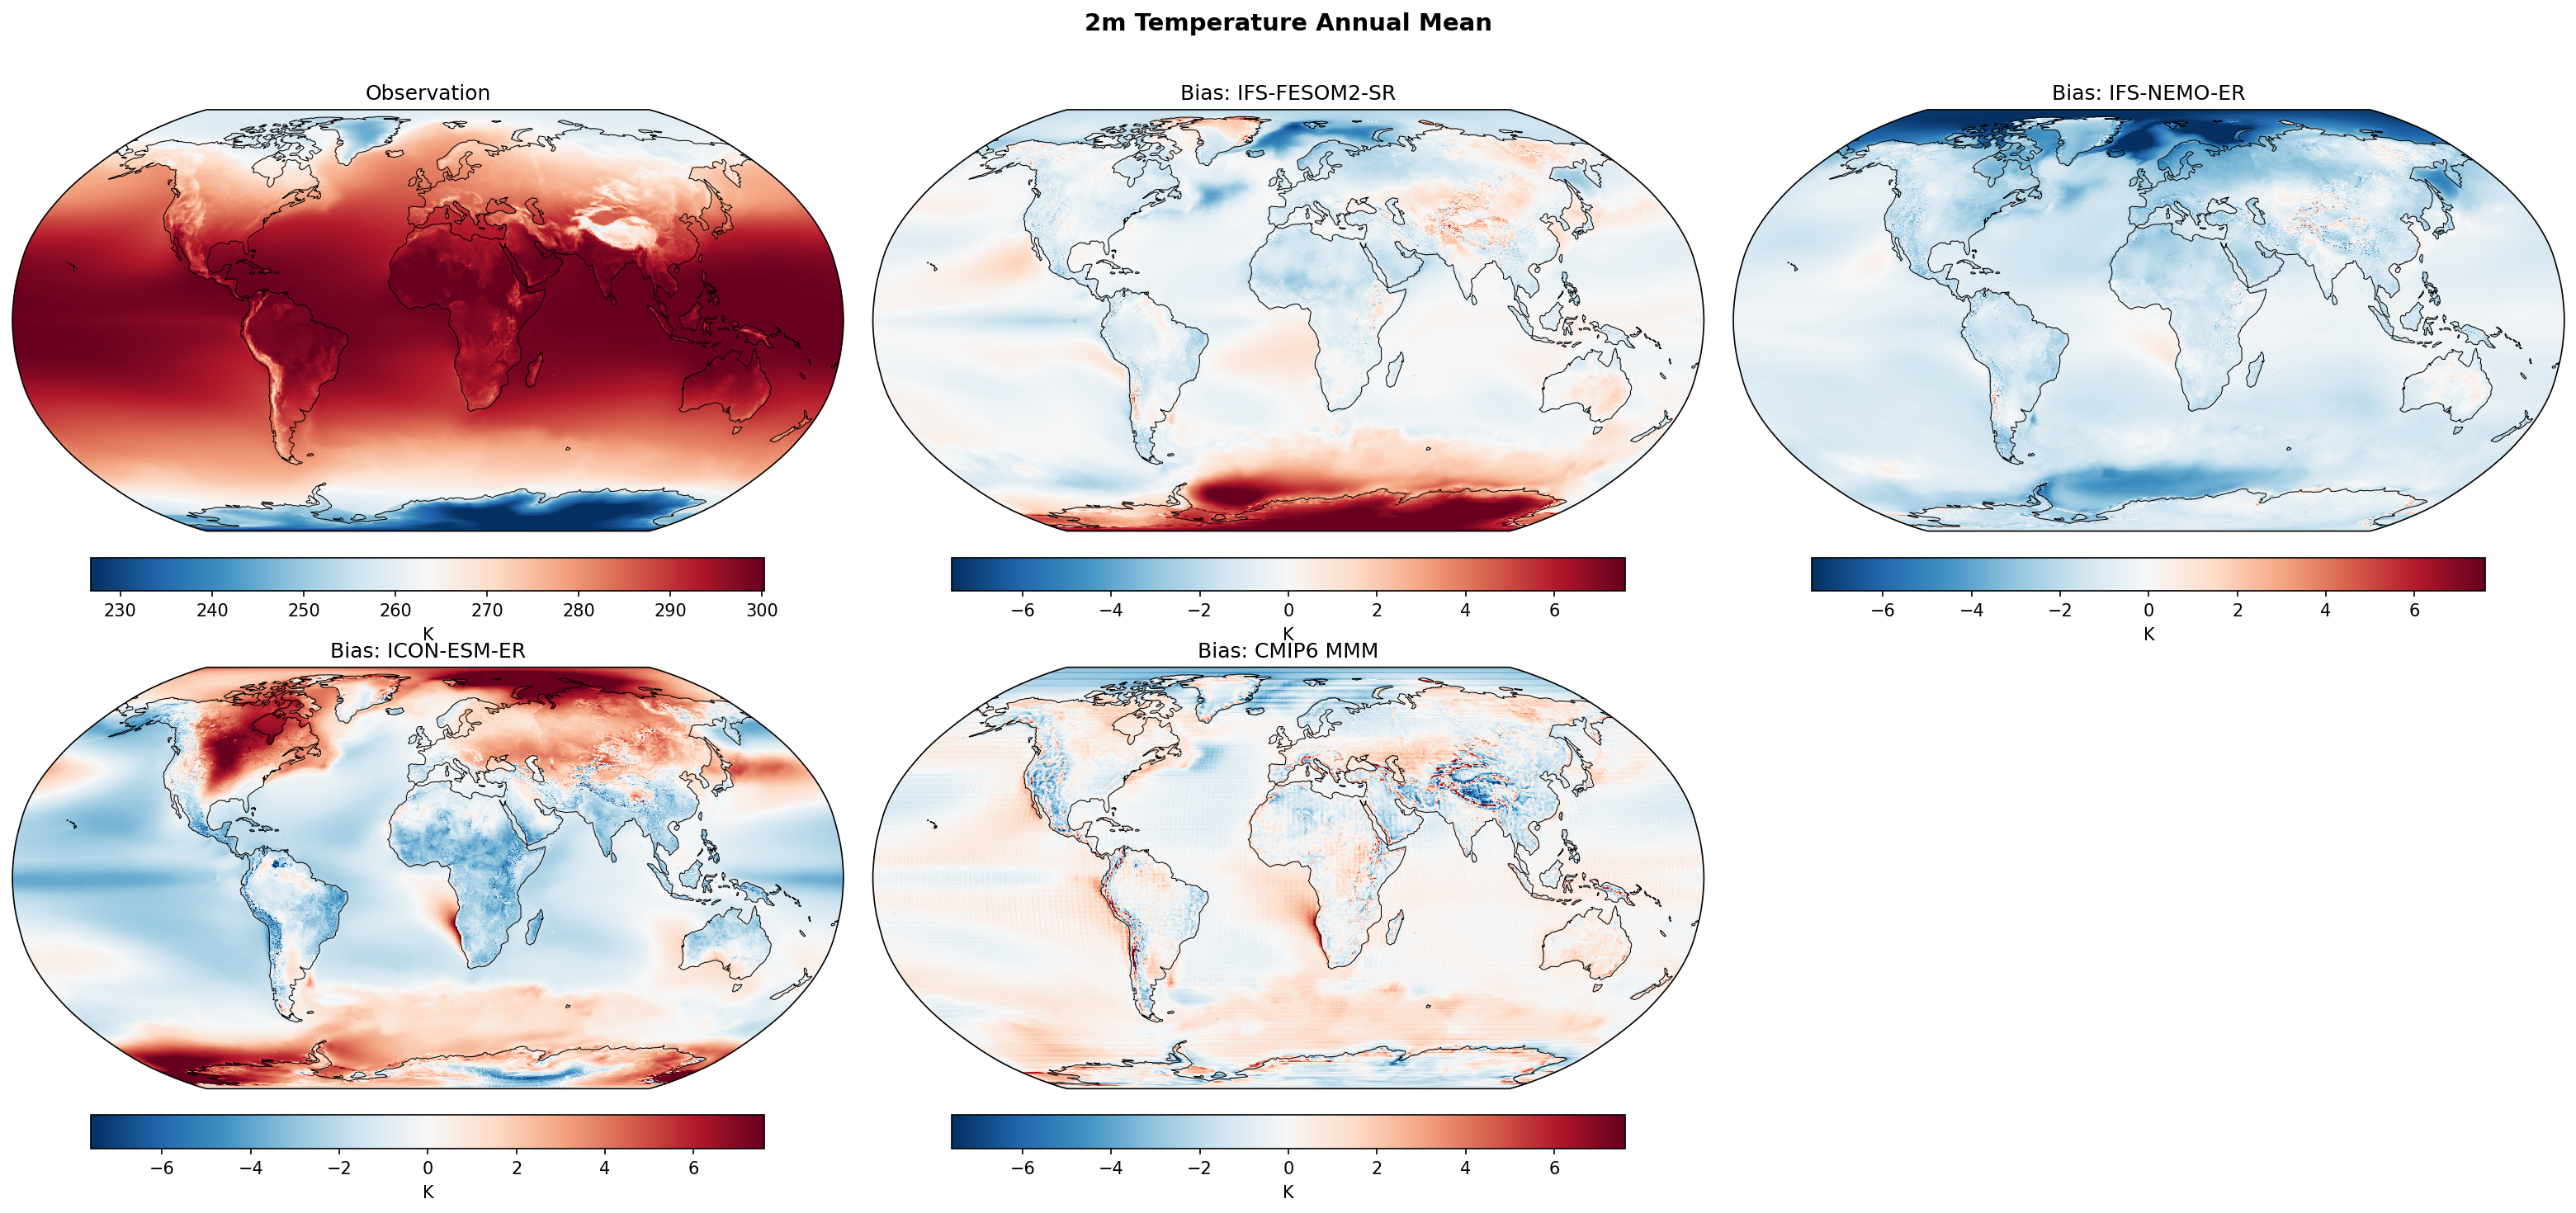
| Variables | tas |
|---|---|
| Models | IFS-FESOM2-SR, IFS-NEMO-ER, ICON-ESM-ER, CMIP6 MMM, MPI-ESM1-2-LR/r1i1p1f1, GISS-E2-1-G/r1i1p1f2, IPSL-CM6A-LR/r1i1p1f1, ACCESS-ESM1-5/r1i1p1f1, EC-Earth3/r1i1p1f1, CNRM-CM6-1/r1i1p1f2, AWI-CM-1-1-MR/r1i1p1f1, CNRM-ESM2-1/r1i1p1f2, FGOALS-g3/r1i1p1f1, INM-CM5-0/r1i1p1f1, MRI-ESM2-0/r1i1p1f1 |
| Reference Dataset | ERA5 |
| Units | K |
| Period | 1980–2014 |
| IFS-FESOM2-SR | Global Mean Bias: -0.03 · Rmse: 1.49 |
| IFS-NEMO-ER | Global Mean Bias: -1.34 · Rmse: 1.80 |
| ICON-ESM-ER | Global Mean Bias: -0.38 · Rmse: 2.30 |
| CMIP6 MMM | Global Mean Bias: 0.00 · Rmse: 1.13 |
| MPI-ESM1-2-LR/r1i1p1f1 | Global Mean Bias: 0.12 · Rmse: 1.67 |
| GISS-E2-1-G/r1i1p1f2 | Global Mean Bias: 0.01 · Rmse: 2.15 |
| IPSL-CM6A-LR/r1i1p1f1 | Global Mean Bias: -0.43 · Rmse: 1.60 |
| ACCESS-ESM1-5/r1i1p1f1 | Global Mean Bias: 0.89 · Rmse: 1.92 |
| EC-Earth3/r1i1p1f1 | Global Mean Bias: 0.36 · Rmse: 2.06 |
| CNRM-CM6-1/r1i1p1f2 | Global Mean Bias: -0.59 · Rmse: 1.60 |
| AWI-CM-1-1-MR/r1i1p1f1 | Global Mean Bias: 0.42 · Rmse: 1.37 |
| CNRM-ESM2-1/r1i1p1f2 | Global Mean Bias: 0.03 · Rmse: 1.52 |
| FGOALS-g3/r1i1p1f1 | Global Mean Bias: -0.55 · Rmse: 2.44 |
| INM-CM5-0/r1i1p1f1 | Global Mean Bias: -0.36 · Rmse: 1.88 |
| MRI-ESM2-0/r1i1p1f1 | Global Mean Bias: 0.13 · Rmse: 1.39 |
Summary high
This diagnostic evaluates annual mean 2m temperature biases relative to ERA5 for three high-resolution EERIE coupled models (IFS-FESOM2-SR, IFS-NEMO-ER, ICON-ESM-ER) alongside the CMIP6 Multi-Model Mean (MMM) and individual CMIP6 models. The figure highlights distinct performance differences: IFS-FESOM2-SR shows high skill comparable to mature CMIP6 models, whereas IFS-NEMO-ER and ICON-ESM-ER exhibit significant systematic or regional biases.
Key Findings
- IFS-FESOM2-SR demonstrates the best performance among the high-resolution models with a negligible global mean bias (-0.03 K) and low RMSE (1.49 K), rivaling well-tuned CMIP6 models like MRI-ESM2-0.
- IFS-NEMO-ER exhibits a pervasive, systematic cold bias across the globe (global mean -1.34 K), particularly severe over Northern Hemisphere continents.
- ICON-ESM-ER is characterized by large, compensating regional errors (highest RMSE of 2.30 K): intense warm biases over high-latitude North America and Siberia contrast with strong cold biases over arid regions (Sahara, Australia) and mountain ranges (Himalayas, Andes).
- CMIP6 MMM shows characteristic warm biases in eastern boundary upwelling regions (e.g., off Peru/Chile, Namibia), which are notably reduced in the high-resolution IFS-FESOM2-SR.
Spatial Patterns
The CMIP6 MMM displays classic 'double ITCZ' related warm biases and warm biases in the Southern Ocean, alongside a cold anomaly in the North Atlantic 'warming hole'. IFS-FESOM2-SR reproduces the North Atlantic cold spot and Southern Ocean warm bias but improves upon tropical marine biases. IFS-NEMO-ER is dominated by a global cold offset. ICON-ESM-ER shows a unique dipole pattern: strong warming over the Arctic/sub-Arctic land masses and cooling over the tropics and mid-latitude deserts.
Model Agreement
IFS-FESOM2-SR shows the strongest agreement with observations among the new simulations, closely matching the spatial fidelity of the CMIP6 ensemble mean. Inter-model spread is large, with IFS-NEMO and ICON acting as outliers in opposite directions (cold vs. regional warm/cold extremes) compared to the more clustered performance of standard CMIP6 models.
Physical Interpretation
The reduction of eastern boundary warm biases in IFS-FESOM2-SR likely results from higher ocean resolution (~10 km) better resolving coastal upwelling and eddy heat transport. The global cold bias in IFS-NEMO-ER, despite using the same atmospheric component as IFS-FESOM, suggests significantly cooler sea surface temperatures or different coupling flux treatments. ICON-ESM-ER's high-latitude warm biases may stem from snow albedo feedback or stable boundary layer deficiencies, while its cold biases over deserts suggest issues with surface emissivity or dust radiative effects.
Caveats
- High-resolution models (EERIE) are likely less tuned than the CMIP6 production runs, contributing to larger gross biases in ICON and IFS-NEMO.
- Annual mean aggregation masks seasonal biases, particularly critical for understanding the high-latitude errors in ICON-ESM-ER.
2m Temperature DJF Bias
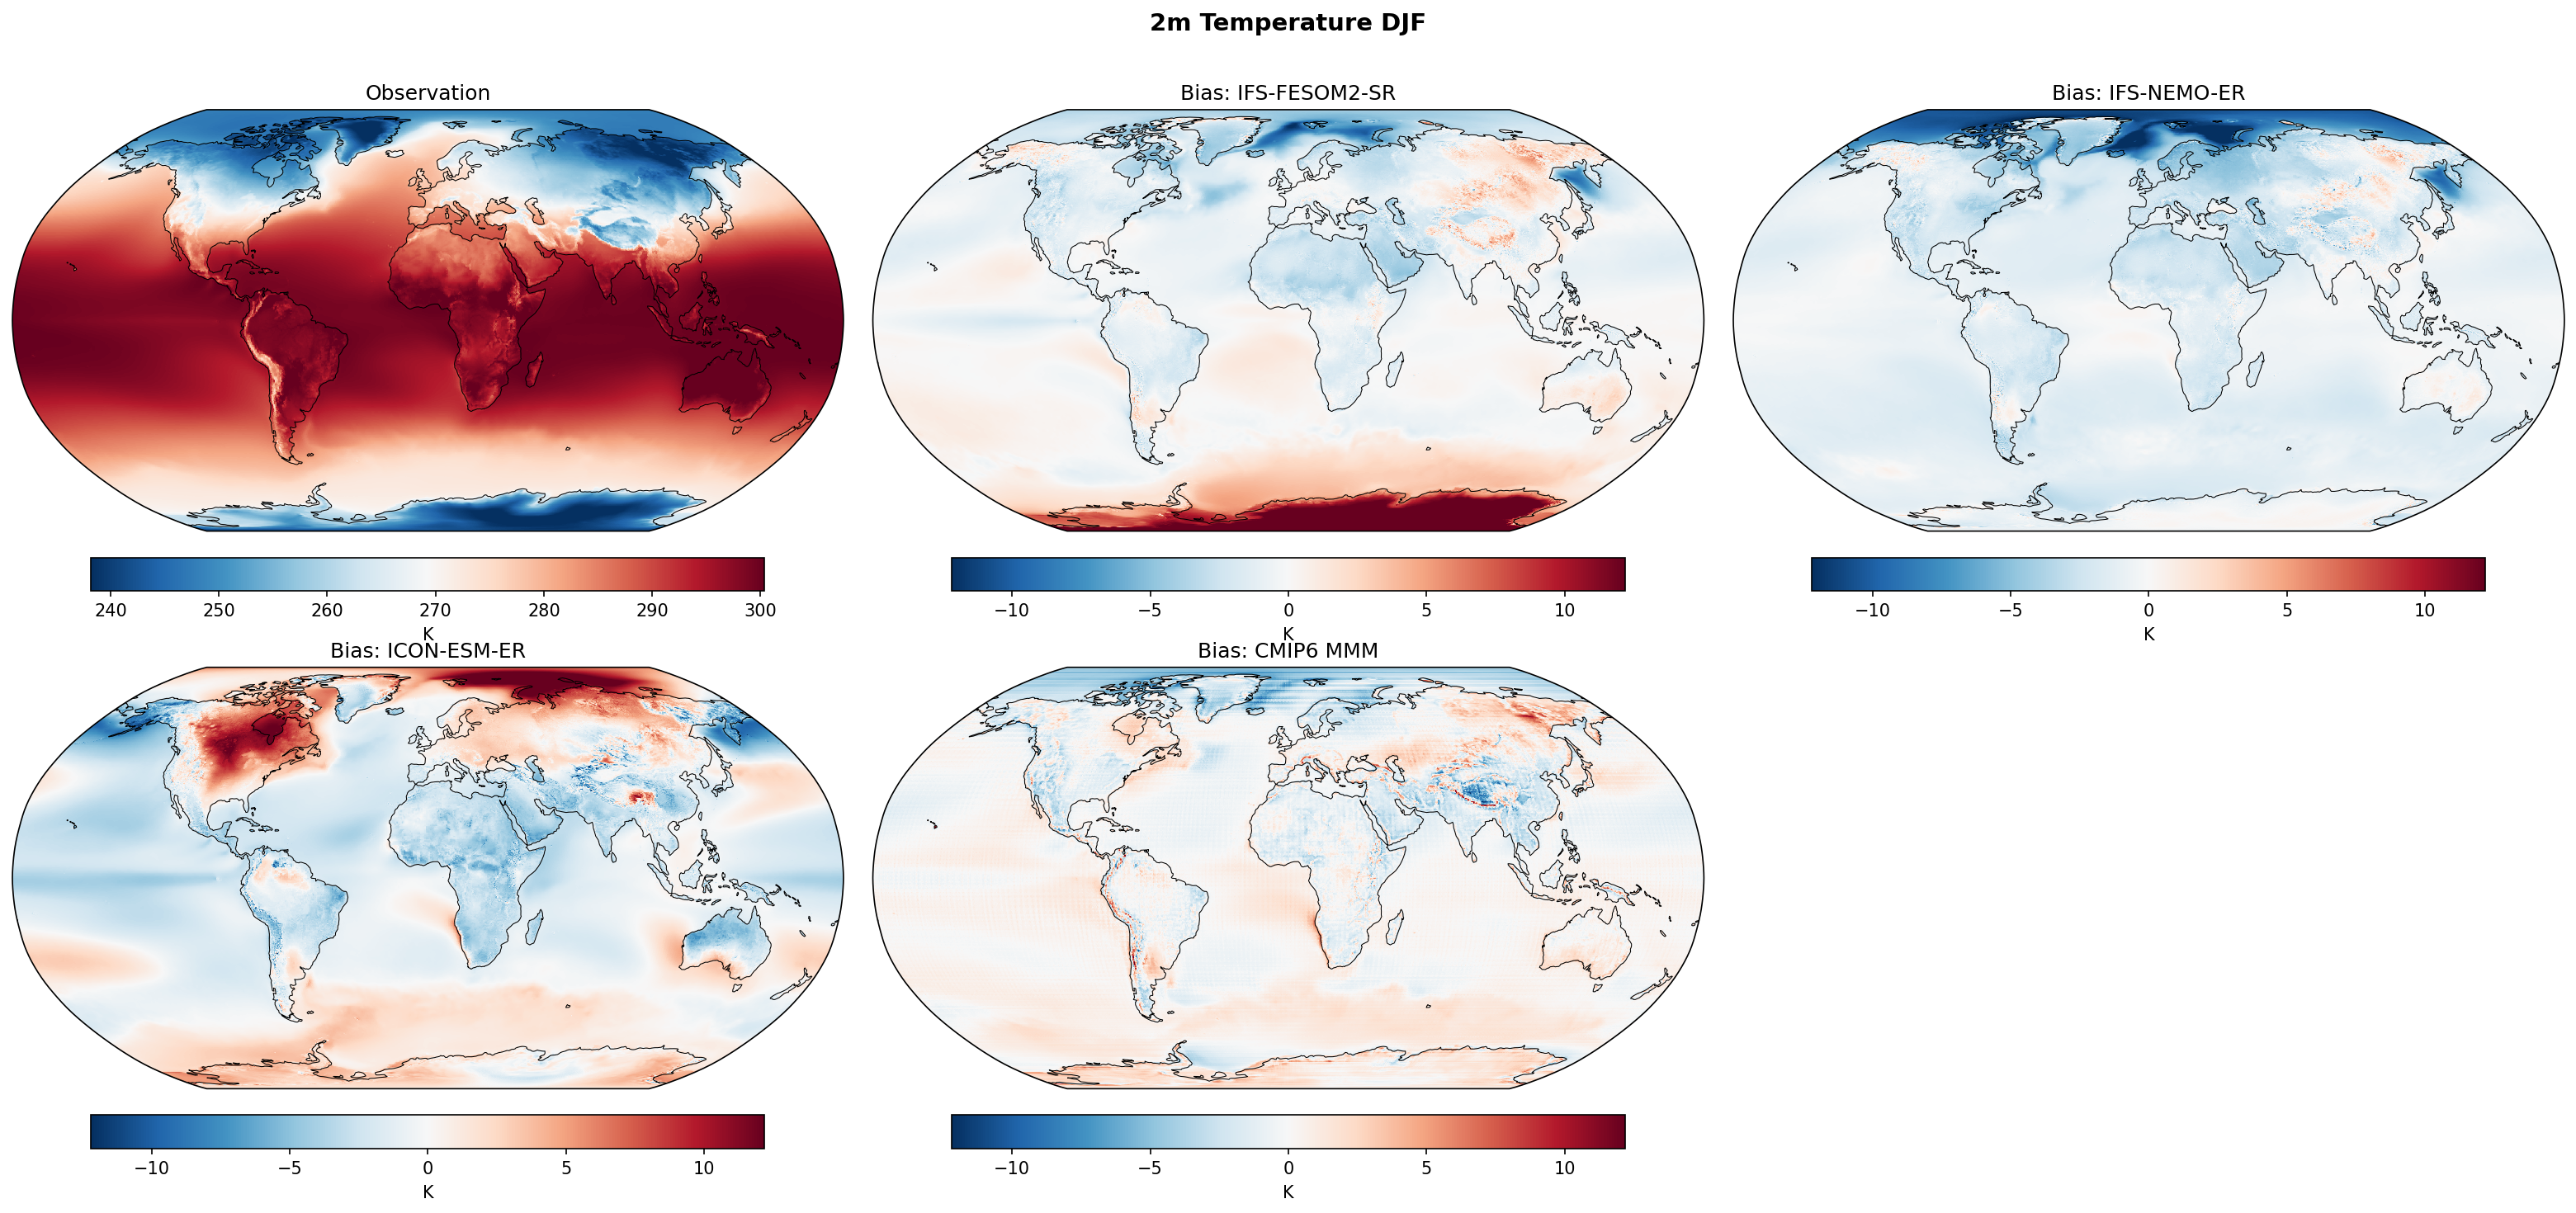
| Variables | tas |
|---|---|
| Models | IFS-FESOM2-SR, IFS-NEMO-ER, ICON-ESM-ER, CMIP6 MMM, MPI-ESM1-2-LR/r1i1p1f1, GISS-E2-1-G/r1i1p1f2, IPSL-CM6A-LR/r1i1p1f1, ACCESS-ESM1-5/r1i1p1f1, EC-Earth3/r1i1p1f1, CNRM-CM6-1/r1i1p1f2, AWI-CM-1-1-MR/r1i1p1f1, CNRM-ESM2-1/r1i1p1f2, FGOALS-g3/r1i1p1f1, INM-CM5-0/r1i1p1f1, MRI-ESM2-0/r1i1p1f1 |
| Reference Dataset | ERA5 |
| Units | K |
| Period | 1980–2014 |
| CMIP6 MMM | Global Mean Bias: -0.00 · Rmse: None |
| MPI-ESM1-2-LR/r1i1p1f1 | Global Mean Bias: 0.09 · Rmse: None |
| GISS-E2-1-G/r1i1p1f2 | Global Mean Bias: 0.18 · Rmse: None |
| IPSL-CM6A-LR/r1i1p1f1 | Global Mean Bias: -0.55 · Rmse: None |
| ACCESS-ESM1-5/r1i1p1f1 | Global Mean Bias: 0.93 · Rmse: None |
| EC-Earth3/r1i1p1f1 | Global Mean Bias: 0.25 · Rmse: None |
| CNRM-CM6-1/r1i1p1f2 | Global Mean Bias: -0.63 · Rmse: None |
| AWI-CM-1-1-MR/r1i1p1f1 | Global Mean Bias: 0.41 · Rmse: None |
| CNRM-ESM2-1/r1i1p1f2 | Global Mean Bias: 0.00 · Rmse: None |
| FGOALS-g3/r1i1p1f1 | Global Mean Bias: -0.73 · Rmse: None |
| INM-CM5-0/r1i1p1f1 | Global Mean Bias: -0.39 · Rmse: None |
| MRI-ESM2-0/r1i1p1f1 | Global Mean Bias: 0.37 · Rmse: None |
Summary high
This diagnostic evaluates DJF 2m temperature biases in high-resolution EERIE simulations (IFS-FESOM2-SR, IFS-NEMO-ER, ICON-ESM-ER) compared to ERA5 and the CMIP6 ensemble. The high-resolution models exhibit distinct regional bias patterns, particularly in high latitudes, that diverge from the smoother CMIP6 multi-model mean.
Key Findings
- IFS-FESOM2-SR and IFS-NEMO-ER share a widespread cold bias over Northern Hemisphere continents (Eurasia and North America), typically reaching -2.5 to -5 K.
- A striking divergence occurs over Antarctica: IFS-FESOM2-SR shows a strong warm bias (>5 K), whereas IFS-NEMO-ER exhibits a slight cold bias, highlighting the impact of the ocean/sea-ice component (FESOM vs. NEMO) coupled to the same atmosphere.
- ICON-ESM-ER displays a unique, strong dipole pattern in the Northern Hemisphere: extreme warming over Northeastern Canada/Greenland (>7.5 K) and strong cooling over Eurasia, suggesting a significant stationary wave or circulation error.
- While the CMIP6 Multi-Model Mean shows a warm bias in the Southern Ocean and weak biases over NH land, individual CMIP6 members vary wildly (e.g., ACCESS-ESM1-5 is extremely warm globally; IPSL-CM6A-LR is generally cold).
- ICON-ESM-ER exhibits a pronounced cold bias in the North Atlantic subpolar gyre region (the 'warming hole'), stronger than in the IFS-based models.
Spatial Patterns
Biases are amplified in high latitudes and over land. The Northern Hemisphere winter (DJF) manifests as extensive cold biases over land in the IFS models. ICON-ESM-ER shows a zonal asymmetry in the NH high latitudes (warm west/cold east). Southern Hemisphere biases are dominated by the Antarctic continent warm bias in IFS-FESOM2-SR and Southern Ocean warm biases in ICON and several CMIP6 models.
Model Agreement
The two IFS-based models agree well on Northern Hemisphere land biases (cold) but disagree strongly on Antarctic surface temperature. The high-resolution models generally do not follow the CMIP6 MMM pattern, often showing sharper, more regionally coherent biases rather than the diffuse errors of the ensemble mean.
Physical Interpretation
The NH land cold biases in IFS likely stem from wintertime boundary layer stability issues or snow-albedo feedback parameterizations (excessive radiative cooling). The IFS-FESOM2-SR Antarctic warm bias suggests issues with sea ice thickness or insulation, allowing excess ocean heat flux to the atmosphere. The ICON-ESM-ER dipole (warm Canada/cold Eurasia) implies a displaced jet stream or blocking pattern, potentially advecting warm maritime air over NE Canada (or failing to form sea ice in Hudson Bay) while subjecting Eurasia to excessive continental cooling.
Caveats
- Analysis is limited to DJF (boreal winter/austral summer); summer biases may differ.
- Biases over high topography (Himalayas, Andes) in CMIP6 models may be partly due to resolution differences with ERA5, which high-res models resolve better.
2m Temperature JJA Bias
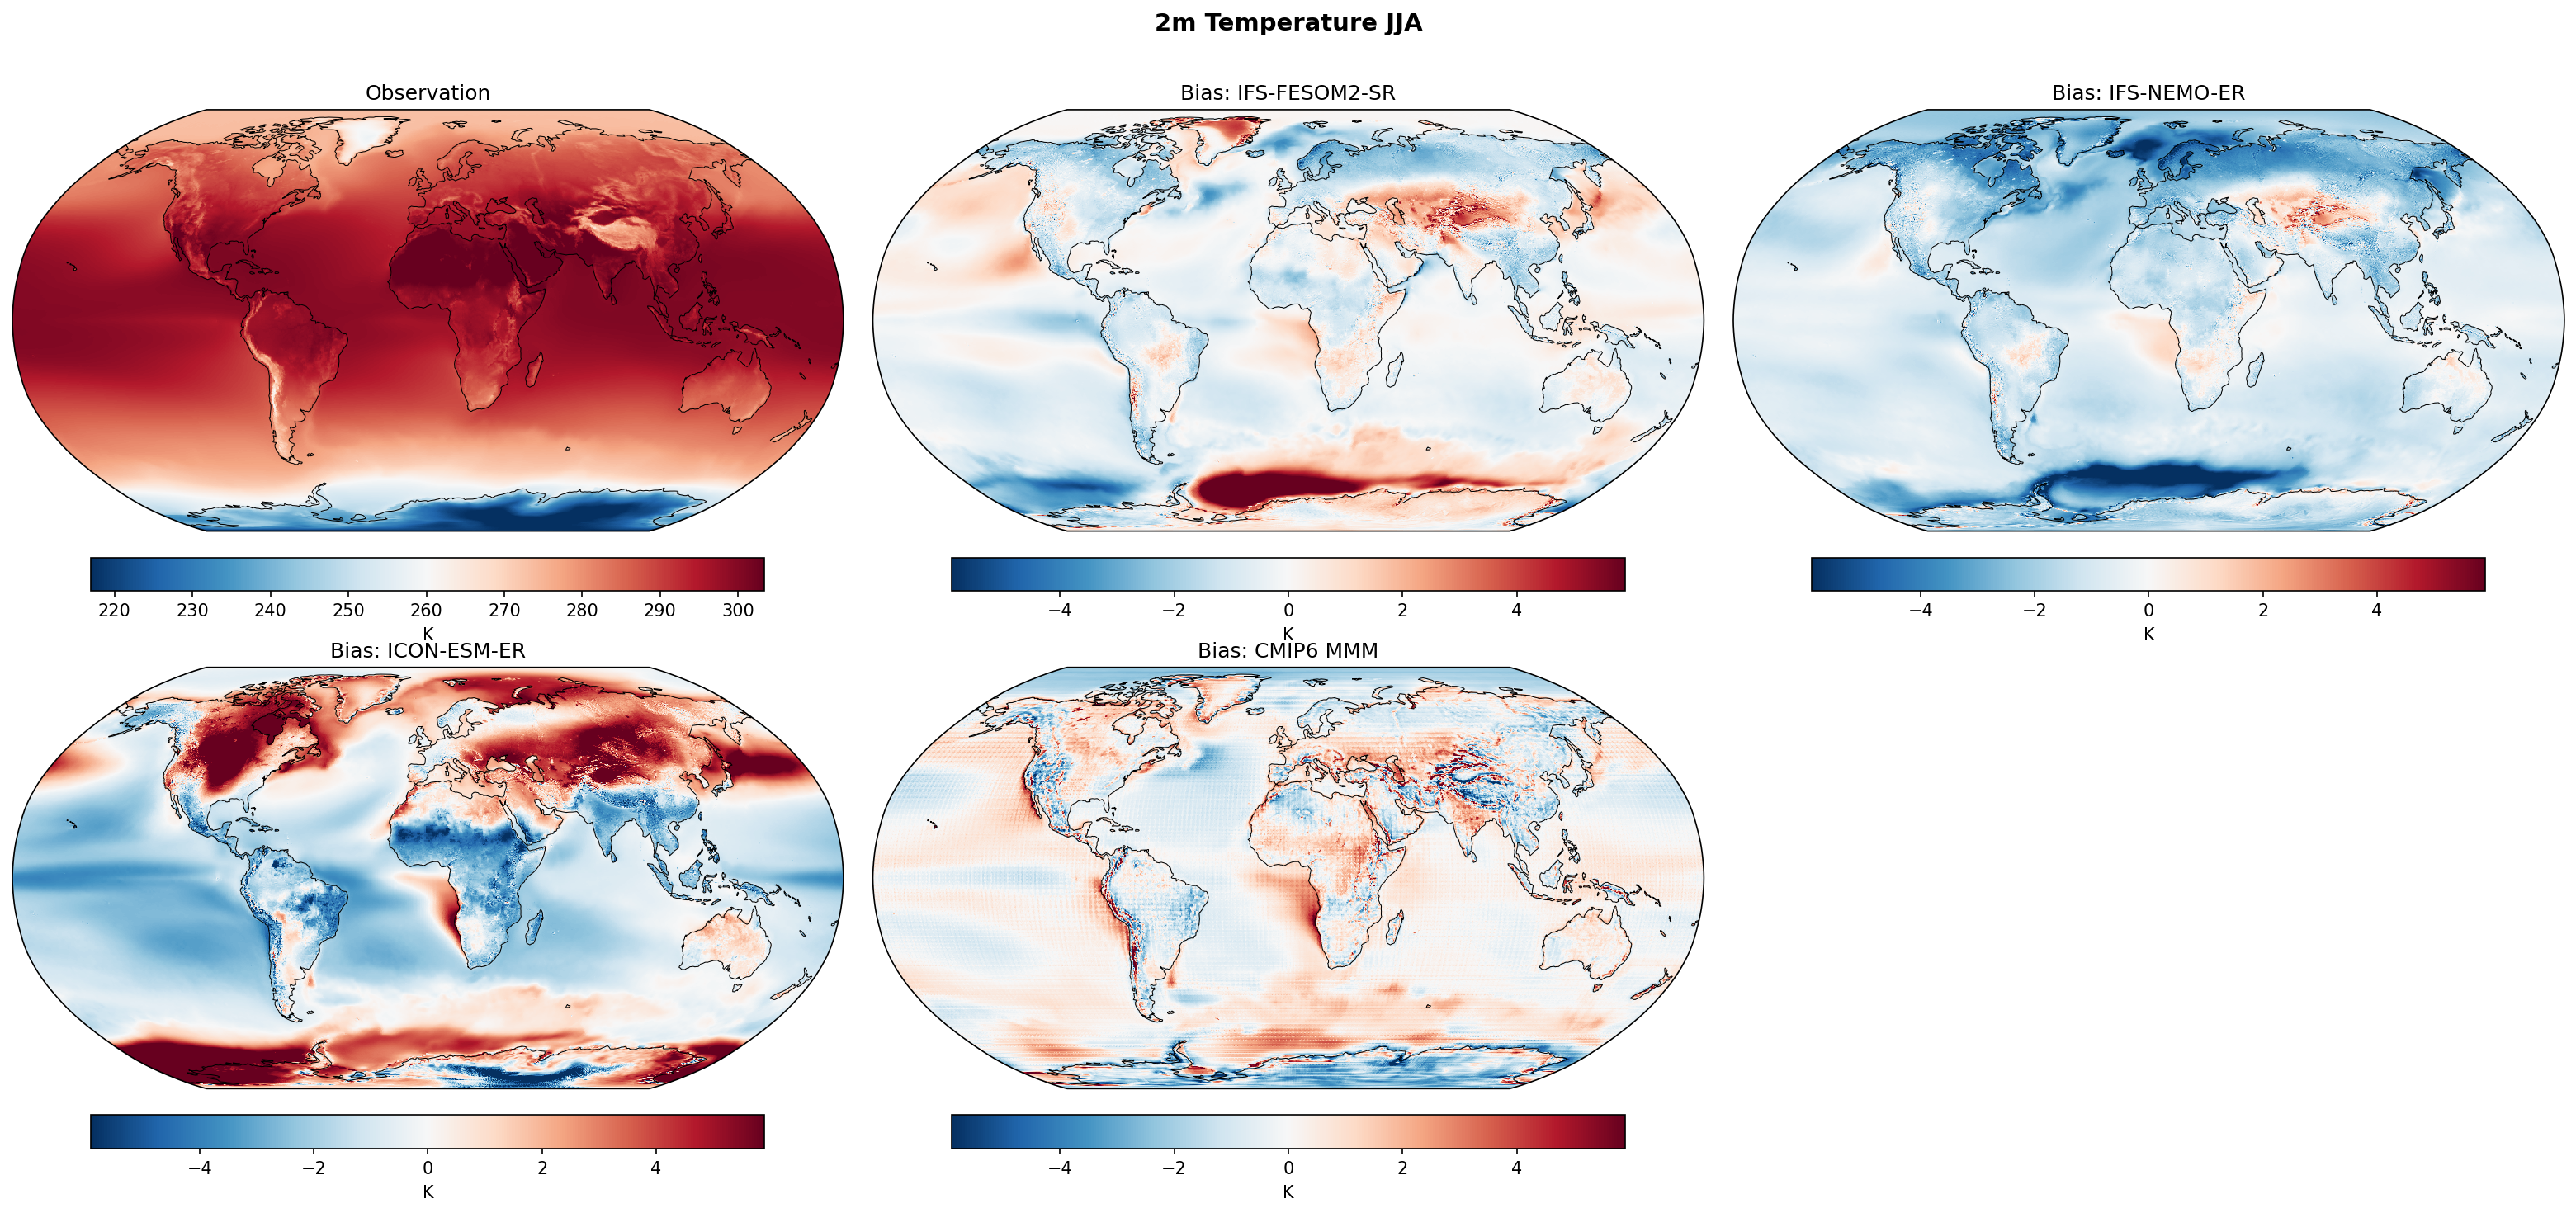
| Variables | tas |
|---|---|
| Models | IFS-FESOM2-SR, IFS-NEMO-ER, ICON-ESM-ER, CMIP6 MMM, MPI-ESM1-2-LR/r1i1p1f1, GISS-E2-1-G/r1i1p1f2, IPSL-CM6A-LR/r1i1p1f1, ACCESS-ESM1-5/r1i1p1f1, EC-Earth3/r1i1p1f1, CNRM-CM6-1/r1i1p1f2, AWI-CM-1-1-MR/r1i1p1f1, CNRM-ESM2-1/r1i1p1f2, FGOALS-g3/r1i1p1f1, INM-CM5-0/r1i1p1f1, MRI-ESM2-0/r1i1p1f1 |
| Reference Dataset | ERA5 |
| Units | K |
| Period | 1980–2014 |
| CMIP6 MMM | Global Mean Bias: 0.03 · Rmse: None |
| MPI-ESM1-2-LR/r1i1p1f1 | Global Mean Bias: 0.13 · Rmse: None |
| GISS-E2-1-G/r1i1p1f2 | Global Mean Bias: -0.10 · Rmse: None |
| IPSL-CM6A-LR/r1i1p1f1 | Global Mean Bias: -0.37 · Rmse: None |
| ACCESS-ESM1-5/r1i1p1f1 | Global Mean Bias: 0.82 · Rmse: None |
| EC-Earth3/r1i1p1f1 | Global Mean Bias: 0.51 · Rmse: None |
| CNRM-CM6-1/r1i1p1f2 | Global Mean Bias: -0.50 · Rmse: None |
| AWI-CM-1-1-MR/r1i1p1f1 | Global Mean Bias: 0.39 · Rmse: None |
| CNRM-ESM2-1/r1i1p1f2 | Global Mean Bias: 0.14 · Rmse: None |
| FGOALS-g3/r1i1p1f1 | Global Mean Bias: -0.31 · Rmse: None |
| INM-CM5-0/r1i1p1f1 | Global Mean Bias: -0.29 · Rmse: None |
| MRI-ESM2-0/r1i1p1f1 | Global Mean Bias: -0.03 · Rmse: None |
Summary high
This diagnostic evaluates June-July-August (JJA) 2m temperature biases in high-resolution EERIE simulations (IFS-FESOM2-SR, IFS-NEMO-ER, ICON-ESM-ER) relative to ERA5 and a suite of CMIP6 models. The analysis reveals distinct bias regimes: IFS models are generally cool-biased (with specific polar anomalies), while ICON-ESM-ER exhibits a strong hemispheric contrast with excessive warming over Northern Hemisphere land.
Key Findings
- ICON-ESM-ER shows a striking bias dipole: strong warm biases (>4-6 K) over NH continents (North America, Eurasia) during their summer, contrasted with cold biases over most oceans and Antarctica.
- IFS-FESOM2-SR contains a distinct, intense warm bias over the Antarctic continent that is absent in the IFS-NEMO-ER configuration, suggesting sensitivity to the sea-ice/ocean coupling method (FESOM vs NEMO).
- Both IFS simulations largely avoid the classic 'Southern Ocean warm bias' prevalent in many CMIP6 models (e.g., ACCESS-ESM1-5, EC-Earth3, AWI-CM-1-1-MR), instead showing neutral to cool biases in this region.
- IFS-NEMO-ER exhibits the most widespread cold bias pattern, particularly strong in the North Atlantic and North Pacific, resembling the CMIP6 'cold' cluster (e.g., CNRM-CM6-1).
Spatial Patterns
The CMIP6 Multi-Model Mean (MMM) shows familiar systematic errors: warm biases in the Southern Ocean and cool biases in the North Atlantic 'warming hole'. In contrast, ICON-ESM-ER diverges sharply with its 'hot land/cold ocean' summer pattern. IFS-NEMO-ER presents a relatively uniform cool bias over oceans. IFS-FESOM2-SR is spatially similar to the NEMO configuration but is punctuated by the strong Antarctic warm anomaly.
Model Agreement
Inter-model agreement among the EERIE high-resolution models is low. ICON and IFS show opposite signs over major NH landmasses (ICON is too hot, IFS is neutral/cool). However, the IFS-NEMO-ER agrees better with the 'cooler' subset of CMIP6 models (IPSL, CNRM) rather than the 'warmer' subset (ACCESS, EC-Earth3).
Physical Interpretation
The extreme summer warm bias over land in ICON-ESM-ER suggests deficiencies in land-atmosphere coupling (e.g., soil moisture-temperature feedbacks drying out too fast) or excessive surface solar radiation due to cloud cover biases. The improvement in the Southern Ocean warm bias in IFS models is likely attributable to higher ocean resolution (eddy-rich/permitting regime) improving heat uptake and the representation of the Antarctic Circumpolar Current front. The discrepancy between IFS-FESOM and IFS-NEMO over Antarctica points to differences in sea-ice thermodynamics or surface fluxes over the ice sheet specific to the FESOM coupling interface.
Caveats
- The analysis is limited to JJA (NH summer/SH winter); biases likely differ in DJF.
- The strong Antarctic bias in IFS-FESOM may distort global mean statistics despite being regionally confined.
10m U Wind Annual Mean Bias
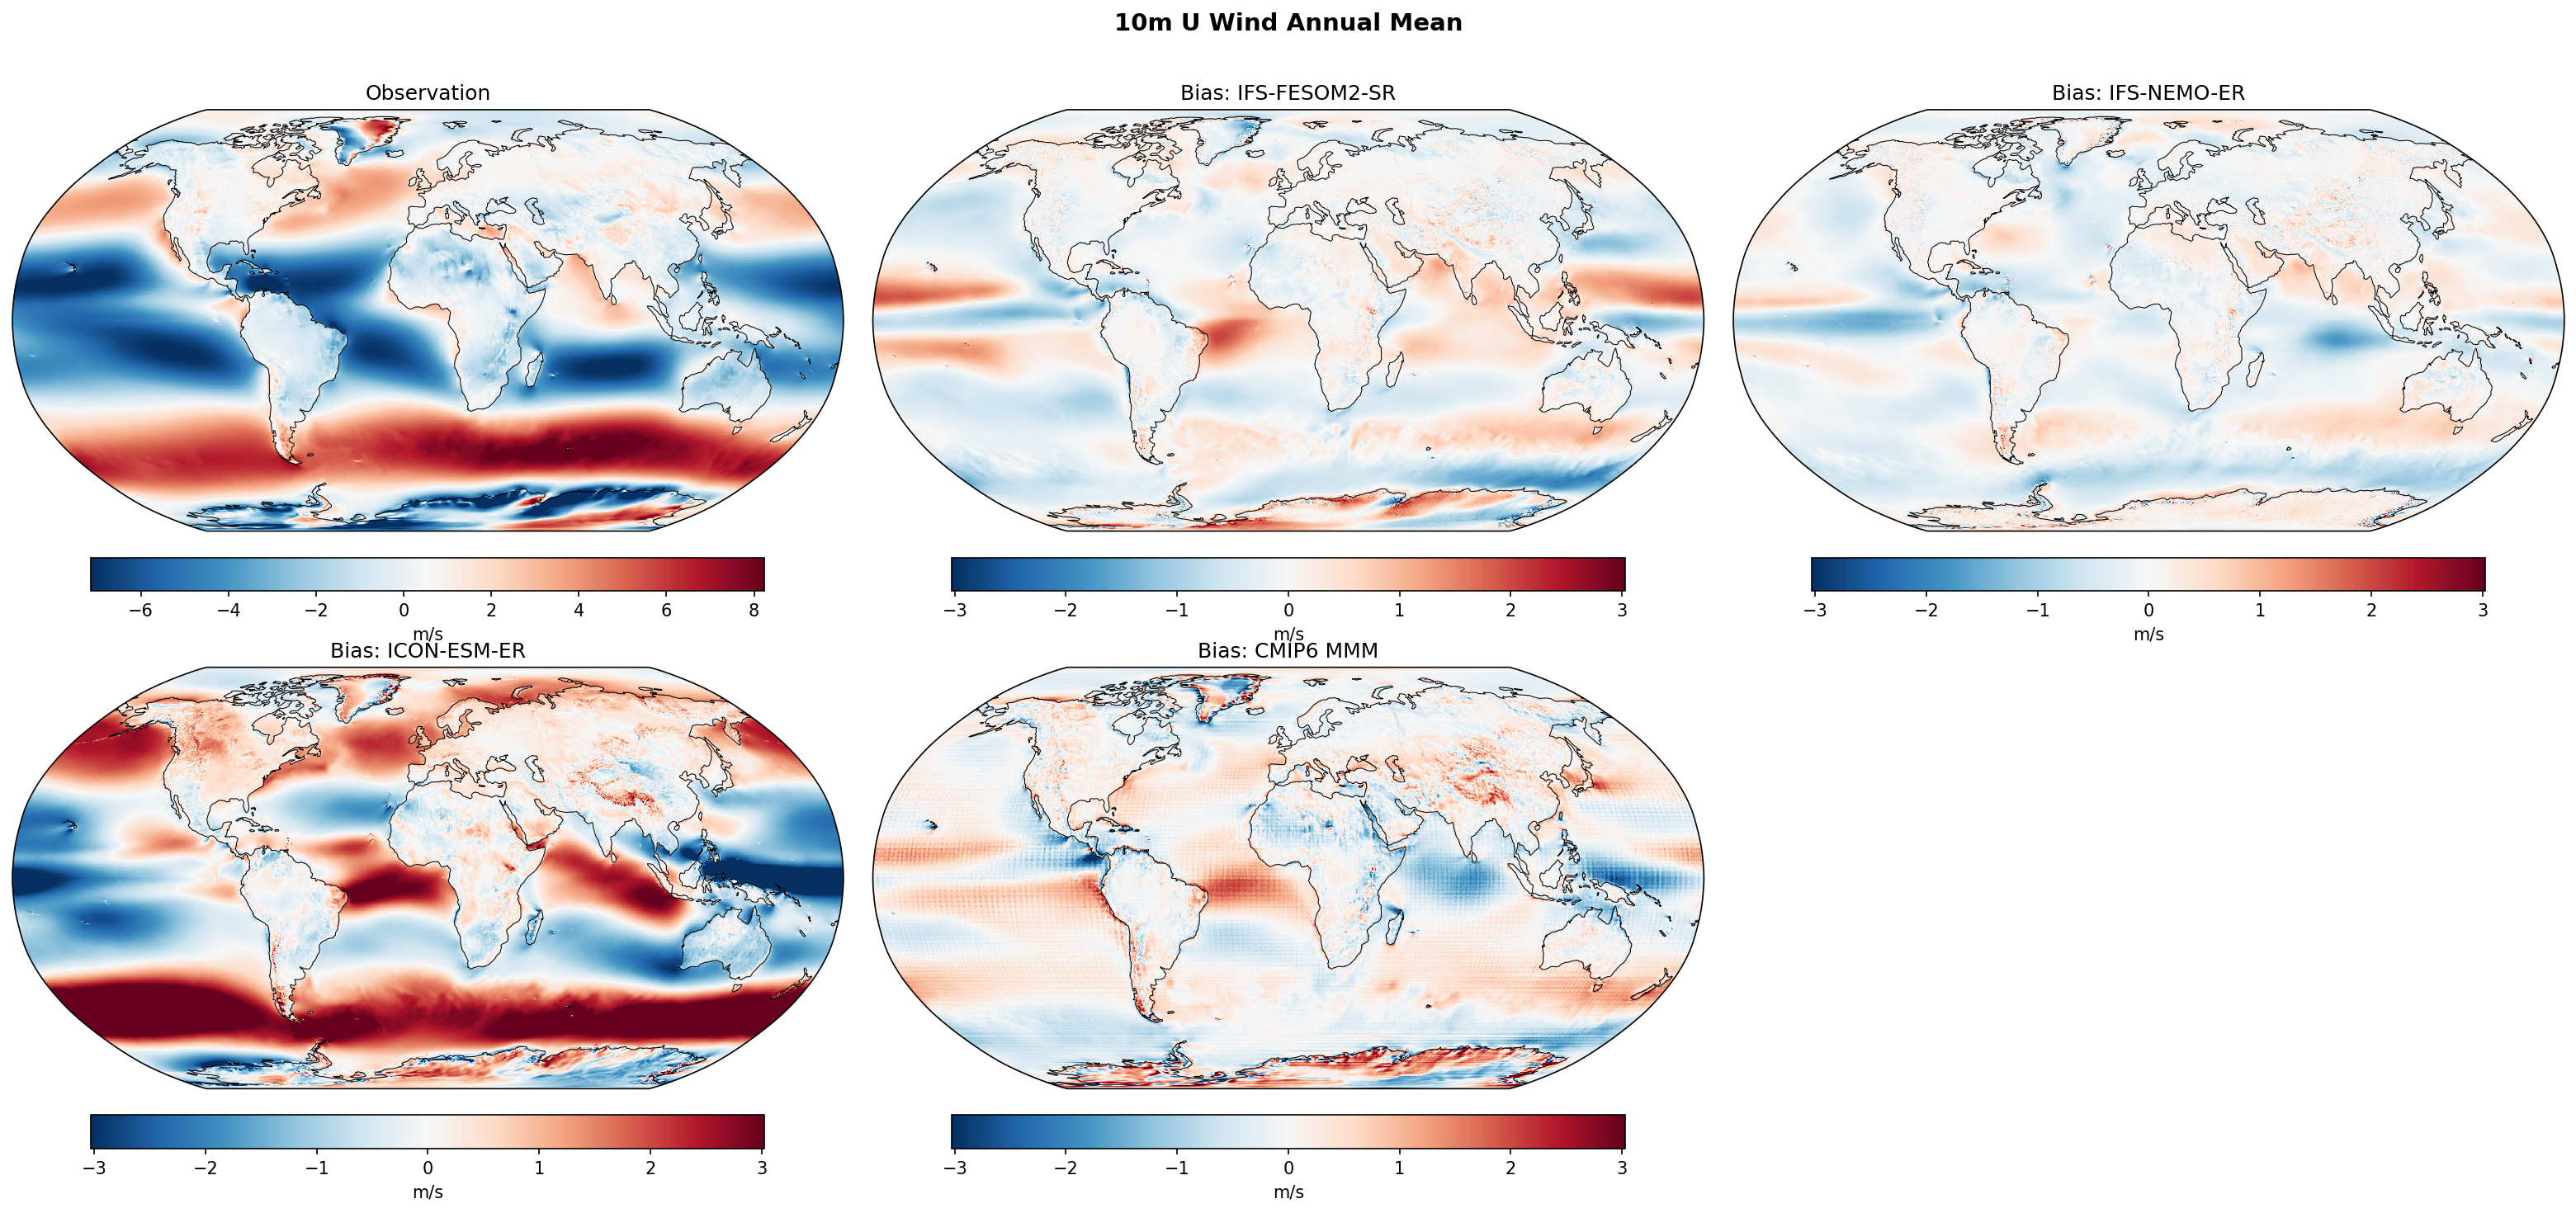
| Variables | uas |
|---|---|
| Models | IFS-FESOM2-SR, IFS-NEMO-ER, ICON-ESM-ER, CMIP6 MMM, MPI-ESM1-2-LR/r1i1p1f1, GISS-E2-1-G/r1i1p1f2, IPSL-CM6A-LR/r1i1p1f1, ACCESS-ESM1-5/r1i1p1f1, EC-Earth3/r1i1p1f1, CNRM-CM6-1/r1i1p1f2, AWI-CM-1-1-MR/r1i1p1f1, CNRM-ESM2-1/r1i1p1f2, INM-CM5-0/r1i1p1f1, MRI-ESM2-0/r1i1p1f1 |
| Reference Dataset | ERA5 |
| Units | m/s |
| Period | 1980–2014 |
| IFS-FESOM2-SR | Global Mean Bias: -0.01 · Rmse: 0.54 |
| IFS-NEMO-ER | Global Mean Bias: -0.11 · Rmse: 0.41 |
| ICON-ESM-ER | Global Mean Bias: 0.26 · Rmse: 1.67 |
| CMIP6 MMM | Global Mean Bias: 0.01 · Rmse: 0.62 |
| MPI-ESM1-2-LR/r1i1p1f1 | Global Mean Bias: 0.08 · Rmse: 0.87 |
| GISS-E2-1-G/r1i1p1f2 | Global Mean Bias: 0.14 · Rmse: 1.07 |
| IPSL-CM6A-LR/r1i1p1f1 | Global Mean Bias: -0.04 · Rmse: 0.83 |
| ACCESS-ESM1-5/r1i1p1f1 | Global Mean Bias: -0.19 · Rmse: 0.82 |
| EC-Earth3/r1i1p1f1 | Global Mean Bias: 0.03 · Rmse: 0.62 |
| CNRM-CM6-1/r1i1p1f2 | Global Mean Bias: 0.02 · Rmse: 0.85 |
| AWI-CM-1-1-MR/r1i1p1f1 | Global Mean Bias: 0.08 · Rmse: 0.79 |
| CNRM-ESM2-1/r1i1p1f2 | Global Mean Bias: 0.03 · Rmse: 0.84 |
| INM-CM5-0/r1i1p1f1 | Global Mean Bias: 0.07 · Rmse: 1.03 |
| MRI-ESM2-0/r1i1p1f1 | Global Mean Bias: -0.07 · Rmse: 0.97 |
Summary high
This diagnostic evaluates annual mean 10m zonal wind (uas) biases relative to ERA5 reanalysis, comparing high-resolution EERIE models (IFS, ICON) against the CMIP6 ensemble. The IFS models demonstrate superior fidelity, while ICON-ESM-ER exhibits substantial zonal biases.
Key Findings
- IFS-NEMO-ER achieves the best agreement with observations (RMSE 0.41 m/s), showing remarkably low biases across the global ocean compared to all other models shown.
- ICON-ESM-ER is a significant outlier with the highest RMSE (1.67 m/s), displaying strong systematic biases particularly in the Southern Hemisphere and Tropical Pacific.
- The CMIP6 Multi-Model Mean (RMSE 0.62 m/s) exhibits the classic 'equatorward shift' bias of the Southern Hemisphere westerlies, a feature that is largely corrected in the high-resolution IFS simulations.
- IFS-FESOM2-SR performs very well (RMSE 0.54 m/s) but shows slightly larger biases than IFS-NEMO-ER, specifically in the North Atlantic and Southern Ocean.
Spatial Patterns
The most prominent error pattern, seen strongly in ICON-ESM-ER and moderately in CMIP6 MMM, is a zonal dipole in the Southern Hemisphere (positive bias at ~40°S, negative bias at ~60°S), indicating an equatorward shift of the westerly jet. In the tropics, ICON-ESM-ER and several CMIP6 models (e.g., ACCESS-ESM1-5) show widespread negative biases (blue), indicating excessively strong trade winds. The IFS models largely eliminate these zonal banding structures.
Model Agreement
There is a stark divergence in model performance. The two IFS variants (NEMO and FESOM) agree well with observations and each other, showing minimal bias structure. In contrast, ICON-ESM-ER diverges significantly from both the observations and the CMIP6 ensemble mean, showing error magnitudes exceeding even the poorest performing CMIP6 models.
Physical Interpretation
The reduction of the Southern Hemisphere westerly jet bias in IFS models likely results from high resolution (~10 km) better resolving eddy momentum fluxes that maintain jet latitude. The severe equatorward shift and strengthening of trades in ICON-ESM-ER suggest potential issues with surface drag parameterizations, boundary layer physics, or the tuning of the atmospheric circulation in this specific configuration.
Caveats
- ERA5 reanalysis serves as truth but has higher uncertainty in the Southern Ocean due to sparse in-situ observations.
- Surface wind stress, not 10m wind speed, is the direct driver of ocean circulation; biases here will propagate to ocean dynamics (e.g., ACC transport).
10m U Wind DJF Bias
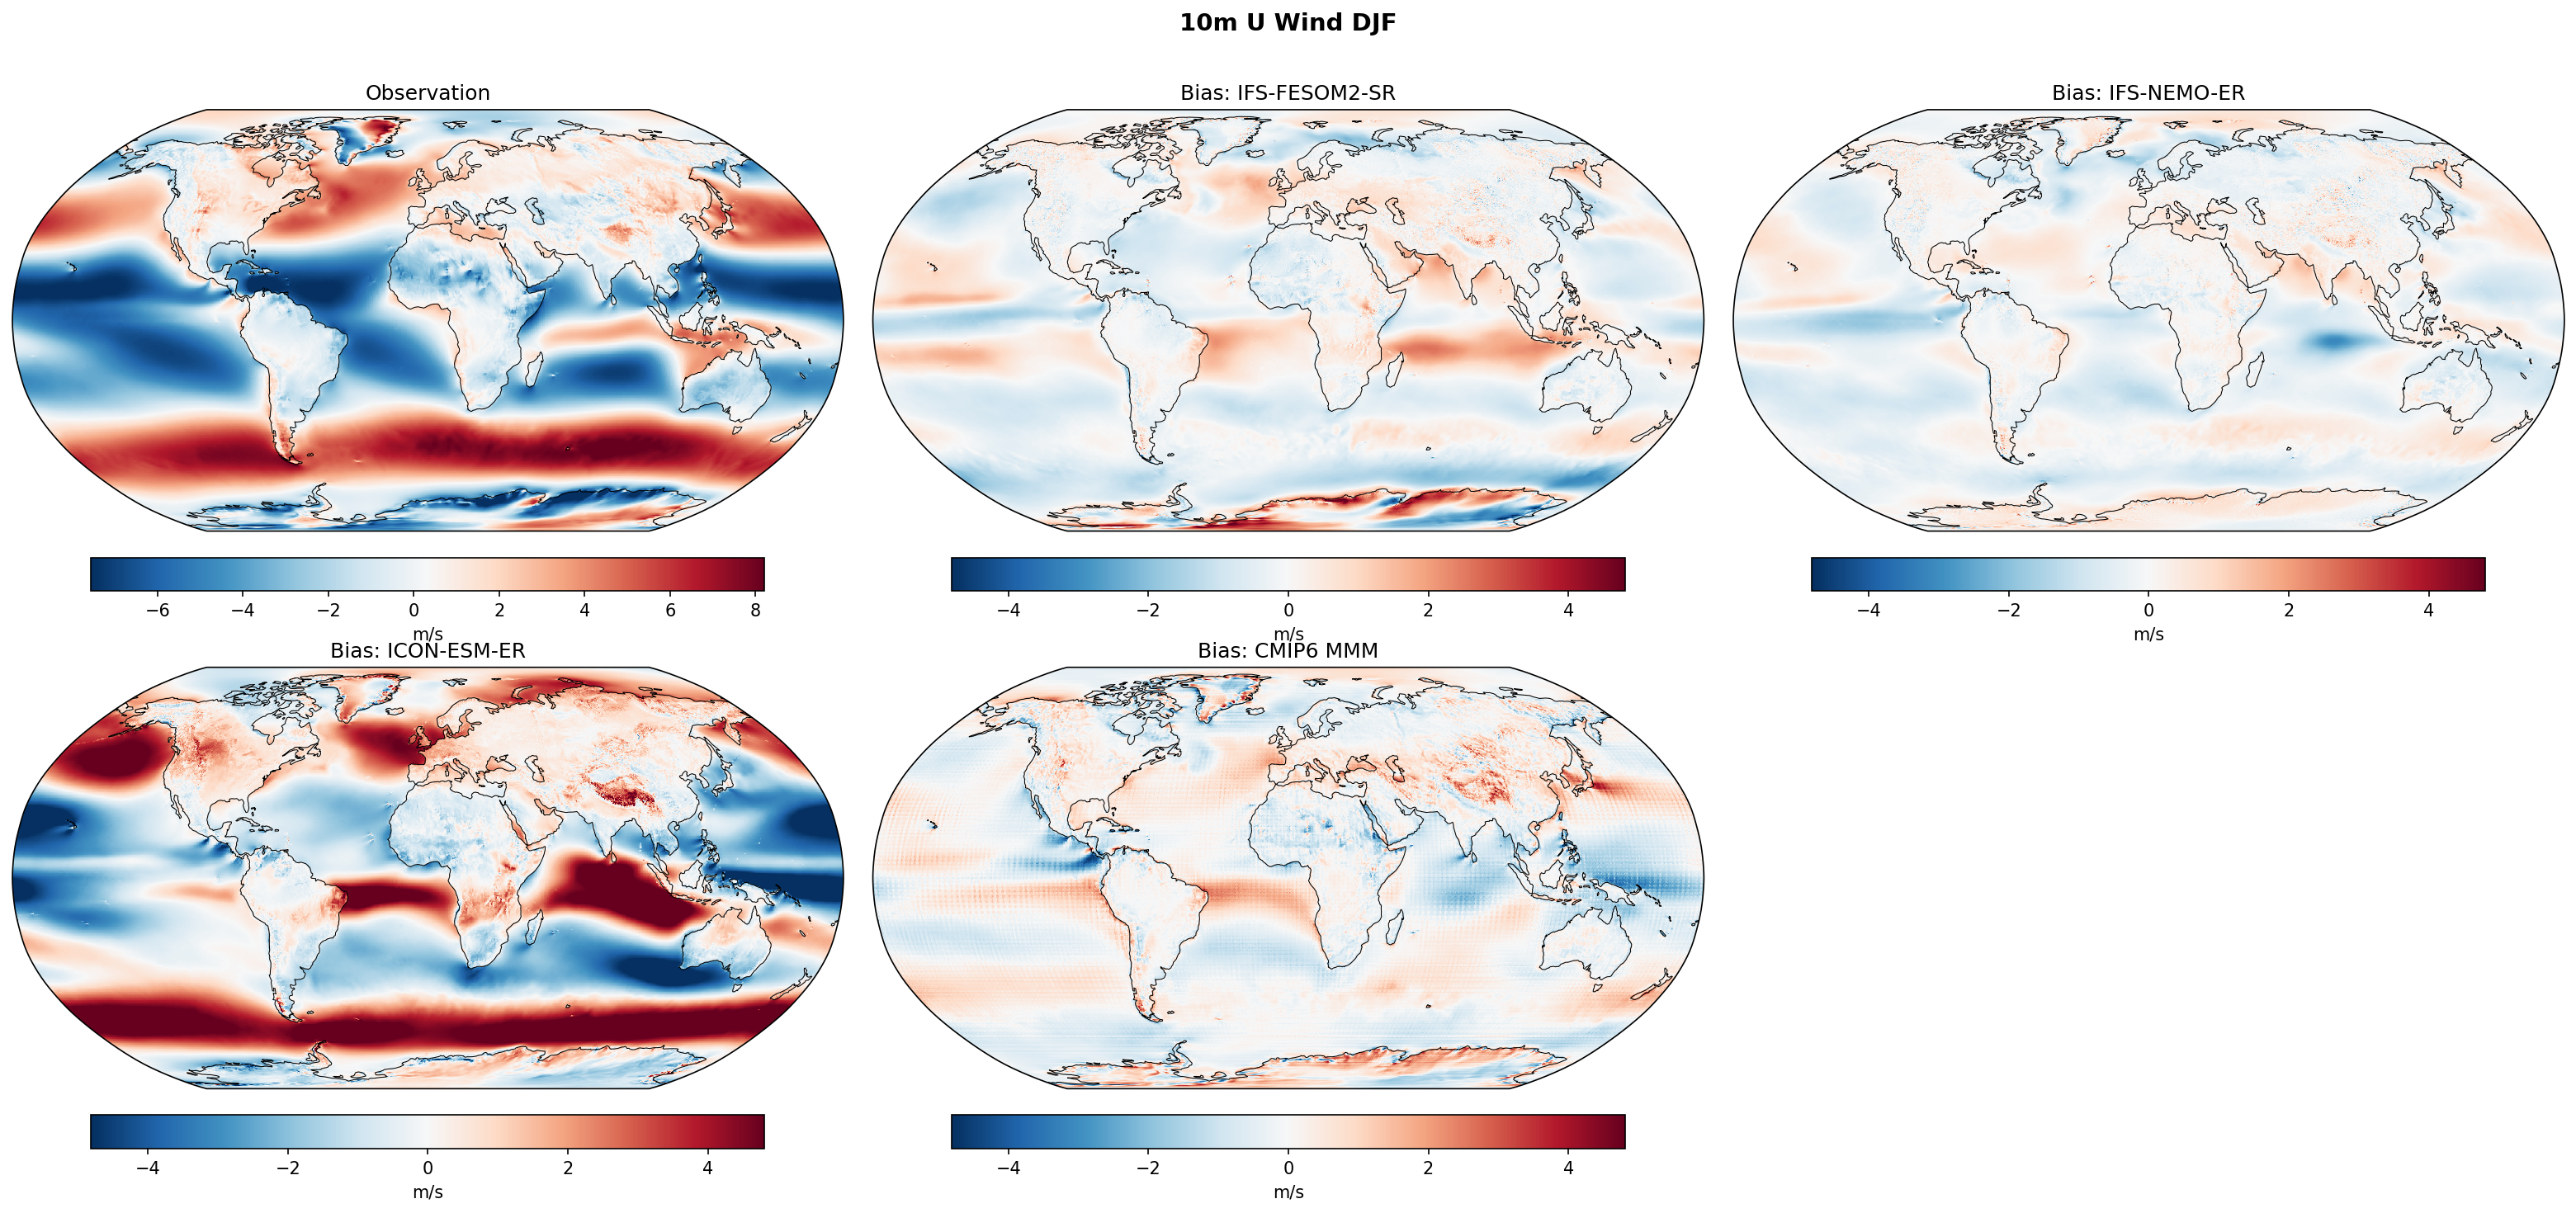
| Variables | uas |
|---|---|
| Models | IFS-FESOM2-SR, IFS-NEMO-ER, ICON-ESM-ER, CMIP6 MMM, MPI-ESM1-2-LR/r1i1p1f1, GISS-E2-1-G/r1i1p1f2, IPSL-CM6A-LR/r1i1p1f1, ACCESS-ESM1-5/r1i1p1f1, EC-Earth3/r1i1p1f1, CNRM-CM6-1/r1i1p1f2, AWI-CM-1-1-MR/r1i1p1f1, CNRM-ESM2-1/r1i1p1f2, INM-CM5-0/r1i1p1f1, MRI-ESM2-0/r1i1p1f1 |
| Reference Dataset | ERA5 |
| Units | m/s |
| Period | 1980–2014 |
| CMIP6 MMM | Global Mean Bias: -0.04 · Rmse: None |
| MPI-ESM1-2-LR/r1i1p1f1 | Global Mean Bias: 0.01 · Rmse: None |
| GISS-E2-1-G/r1i1p1f2 | Global Mean Bias: 0.12 · Rmse: None |
| IPSL-CM6A-LR/r1i1p1f1 | Global Mean Bias: -0.09 · Rmse: None |
| ACCESS-ESM1-5/r1i1p1f1 | Global Mean Bias: -0.29 · Rmse: None |
| EC-Earth3/r1i1p1f1 | Global Mean Bias: -0.01 · Rmse: None |
| CNRM-CM6-1/r1i1p1f2 | Global Mean Bias: -0.07 · Rmse: None |
| AWI-CM-1-1-MR/r1i1p1f1 | Global Mean Bias: 0.03 · Rmse: None |
| CNRM-ESM2-1/r1i1p1f2 | Global Mean Bias: -0.07 · Rmse: None |
| INM-CM5-0/r1i1p1f1 | Global Mean Bias: 0.07 · Rmse: None |
| MRI-ESM2-0/r1i1p1f1 | Global Mean Bias: -0.12 · Rmse: None |
Summary high
This figure evaluates DJF 10m zonal wind biases in high-resolution EERIE models (IFS-FESOM2, IFS-NEMO, ICON-ESM) and CMIP6 models relative to ERA5. The comparison reveals a stark contrast between the well-performing IFS models and the ICON model, which exhibits severe global biases.
Key Findings
- ICON-ESM-ER shows a massive systematic bias with significantly overestimated surface wind speeds globally; westerlies are too westerly (strong positive bias) and easterlies are too easterly (strong negative bias).
- IFS-FESOM2-SR and IFS-NEMO-ER exhibit nearly identical bias patterns with low magnitudes generally within ±1-2 m/s, significantly outperforming many CMIP6 models and ICON.
- The Southern Ocean westerly jet remains a common source of error, with most models displaying zonal dipole bias patterns indicative of latitudinal shifts or intensity discrepancies relative to ERA5.
- The CMIP6 Multi-Model Mean (MMM) shows a dipole bias in the Southern Hemisphere (negative roughly 40-50°S, positive 50-65°S), suggesting a poleward shift or strengthening of the jet's southern flank compared to ERA5.
Spatial Patterns
The most prominent spatial feature is the global intensification of wind systems in ICON-ESM-ER, characterized by deep red bands in the mid-latitude storm tracks (biases > +3 m/s) and deep blue bands in the tropical trade wind belts (biases < -3 m/s). In contrast, the IFS models show much fainter, more localized biases, such as slight positive biases in the eastern tropical ocean basins. The CMIP6 models show diverse patterns, but zonal banding in the Southern Ocean is a recurrent feature (e.g., ACCESS-ESM1-5, MRI-ESM2-0).
Model Agreement
There is high agreement between the two IFS-based models (IFS-FESOM2-SR and IFS-NEMO-ER), indicating that the atmospheric solver (IFS) dominates the surface wind solution over the choice of ocean coupling (FESOM vs NEMO). ICON-ESM-ER is a distinct outlier with poor agreement with observations. The IFS models generally agree better with ERA5 than the individual CMIP6 models shown.
Physical Interpretation
The symmetric overestimation of both westerlies and easterlies in ICON-ESM-ER strongly suggests a deficiency in surface drag parameterization or boundary layer momentum mixing; the atmosphere is not losing enough momentum to the surface, resulting in a 'super-rotation' like state. The dipole biases in the Southern Ocean seen in many models likely reflect errors in the meridional positioning of the eddy-driven jet. The superior performance of IFS models attributes well-tuned physics and higher resolution, which better resolves synoptic-scale momentum fluxes.
Caveats
- The extreme nature of the ICON bias suggests a potential configuration error or tuning issue rather than a fundamental resolution limit.
- Bias patterns in the Southern Ocean are zonally averaged in interpretation but clearly show regional asymmetries (e.g., downstream of topography) in the maps.
10m U Wind JJA Bias
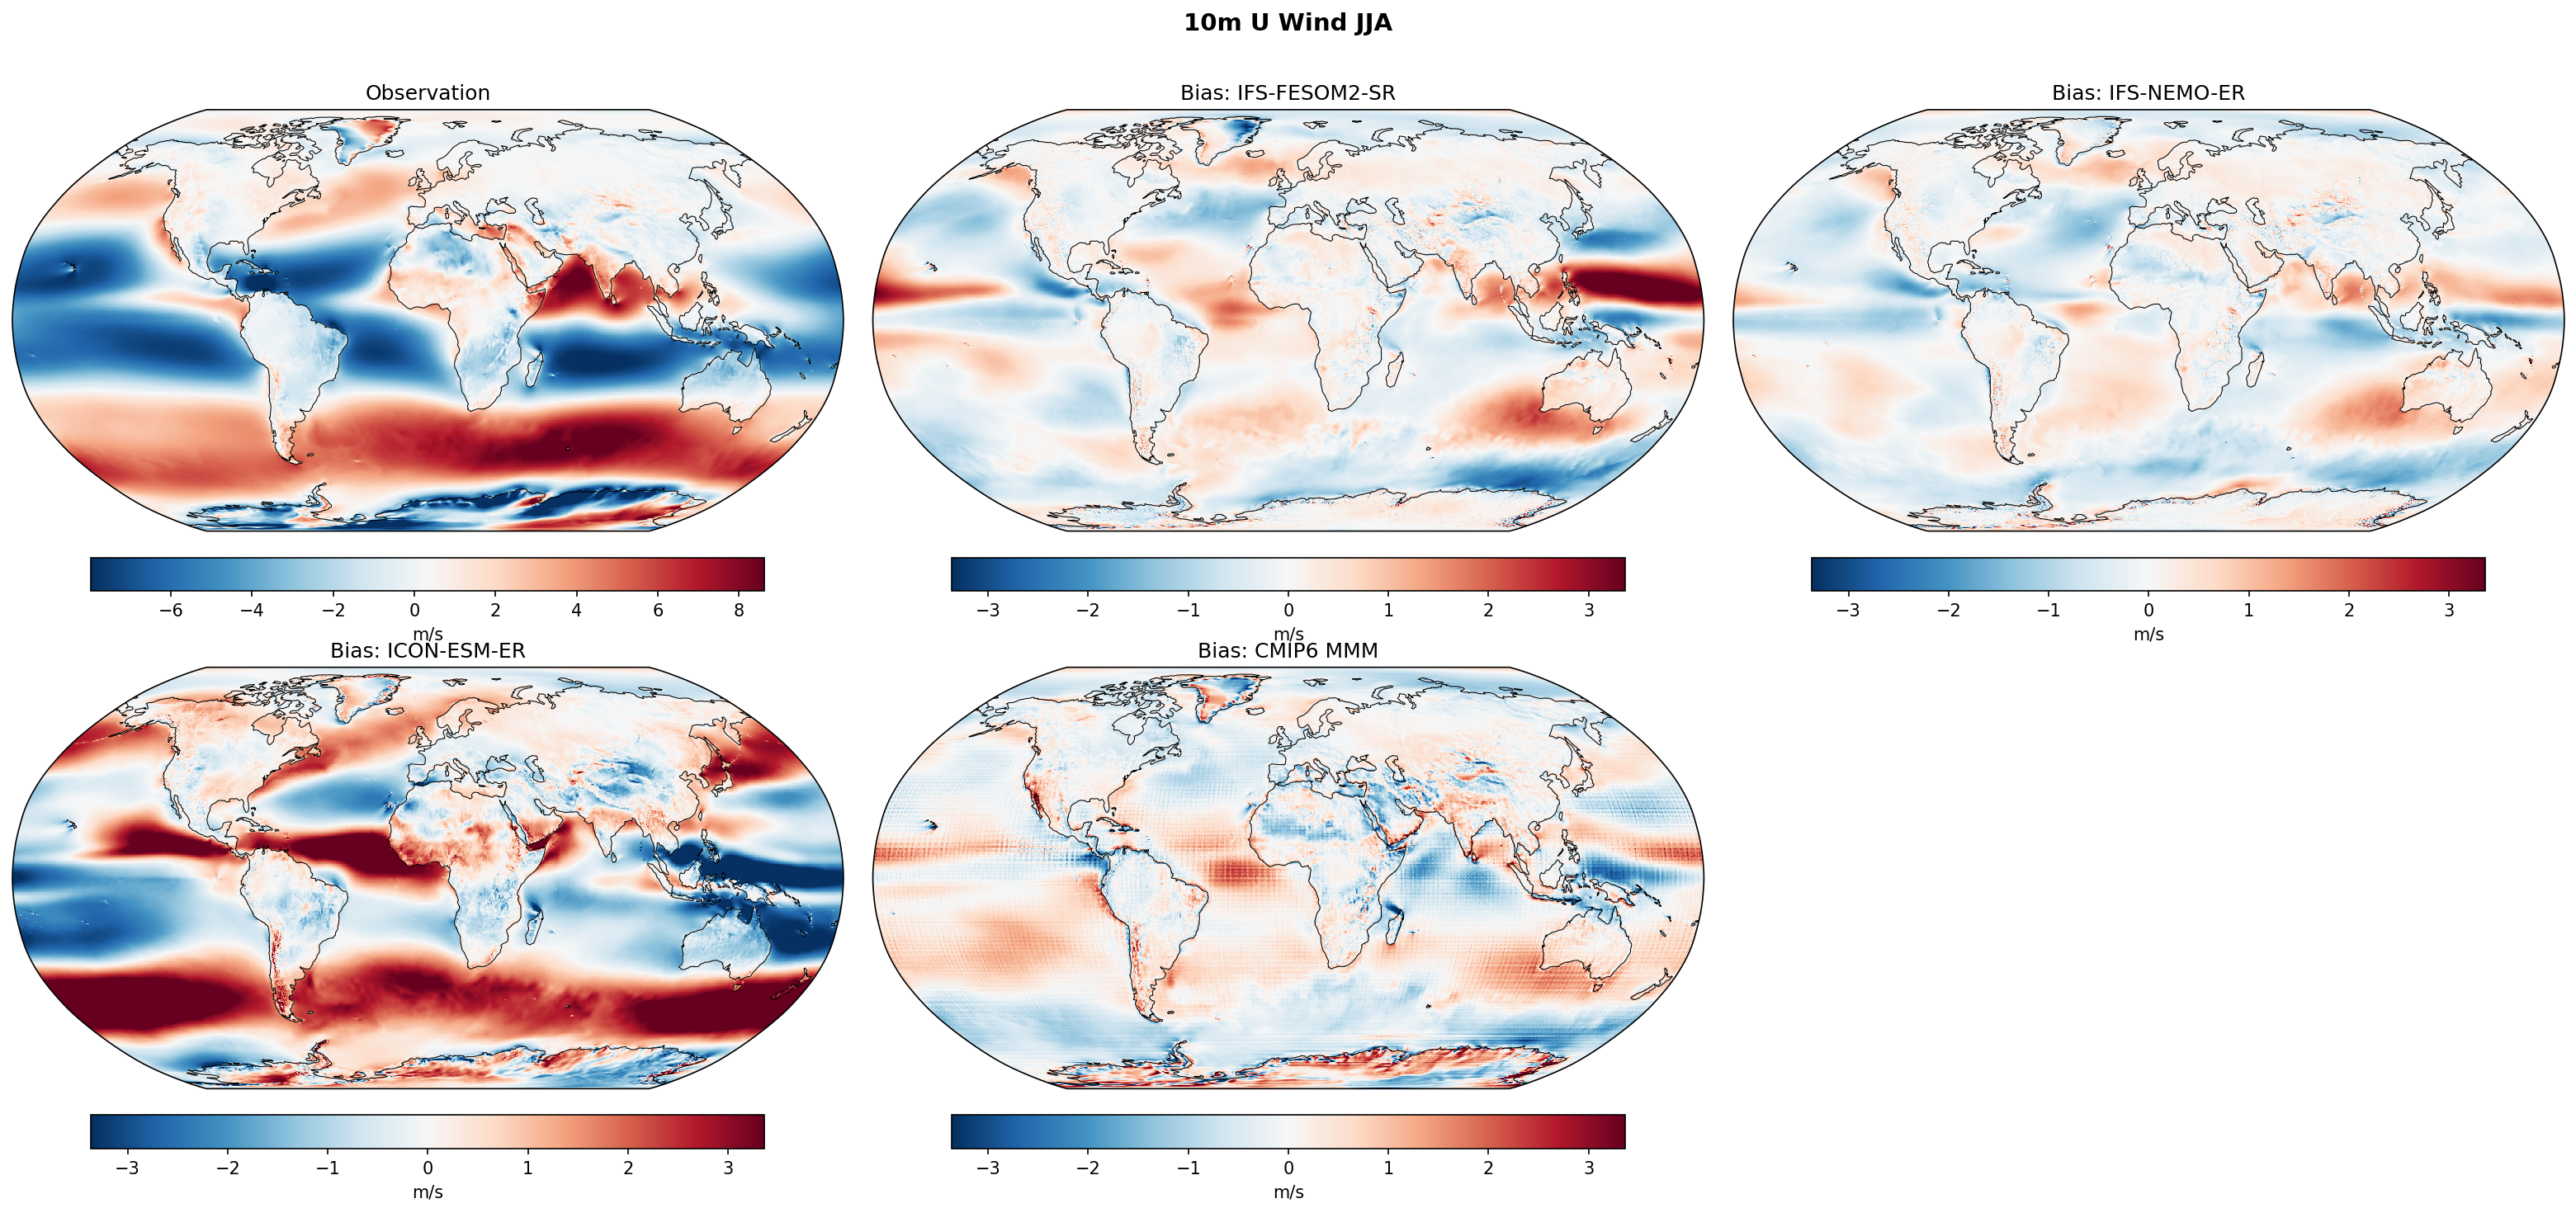
| Variables | uas |
|---|---|
| Models | IFS-FESOM2-SR, IFS-NEMO-ER, ICON-ESM-ER, CMIP6 MMM, MPI-ESM1-2-LR/r1i1p1f1, GISS-E2-1-G/r1i1p1f2, IPSL-CM6A-LR/r1i1p1f1, ACCESS-ESM1-5/r1i1p1f1, EC-Earth3/r1i1p1f1, CNRM-CM6-1/r1i1p1f2, AWI-CM-1-1-MR/r1i1p1f1, CNRM-ESM2-1/r1i1p1f2, INM-CM5-0/r1i1p1f1, MRI-ESM2-0/r1i1p1f1 |
| Reference Dataset | ERA5 |
| Units | m/s |
| Period | 1980–2014 |
| CMIP6 MMM | Global Mean Bias: -0.01 · Rmse: None |
| MPI-ESM1-2-LR/r1i1p1f1 | Global Mean Bias: 0.07 · Rmse: None |
| GISS-E2-1-G/r1i1p1f2 | Global Mean Bias: 0.09 · Rmse: None |
| IPSL-CM6A-LR/r1i1p1f1 | Global Mean Bias: -0.06 · Rmse: None |
| ACCESS-ESM1-5/r1i1p1f1 | Global Mean Bias: -0.18 · Rmse: None |
| EC-Earth3/r1i1p1f1 | Global Mean Bias: 0.02 · Rmse: None |
| CNRM-CM6-1/r1i1p1f2 | Global Mean Bias: 0.03 · Rmse: None |
| AWI-CM-1-1-MR/r1i1p1f1 | Global Mean Bias: 0.08 · Rmse: None |
| CNRM-ESM2-1/r1i1p1f2 | Global Mean Bias: 0.03 · Rmse: None |
| INM-CM5-0/r1i1p1f1 | Global Mean Bias: -0.07 · Rmse: None |
| MRI-ESM2-0/r1i1p1f1 | Global Mean Bias: -0.08 · Rmse: None |
Summary high
This figure evaluates JJA 10-meter zonal wind (U-wind) biases in high-resolution EERIE simulations (IFS-FESOM2-SR, IFS-NEMO-ER, ICON-ESM-ER) and CMIP6 models against ERA5 climatology. The IFS-based models demonstrate superior performance with relatively low biases globally, whereas ICON-ESM-ER and many CMIP6 models exhibit significant zonal errors, particularly in the Southern Hemisphere westerlies.
Key Findings
- ICON-ESM-ER exhibits a severe dipole bias in the Southern Ocean (strong positive bias ~45°S, strong negative bias ~60°S), indicating a marked equatorward shift and distortion of the Southern Hemisphere westerly jet.
- IFS-FESOM2-SR and IFS-NEMO-ER show remarkably low biases in the extra-tropics compared to ICON-ESM-ER and the CMIP6 Multi-Model Mean, correctly placing the latitude of the SH westerlies.
- All three high-resolution EERIE models (IFS and ICON variants) show a positive bias in the Arabian Sea, indicating an overestimated Somali Jet intensity during the Indian Summer Monsoon compared to ERA5.
- In the tropical Pacific, ICON-ESM-ER shows strong negative biases (excessive easterlies), while IFS models show mild positive biases (weaker easterlies).
Spatial Patterns
The most dominant error pattern is a zonal dipole in the Southern Hemisphere (positive bias mid-latitudes, negative bias high-latitudes) representing an equatorward jet shift, which is extreme in ICON-ESM-ER but present in the CMIP6 MMM. Tropical biases show a distinction between Atlantic/East Pacific (too strong easterlies in ICON) and West Pacific (mixed).
Model Agreement
The two IFS-based simulations (coupled to FESOM2 and NEMO) show high agreement with each other and generally outperform the CMIP6 ensemble. ICON-ESM-ER is a notable outlier with much larger bias magnitudes, resembling or exceeding the errors seen in some lower-resolution CMIP6 models like ACCESS-ESM1-5.
Physical Interpretation
The SH westerly dipole bias is a classic systematic error in climate models ('equatorward bias'), often linked to insufficient resolution or cloud radiative feedbacks; the IFS models' success suggests their resolution or physics tuning effectively mitigates this. The excessive easterlies in ICON's tropical Pacific likely couple with cold SST biases (Bjerknes feedback). The strong Somali Jet bias in all high-res models suggests that increased topographic resolution might be channeling flow too efficiently or that monsoonal heating is overestimated.
Caveats
- Analysis is limited to JJA (Austral winter), when SH dynamic biases are typically most pronounced.
- Biases are relative to ERA5 reanalysis, which itself relies on an IFS-based model, potentially favoring IFS simulations slightly.
10m V Wind Annual Mean Bias
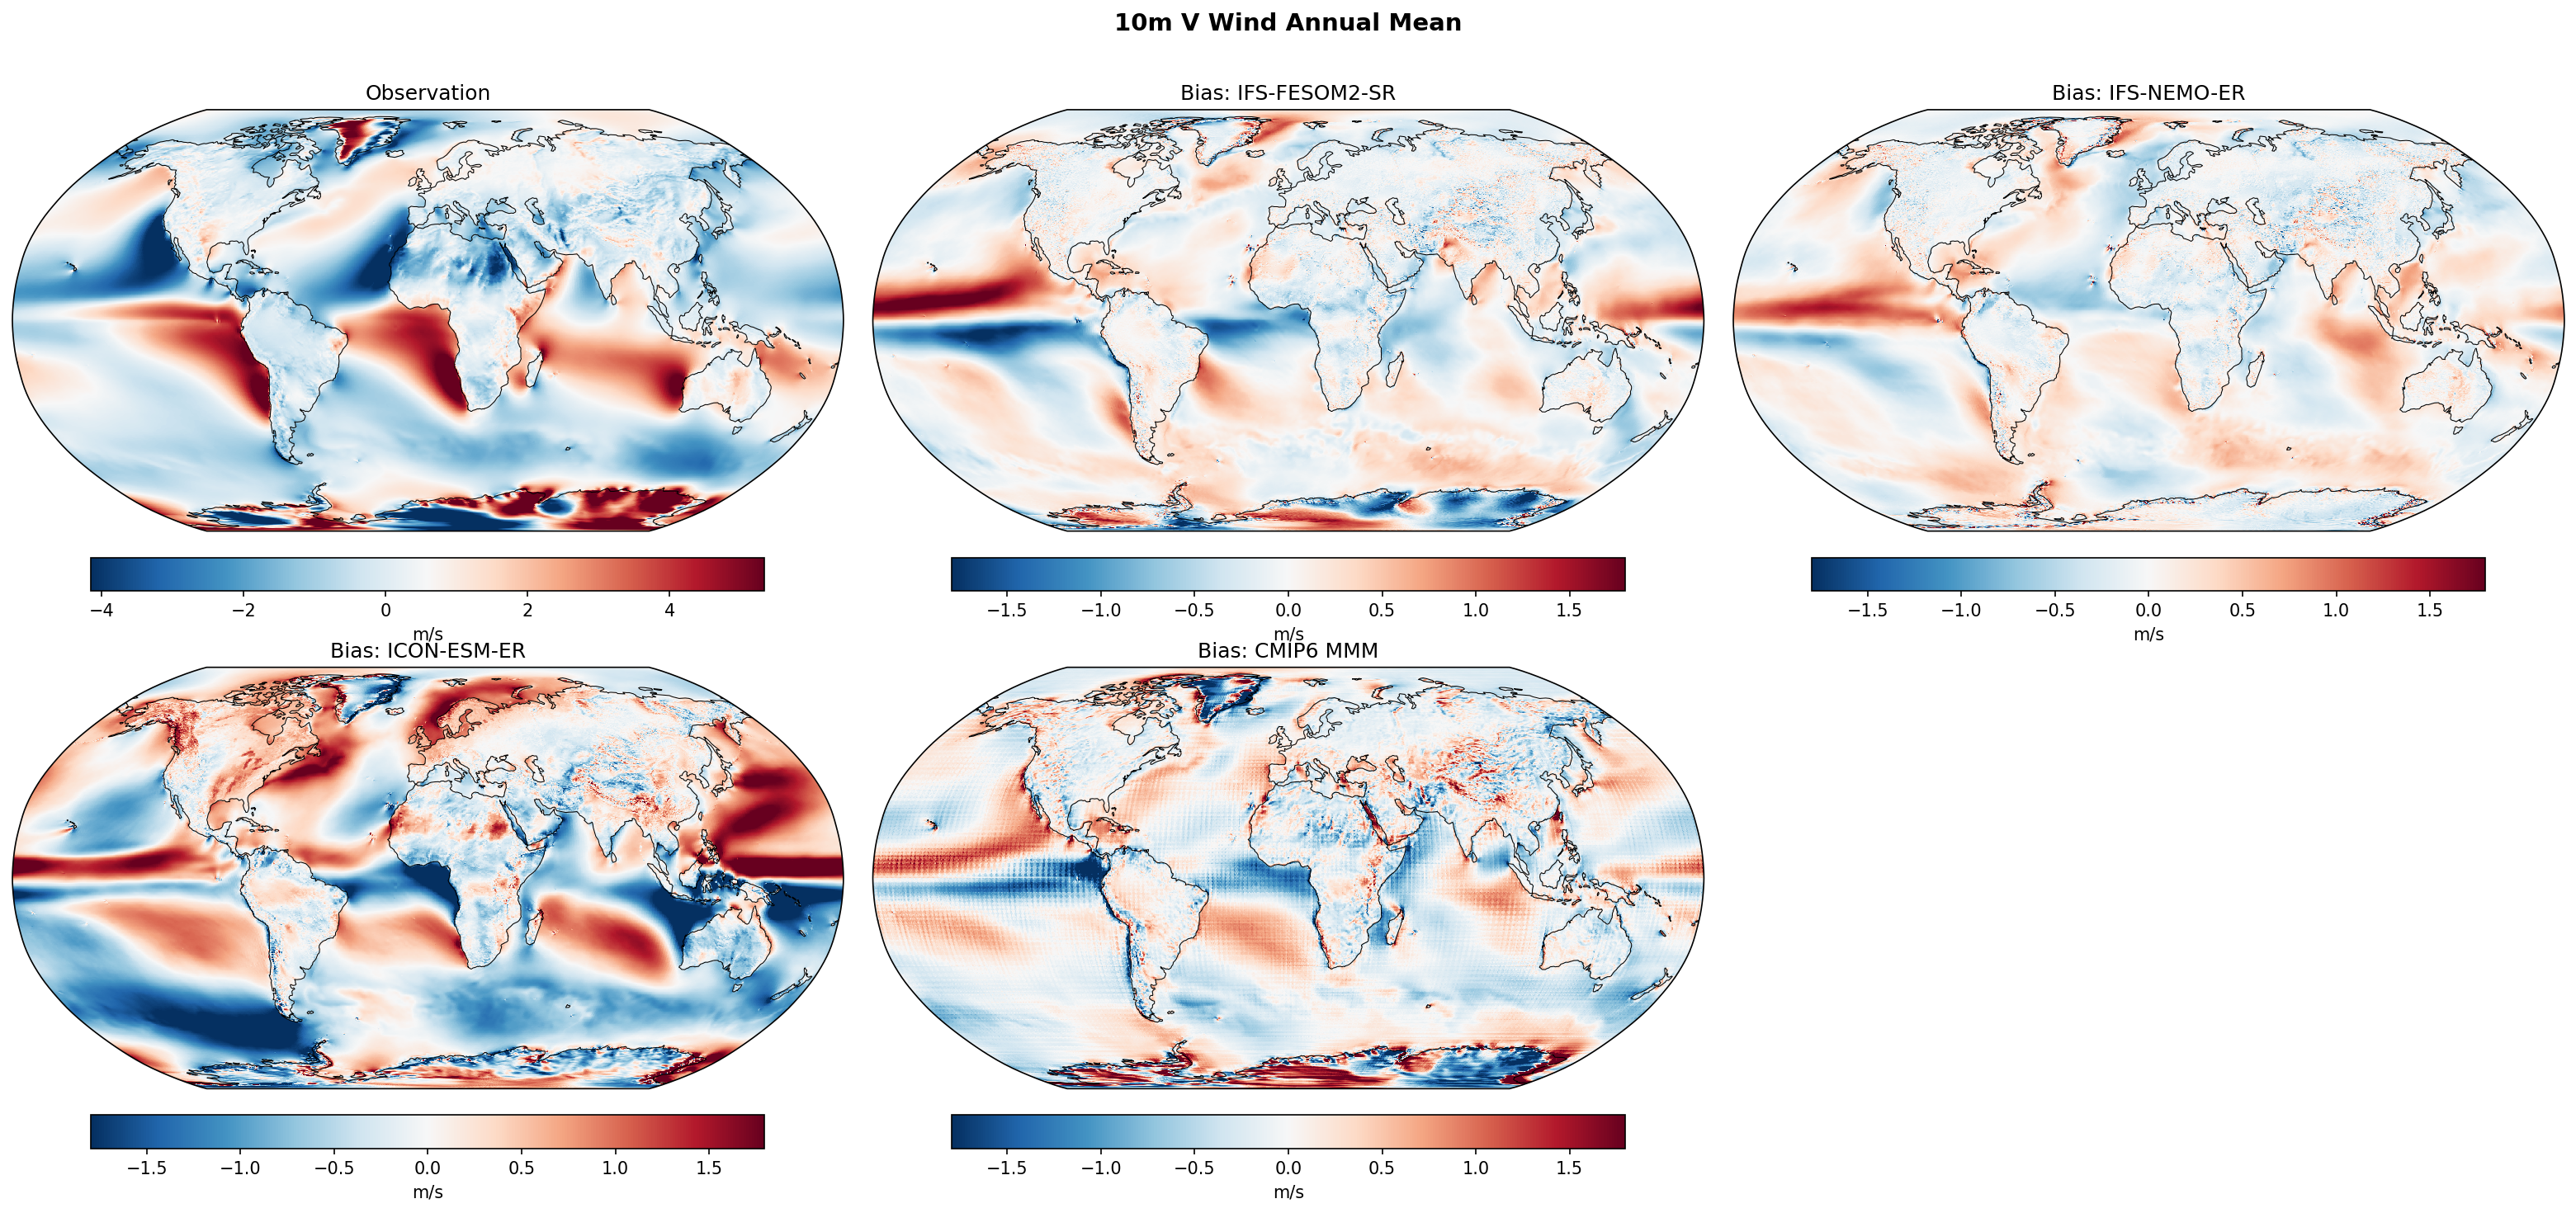
| Variables | vas |
|---|---|
| Models | IFS-FESOM2-SR, IFS-NEMO-ER, ICON-ESM-ER, CMIP6 MMM, MPI-ESM1-2-LR/r1i1p1f1, GISS-E2-1-G/r1i1p1f2, IPSL-CM6A-LR/r1i1p1f1, ACCESS-ESM1-5/r1i1p1f1, EC-Earth3/r1i1p1f1, CNRM-CM6-1/r1i1p1f2, AWI-CM-1-1-MR/r1i1p1f1, CNRM-ESM2-1/r1i1p1f2, INM-CM5-0/r1i1p1f1, MRI-ESM2-0/r1i1p1f1 |
| Reference Dataset | ERA5 |
| Units | m/s |
| Period | 1980–2014 |
| IFS-FESOM2-SR | Global Mean Bias: -0.01 · Rmse: 0.46 |
| IFS-NEMO-ER | Global Mean Bias: 0.03 · Rmse: 0.34 |
| ICON-ESM-ER | Global Mean Bias: -0.06 · Rmse: 0.85 |
| CMIP6 MMM | Global Mean Bias: -0.05 · Rmse: 0.54 |
| MPI-ESM1-2-LR/r1i1p1f1 | Global Mean Bias: -0.00 · Rmse: 0.75 |
| GISS-E2-1-G/r1i1p1f2 | Global Mean Bias: -0.11 · Rmse: 0.94 |
| IPSL-CM6A-LR/r1i1p1f1 | Global Mean Bias: 0.01 · Rmse: 0.68 |
| ACCESS-ESM1-5/r1i1p1f1 | Global Mean Bias: -0.09 · Rmse: 0.70 |
| EC-Earth3/r1i1p1f1 | Global Mean Bias: -0.10 · Rmse: 0.52 |
| CNRM-CM6-1/r1i1p1f2 | Global Mean Bias: -0.06 · Rmse: 0.63 |
| AWI-CM-1-1-MR/r1i1p1f1 | Global Mean Bias: 0.01 · Rmse: 0.66 |
| CNRM-ESM2-1/r1i1p1f2 | Global Mean Bias: -0.06 · Rmse: 0.63 |
| INM-CM5-0/r1i1p1f1 | Global Mean Bias: -0.06 · Rmse: 0.87 |
| MRI-ESM2-0/r1i1p1f1 | Global Mean Bias: -0.04 · Rmse: 0.89 |
Summary high
This diagnostic evaluates annual mean meridional (10m V) wind biases against ERA5. The high-resolution IFS-NEMO-ER model demonstrates superior performance with minimal global bias (RMSE 0.34 m/s), significantly outperforming both the CMIP6 ensemble and the high-resolution ICON-ESM-ER, which exhibits severe zonal and tropical circulation errors.
Key Findings
- IFS-NEMO-ER achieves the lowest global RMSE (0.34 m/s), effectively eliminating the large-scale systematic biases seen in CMIP6 models and ICON-ESM-ER.
- ICON-ESM-ER, despite its high resolution, performs poorly (RMSE 0.85 m/s), displaying strong zonal banding in the Southern Ocean and excessive southerly flow in the tropical Pacific, resembling the biases of lower-performing CMIP6 models like MRI-ESM2-0.
- IFS-FESOM2-SR performs well (RMSE 0.46 m/s) but introduces a distinct negative bias (excessive northerly flow) in the tropical North Atlantic trade wind region compared to the NEMO configuration.
- Most CMIP6 models and ICON-ESM-ER show dipolar bias patterns in the tropical Pacific, indicative of errors in ITCZ positioning and Hadley cell intensity.
Spatial Patterns
The IFS-NEMO-ER map is largely neutral (white). In contrast, ICON-ESM-ER shows a distinct negative bias band around 50°S and positive bias around 60°S in the Southern Ocean, suggesting a meridional shift in the westerlies. In the tropical Southeast Pacific, ICON and several CMIP6 models (e.g., GISS-E2-1-G, MRI-ESM2-0) display strong positive biases (red), indicating overly strong southerly trade winds flowing into the ITCZ.
Model Agreement
There is a stark divergence between the IFS family (high agreement with observations) and ICON-ESM-ER (poor agreement). EC-Earth3 (standard resolution) performs surprisingly well (RMSE 0.52 m/s), outperforming the high-res ICON and the CMIP6 MMM, suggesting that resolution alone does not guarantee correct surface circulation.
Physical Interpretation
The positive V-wind biases in the Southeast Pacific (seen in ICON and CMIP6) correspond to stronger-than-observed southerly cross-equatorial flow, a common symptom of the 'Double ITCZ' syndrome where the ITCZ is often too strong or displaced. The contrast between IFS-NEMO and IFS-FESOM suggests that ocean coupling (surface currents/temperature gradients) significantly influences atmospheric low-level winds. ICON's Southern Ocean dipole suggests a structural error in the placement of the Ferrel/Polar cell boundary.
Caveats
- The analysis is based on annual means, which may mask seasonal biases in ITCZ migration.
- RMSE values aggregate global errors; regional biases in key upwelling zones might be physically more significant than the global average suggests.
10m V Wind DJF Bias
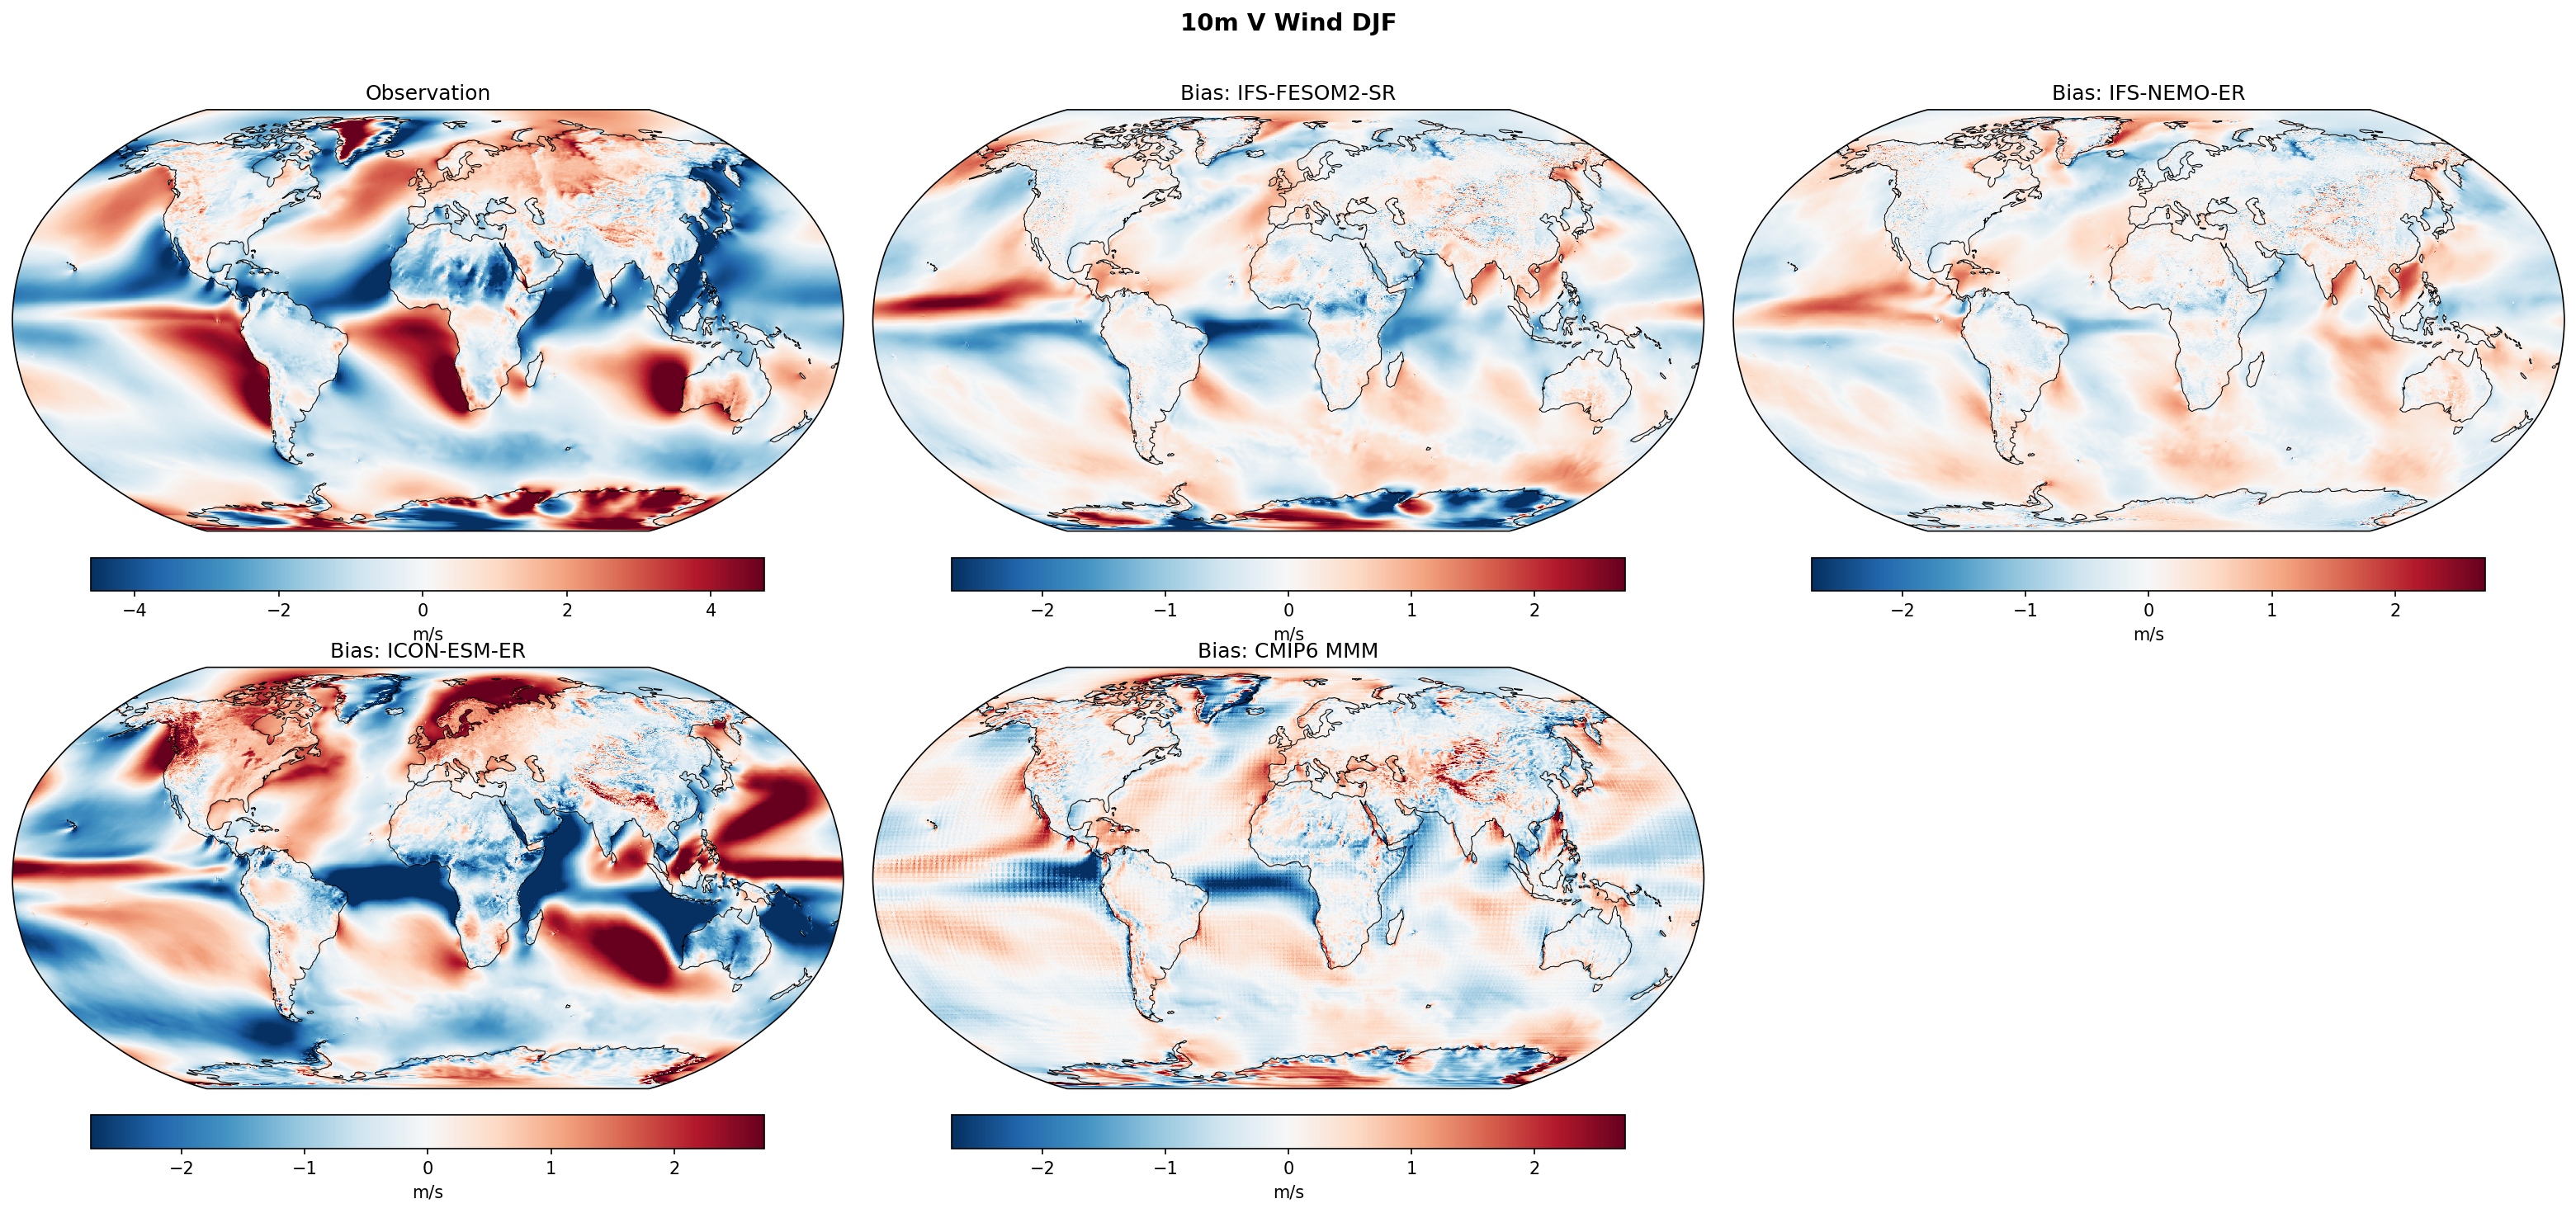
| Variables | vas |
|---|---|
| Models | IFS-FESOM2-SR, IFS-NEMO-ER, ICON-ESM-ER, CMIP6 MMM, MPI-ESM1-2-LR/r1i1p1f1, GISS-E2-1-G/r1i1p1f2, IPSL-CM6A-LR/r1i1p1f1, ACCESS-ESM1-5/r1i1p1f1, EC-Earth3/r1i1p1f1, CNRM-CM6-1/r1i1p1f2, AWI-CM-1-1-MR/r1i1p1f1, CNRM-ESM2-1/r1i1p1f2, INM-CM5-0/r1i1p1f1, MRI-ESM2-0/r1i1p1f1 |
| Reference Dataset | ERA5 |
| Units | m/s |
| Period | 1980–2014 |
| CMIP6 MMM | Global Mean Bias: -0.06 · Rmse: None |
| MPI-ESM1-2-LR/r1i1p1f1 | Global Mean Bias: -0.08 · Rmse: None |
| GISS-E2-1-G/r1i1p1f2 | Global Mean Bias: -0.09 · Rmse: None |
| IPSL-CM6A-LR/r1i1p1f1 | Global Mean Bias: 0.09 · Rmse: None |
| ACCESS-ESM1-5/r1i1p1f1 | Global Mean Bias: -0.07 · Rmse: None |
| EC-Earth3/r1i1p1f1 | Global Mean Bias: -0.13 · Rmse: None |
| CNRM-CM6-1/r1i1p1f2 | Global Mean Bias: -0.07 · Rmse: None |
| AWI-CM-1-1-MR/r1i1p1f1 | Global Mean Bias: -0.06 · Rmse: None |
| CNRM-ESM2-1/r1i1p1f2 | Global Mean Bias: -0.08 · Rmse: None |
| INM-CM5-0/r1i1p1f1 | Global Mean Bias: -0.00 · Rmse: None |
| MRI-ESM2-0/r1i1p1f1 | Global Mean Bias: -0.09 · Rmse: None |
Summary high
This figure evaluates the climatological bias of the 10m meridional wind (V component) in DJF for high-resolution EERIE models and a suite of CMIP6 models against ERA5 reanalysis. The IFS-based models demonstrate superior performance with lower bias magnitudes compared to ICON-ESM-ER and many standard-resolution CMIP6 models, though a systematic tropical bias persists across the ensemble.
Key Findings
- IFS-FESOM2-SR and IFS-NEMO-ER exhibit remarkably similar bias patterns with generally low magnitudes (+/- 1 m/s), confirming that atmospheric biases are primarily determined by the shared IFS atmospheric component rather than the ocean coupling.
- ICON-ESM-ER displays significantly stronger biases than the IFS models, characterized by intense dipolar structures in the tropics (exceeding +/- 2 m/s), particularly a strong southerly bias in the Indian Ocean and a cross-equatorial northerly anomaly in the Pacific.
- A systematic 'red-north / blue-south' bias dipole exists in the tropical Pacific across almost all models (including CMIP6 MMM), indicative of errors in the strength or position of the Intertropical Convergence Zone (ITCZ) trade wind convergence.
Spatial Patterns
The dominant spatial feature is a zonal dipole in the tropical Pacific: positive (southerly) bias north of the equator and negative (northerly) bias south of the equator. In the Southern Ocean, alternating zonal bands of bias suggest shifts in the standing wave patterns of the westerly jet. The North Atlantic shows regional dipoles consistent with displacements of the storm track.
Model Agreement
There is high agreement between the two IFS variants (FESOM/NEMO). There is also broad qualitative agreement across the multi-model ensemble regarding the sign of errors in the tropical Pacific (ITCZ issues), although magnitudes vary significantly. ICON-ESM-ER is an outlier among the high-res models with much stronger tropical circulation errors, resembling some of the poorer-performing CMIP6 models like GISS-E2-1-G.
Physical Interpretation
The persistent tropical Pacific dipole (positive bias where ERA5 shows northerly trades, negative bias where ERA5 shows southerly trades) indicates a weakening of the meridional trade wind convergence or a southward displacement of the ITCZ (often associated with the double-ITCZ bias). In ICON-ESM-ER, the strong negative bias crossing the equator suggests excessive northerly flow penetrating into the Southern Hemisphere, a clear symptom of a southward-shifted ITCZ.
Caveats
- Analysis is limited to the DJF season; seasonal migration of biases is not assessed.
- The provided summary statistics do not include the EERIE models (IFS/ICON), so comparisons rely on visual assessment of the bias maps.
10m V Wind JJA Bias
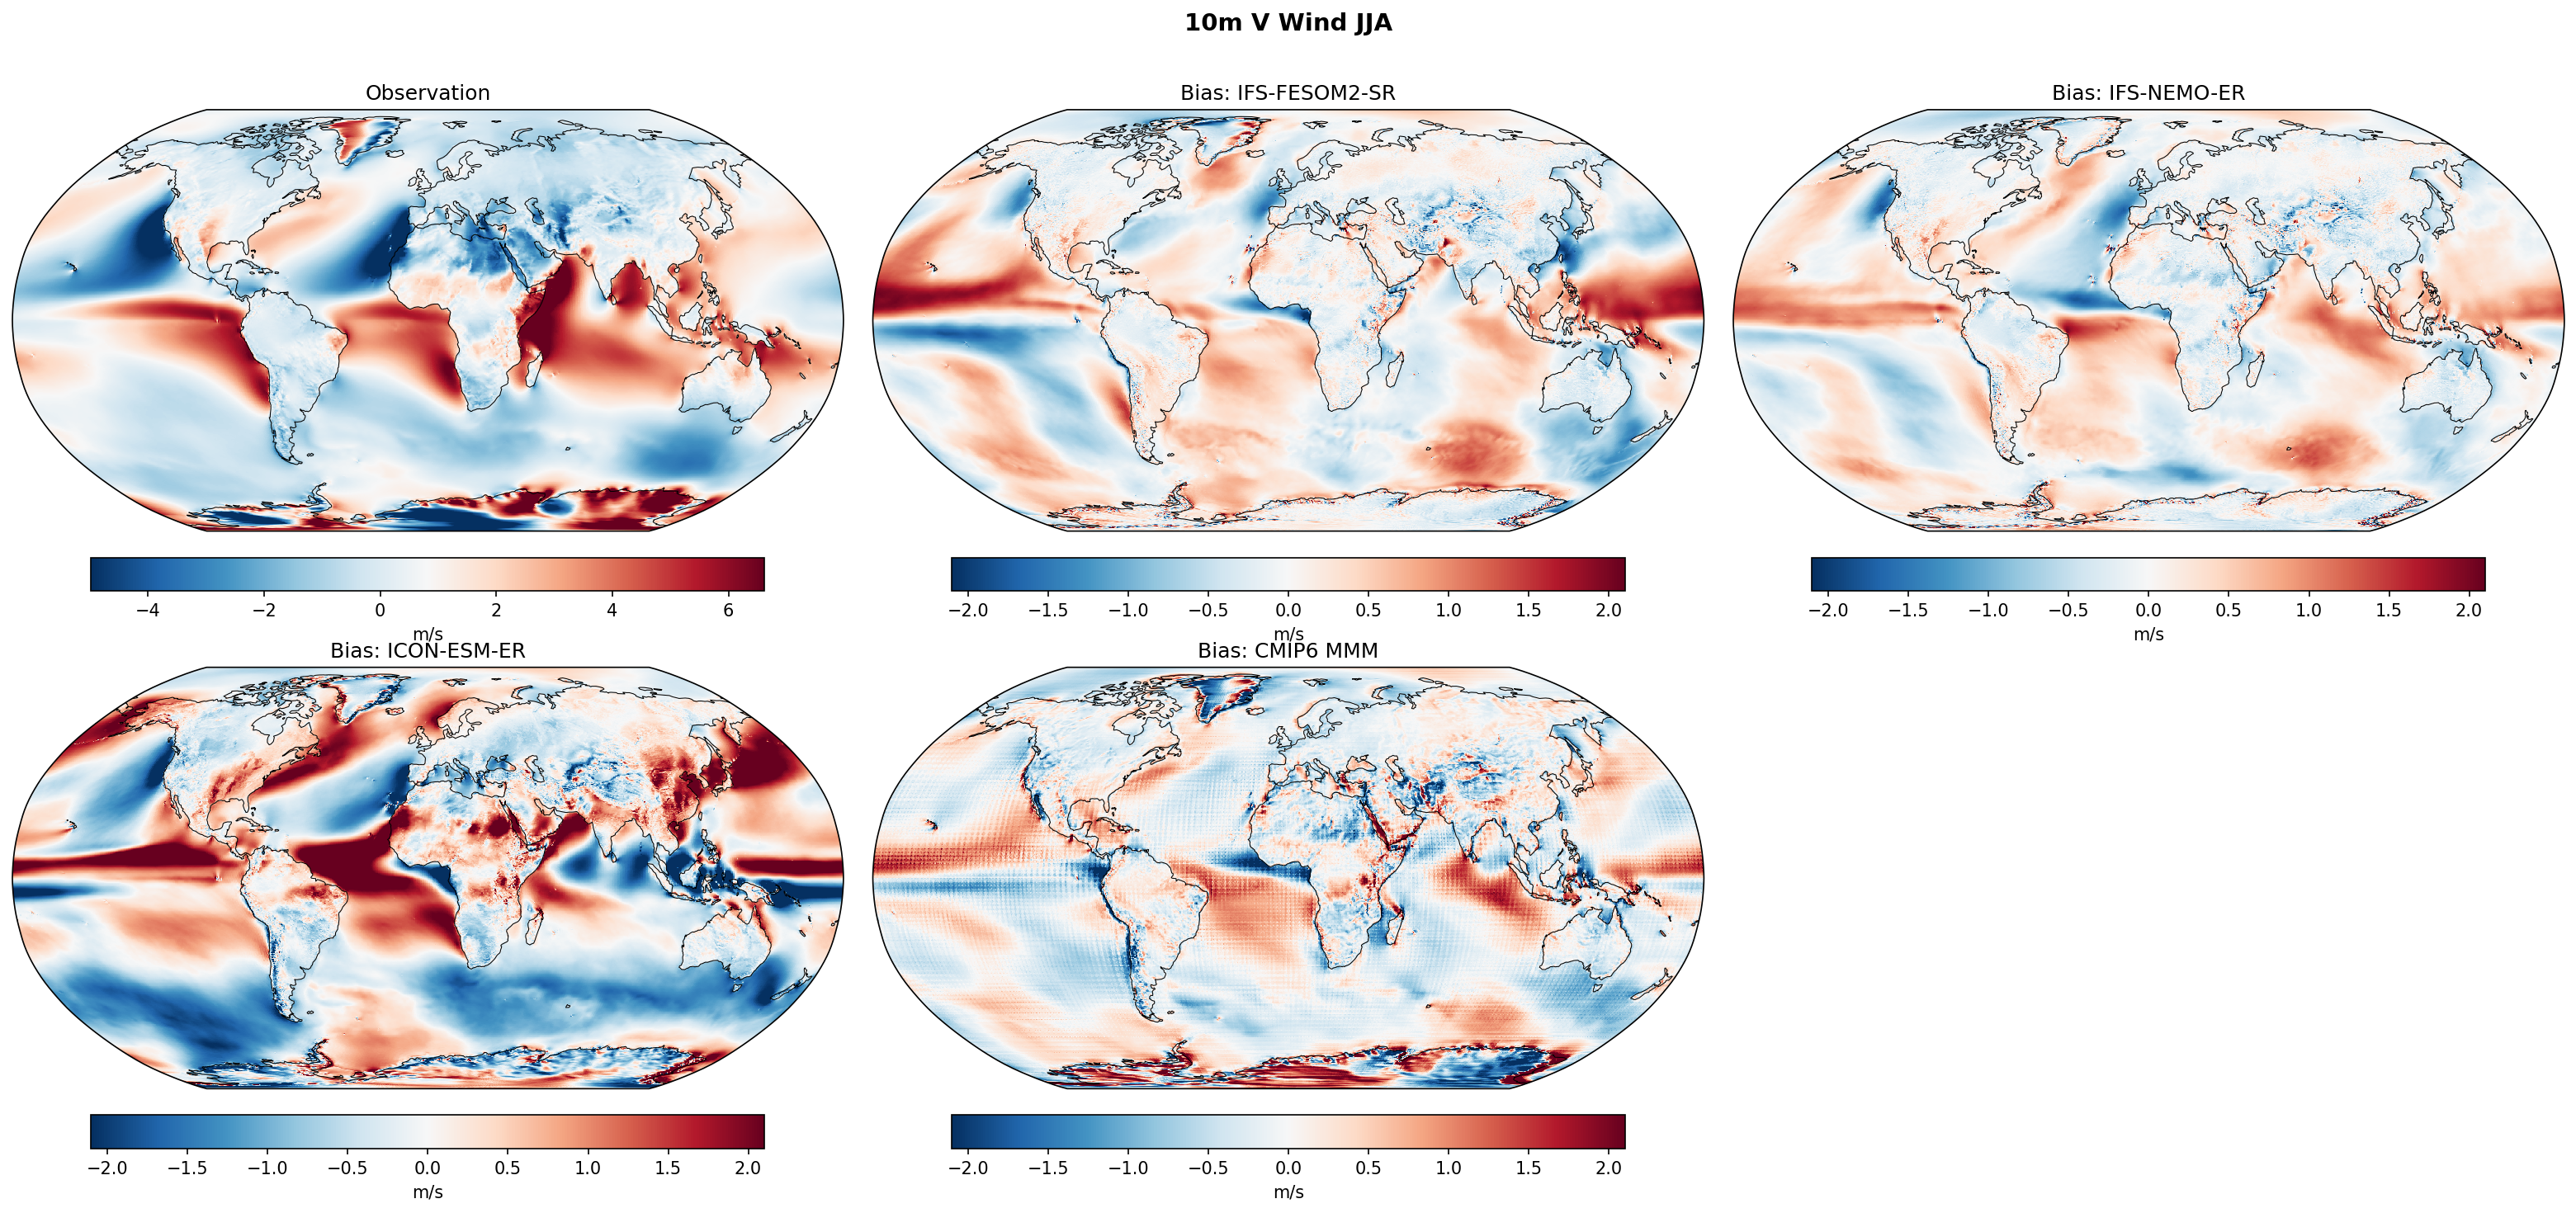
| Variables | vas |
|---|---|
| Models | IFS-FESOM2-SR, IFS-NEMO-ER, ICON-ESM-ER, CMIP6 MMM, MPI-ESM1-2-LR/r1i1p1f1, GISS-E2-1-G/r1i1p1f2, IPSL-CM6A-LR/r1i1p1f1, ACCESS-ESM1-5/r1i1p1f1, EC-Earth3/r1i1p1f1, CNRM-CM6-1/r1i1p1f2, AWI-CM-1-1-MR/r1i1p1f1, CNRM-ESM2-1/r1i1p1f2, INM-CM5-0/r1i1p1f1, MRI-ESM2-0/r1i1p1f1 |
| Reference Dataset | ERA5 |
| Units | m/s |
| Period | 1980–2014 |
| CMIP6 MMM | Global Mean Bias: -0.03 · Rmse: None |
| MPI-ESM1-2-LR/r1i1p1f1 | Global Mean Bias: 0.09 · Rmse: None |
| GISS-E2-1-G/r1i1p1f2 | Global Mean Bias: -0.11 · Rmse: None |
| IPSL-CM6A-LR/r1i1p1f1 | Global Mean Bias: -0.06 · Rmse: None |
| ACCESS-ESM1-5/r1i1p1f1 | Global Mean Bias: -0.08 · Rmse: None |
| EC-Earth3/r1i1p1f1 | Global Mean Bias: -0.04 · Rmse: None |
| CNRM-CM6-1/r1i1p1f2 | Global Mean Bias: -0.02 · Rmse: None |
| AWI-CM-1-1-MR/r1i1p1f1 | Global Mean Bias: 0.06 · Rmse: None |
| CNRM-ESM2-1/r1i1p1f2 | Global Mean Bias: -0.03 · Rmse: None |
| INM-CM5-0/r1i1p1f1 | Global Mean Bias: -0.12 · Rmse: None |
| MRI-ESM2-0/r1i1p1f1 | Global Mean Bias: 0.03 · Rmse: None |
Summary high
This diagnostic evaluates JJA 10m Meridional Wind biases relative to ERA5. The high-resolution IFS-based models (FESOM2-SR and NEMO-ER) exhibit notably smaller biases than ICON-ESM-ER and the CMIP6 ensemble, particularly in capturing the structure of the Somali Jet and tropical trade winds.
Key Findings
- IFS-FESOM2-SR and IFS-NEMO-ER display highly similar bias patterns and low magnitudes (pale colors), suggesting the atmospheric model component (IFS) dominates the surface wind skill regardless of the ocean coupler.
- ICON-ESM-ER shows significantly larger biases than the IFS models, characterized by a strong positive (northward) bias in the Tropical Atlantic and a negative (southward) bias in the Eastern Equatorial Pacific.
- The CMIP6 Multi-Model Mean (MMM) exhibits a characteristic dipole bias along the Somali Jet (negative coastal, positive offshore), indicative of resolution limits smearing the jet; high-res IFS models largely resolve the coastal core but overestimate intensity (broad positive bias).
Spatial Patterns
The most prominent feature is the Somali Jet in the Arabian Sea (Indian Monsoon), where most models show positive biases (too strong/broad). In the Southern Hemisphere, biases in the trade wind belts are common. ICON-ESM-ER displays a unique large-scale dipole between the Atlantic (positive bias) and Pacific (negative bias) basins in the tropics.
Model Agreement
There is exceptional agreement between the two IFS variants (FESOM2 vs NEMO), indicating robustness to ocean formulation. Agreement is low between IFS and ICON. The CMIP6 models show high inter-model variability, though many share zonal bias structures in the Southern Ocean.
Physical Interpretation
The Somali Jet biases reflect the challenge of resolving the narrow, topography-constrained low-level jet along East Africa; low-res models displace it offshore (dipole bias), while high-res models capture the position but may overestimate drag or intensity. The ICON tropical biases suggest potential errors in the Walker circulation or ITCZ positioning (e.g., Atlantic ITCZ displaced northward). Southern Ocean biases likely relate to latitudinal shifts in the westerly wind belt.
Caveats
- Analysis is restricted to JJA (monsoon season); biases may differ in DJF.
- 10m wind is a derived diagnostic sensitive to surface layer parameterization schemes which differ between models.