Evaluation Global Mean Time Series CMIP6
CMIP6 Multi-Model Mean Context
Comparison with CMIP6 ensemble mean from 11 members.
Contributing models: ACCESS-ESM1-5, AWI-CM-1-1-MR, CNRM-CM6-1, CNRM-ESM2-1, EC-Earth3, FGOALS-g3, GISS-E2-1-G, INM-CM5-0, IPSL-CM6A-LR, MPI-ESM1-2-LR, MRI-ESM2-0
Synthesis
Related diagnostics
Total Cloud Cover Global Mean Time Series
| Variables | clt |
|---|---|
| Models | IFS-FESOM2-SR, IFS-NEMO-ER, ICON-ESM-ER |
| Reference Dataset | ERA5 |
| Units | % |
| Period | 1980–2014 |
Summary high
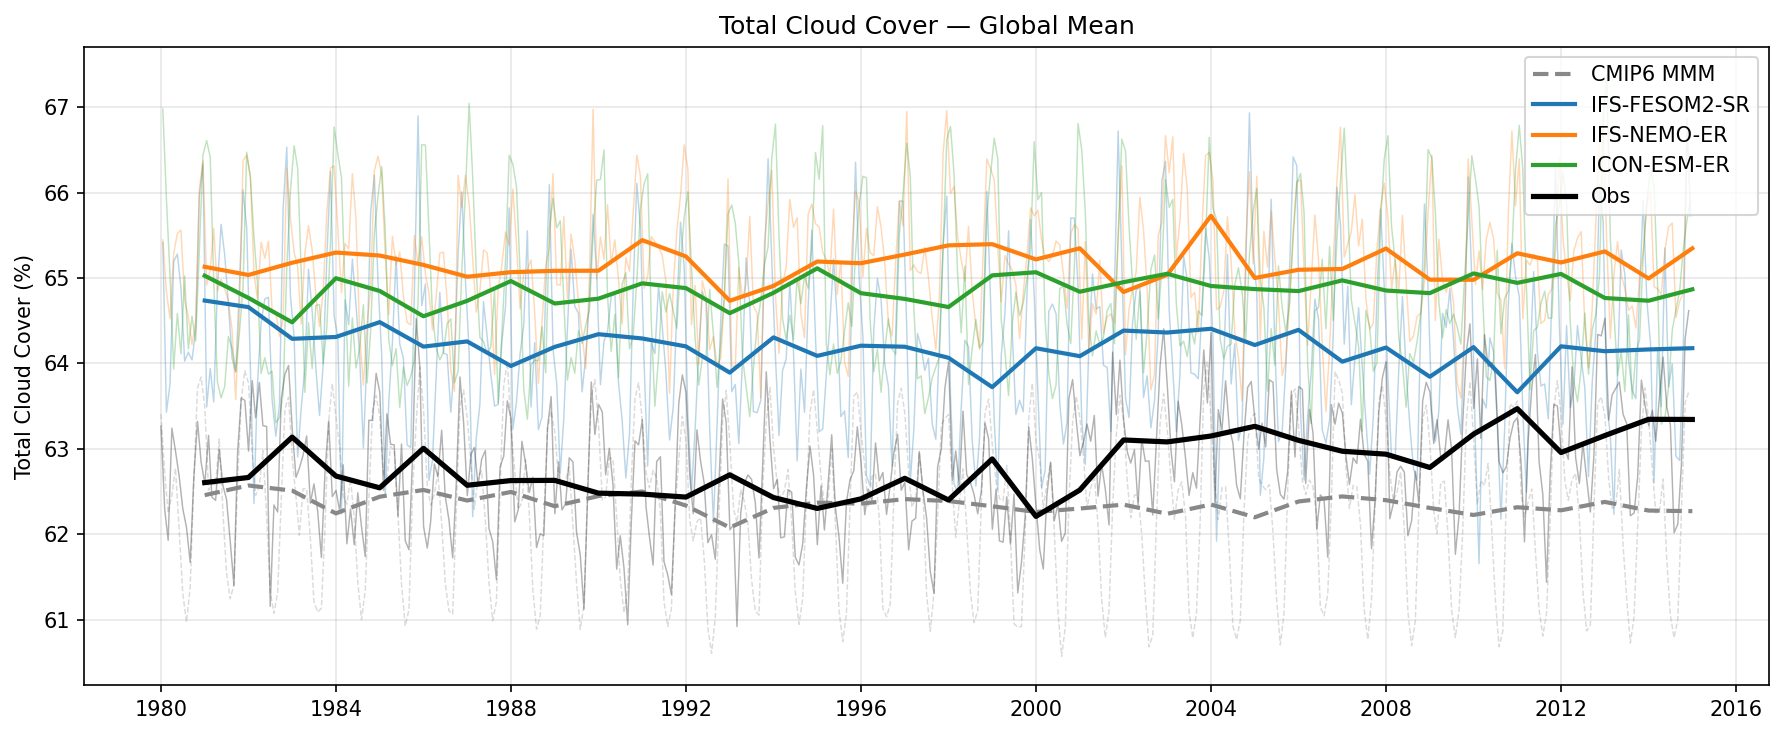
This time series shows global mean Total Cloud Cover (1980–2014) where all three high-resolution EERIE models exhibit a persistent positive bias of roughly 1.5–2.5% compared to ERA5 reanalysis, in contrast to the CMIP6 multi-model mean which lies slightly below observations.
Key Findings
- IFS-NEMO-ER has the highest global mean cloud cover (~65.2%), followed by ICON-ESM-ER (~64.9%) and IFS-FESOM2-SR (~64.2%), all notably higher than ERA5 (~62.8%).
- The CMIP6 Multi-Model Mean (dashed grey) consistently underestimates cloud cover relative to ERA5 (averaging ~62.3%), placing the high-resolution models in a distinct, higher-cloudiness regime compared to standard resolution models.
- Temporal stability is good across all simulations; there are no significant unphysical drifts, and the models reproduce the magnitude of interannual variability seen in ERA5.
Spatial Patterns
While this is a global mean time series, the temporal evolution is stable. A slight upward trend in ERA5 observations is visible post-2000 (rising from ~62.2% to ~63.3%), which is partially tracked by the models (e.g., IFS-FESOM2-SR), though model variability is generally flatter.
Model Agreement
The three high-resolution models cluster together with a positive bias, distinct from the CMIP6 MMM and ERA5. Among the high-res group, IFS-FESOM2-SR is the closest to observations. The disagreement between IFS-NEMO-ER and IFS-FESOM2-SR (which share the same atmospheric component) indicates significant coupling impacts.
Physical Interpretation
The systematic positive bias suggests that the high-resolution configurations may be tuned to be 'cloudier' or that resolved dynamics at this scale favor cloud formation (e.g., via convective detrainment or humidity distribution) more than standard CMIP6 resolutions. The ~1% difference between IFS-NEMO-ER and IFS-FESOM2-SR—despite sharing the OpenIFS atmosphere—highlights the role of air-sea coupling; differences in global mean SST or regional biases likely modulate the evaporation and stability required for cloud formation.
Caveats
- The observational reference is ERA5 reanalysis, which is model-derived; comparisons with satellite products (e.g., CERES, CLARA) might yield different absolute bias magnitudes due to sensor sensitivity and overlap assumptions.
- Total cloud cover is a diagnostic quantity highly sensitive to threshold definitions in models versus observation algorithms.
Surface Latent Heat Flux Global Mean Time Series
| Variables | hfls |
|---|---|
| Models | IFS-FESOM2-SR, IFS-NEMO-ER, ICON-ESM-ER |
| Reference Dataset | ERA5 |
| Units | W/m2 |
| Period | 1980–2014 |
Summary high
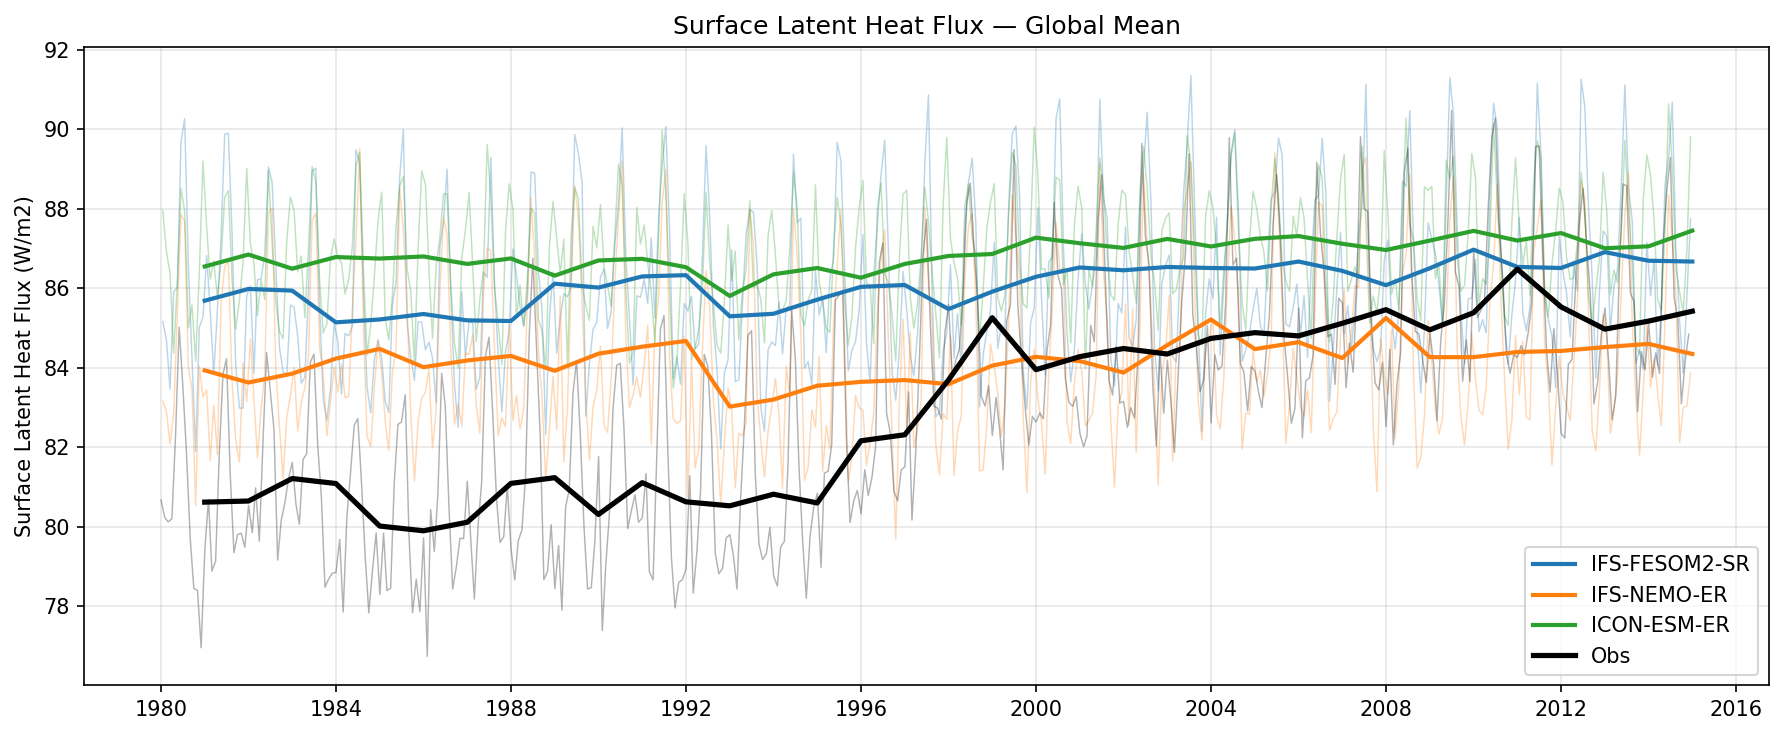
Time series analysis of global mean surface latent heat flux (1980–2014) for three high-resolution coupled models compared to ERA5 reanalysis.
Key Findings
- All three models exhibit a positive bias relative to ERA5, particularly in the pre-2000 period, with offsets ranging from +3 to +7 W/m².
- ERA5 shows a distinct, non-physical upward shift in latent heat flux starting around 1998 (increasing from ~80 to ~85 W/m²), significantly narrowing the gap with models in the post-2000 period.
- ICON-ESM-ER consistently simulates the highest flux (~87 W/m²), followed by IFS-FESOM2-SR (~86 W/m²) and IFS-NEMO-ER (~84 W/m²); the difference between IFS variants highlights the impact of the ocean component (FESOM vs NEMO) on surface fluxes.
- Models show stable or very gradually increasing trends, consistent with physical climate forcing, unlike the rapid stepwise increase seen in the reanalysis product.
Spatial Patterns
The primary feature is temporal: a divergence in trends between models (gradual/flat) and observations (steep increase/step-change).
Model Agreement
Models are relatively tightly clustered (spread of ~3 W/m²) and show high temporal correlation with each other regarding inter-annual variability, though they diverge significantly from the long-term trend of the ERA5 reanalysis.
Physical Interpretation
The strong trend in ERA5 is likely spurious, resulting from changes in the global observing system (e.g., assimilation of microwave satellite data starting in the late 90s) rather than physical climate change. Model values of 85-88 W/m² are actually closer to independent global energy budget estimates (often quoted ~88 W/m²) than the early ERA5 values (~80 W/m²), suggesting the 'bias' may be largely observational deficiency. The higher flux in IFS-FESOM2 compared to IFS-NEMO suggests warmer sea surface temperatures or different boundary layer coupling in the FESOM2 ocean configuration.
Caveats
- ERA5 is a reanalysis product and known to have spurious trends in surface fluxes due to observing system updates; it should not be treated as 'truth' for decadal trends.
- Global mean latent heat flux is difficult to constrain observationally; models may be closer to the true closed-budget value than the reanalysis indicates in the early period.
Surface Sensible Heat Flux Global Mean Time Series
| Variables | hfss |
|---|---|
| Models | IFS-FESOM2-SR, IFS-NEMO-ER, ICON-ESM-ER |
| Reference Dataset | ERA5 |
| Units | W/m2 |
| Period | 1980–2014 |
Summary high
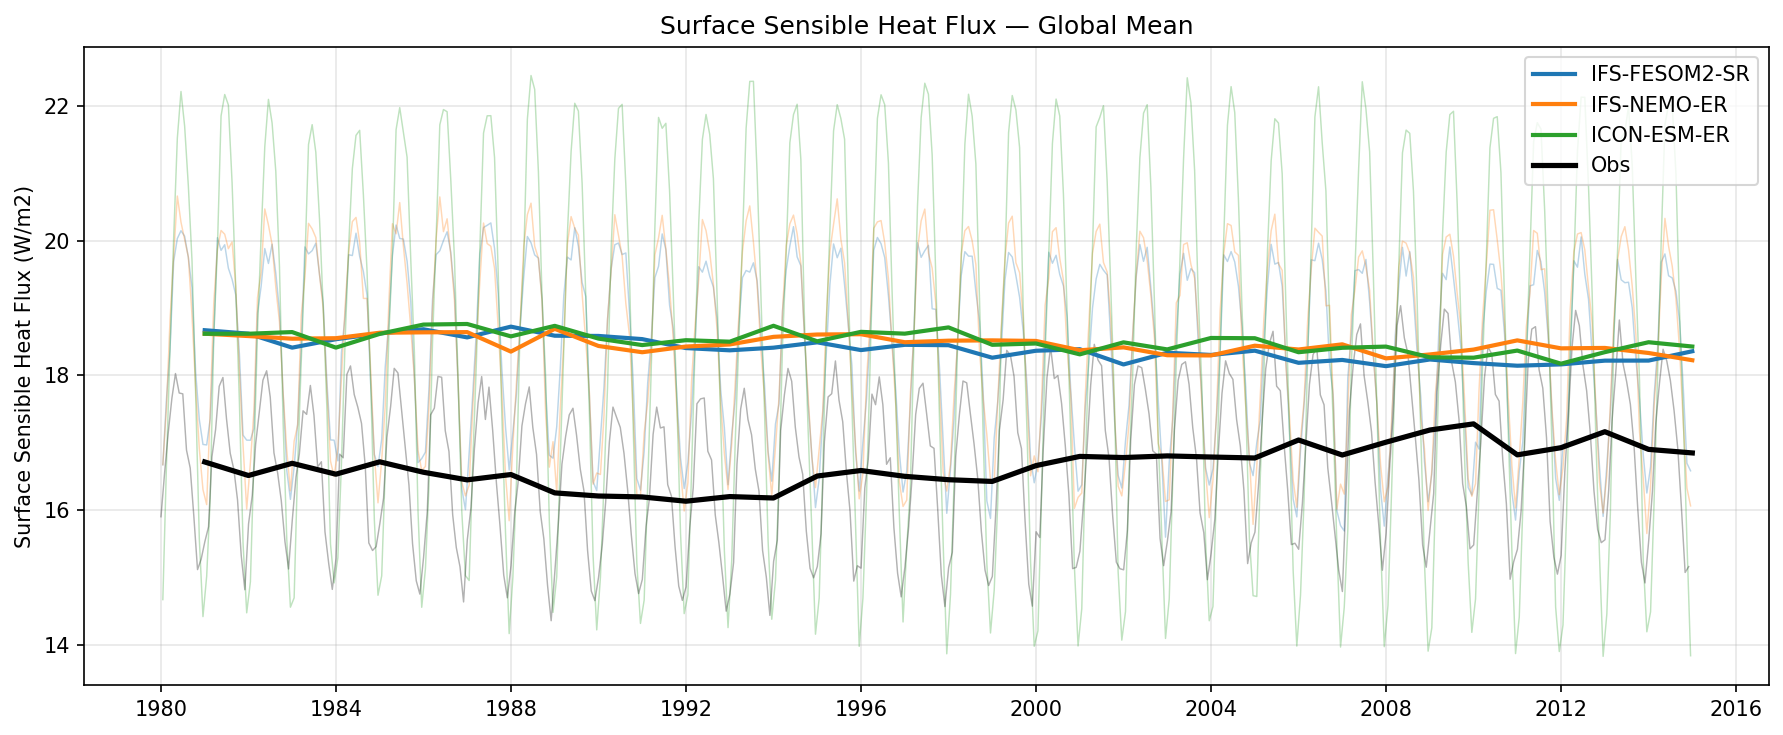
Time series analysis of global mean surface sensible heat flux (1980–2015) comparing three high-resolution coupled climate models against ERA5 reanalysis.
Key Findings
- All three models (IFS-FESOM2-SR, IFS-NEMO-ER, ICON-ESM-ER) exhibit a systematic positive bias of approximately 1.5–2.0 W/m² relative to the observational baseline (ERA5) throughout the simulation period.
- ICON-ESM-ER displays a significantly amplified seasonal cycle (ranging from ~14 to 22 W/m²) compared to both the IFS-based models and the observations, despite having a similar annual mean.
- The inter-model spread for annual means is very narrow (<0.5 W/m²), indicating strong structural agreement between the simulations despite the offset from reanalysis data.
Spatial Patterns
While this is a global mean time series, the temporal seasonal patterns reveal that ICON-ESM-ER has much stronger seasonal extremes (likely winter maxima/summer minima variances) compared to the IFS variants. The observational record shows a slight upward trend in sensible heat flux post-2000 that is not clearly captured by the flat trends of the free-running models.
Model Agreement
High inter-model agreement on the annual mean magnitude (clustering ~18.5 W/m²), but divergence in seasonal amplitude (ICON vs. IFS). Poor agreement with observations, as all models consistently overestimate the flux.
Physical Interpretation
The positive bias suggests that the coupled models either maintain a larger surface-to-air temperature gradient or simulate stronger surface winds/exchange coefficients than the ERA5 reanalysis. ICON's exaggerated seasonality may stem from its land-surface coupling or turbulence parameterizations (e.g., response to cold air outbreaks or stability functions) differing from the IFS physics package used in the other two models.
Caveats
- The 'Observation' is ERA5 reanalysis, which is a model-derived product; biases represent differences between free-running coupled simulations and the data-assimilated reanalysis system.
- As these are free-running coupled simulations, interannual phases (e.g., ENSO years) are not expected to match the historical timeline of the observations.
Total Precipitation Rate Global Mean Time Series
| Variables | pr |
|---|---|
| Models | IFS-FESOM2-SR, IFS-NEMO-ER, ICON-ESM-ER |
| Reference Dataset | ERA5 |
| Units | kg/m2/s |
| Period | 1980–2014 |
Summary high
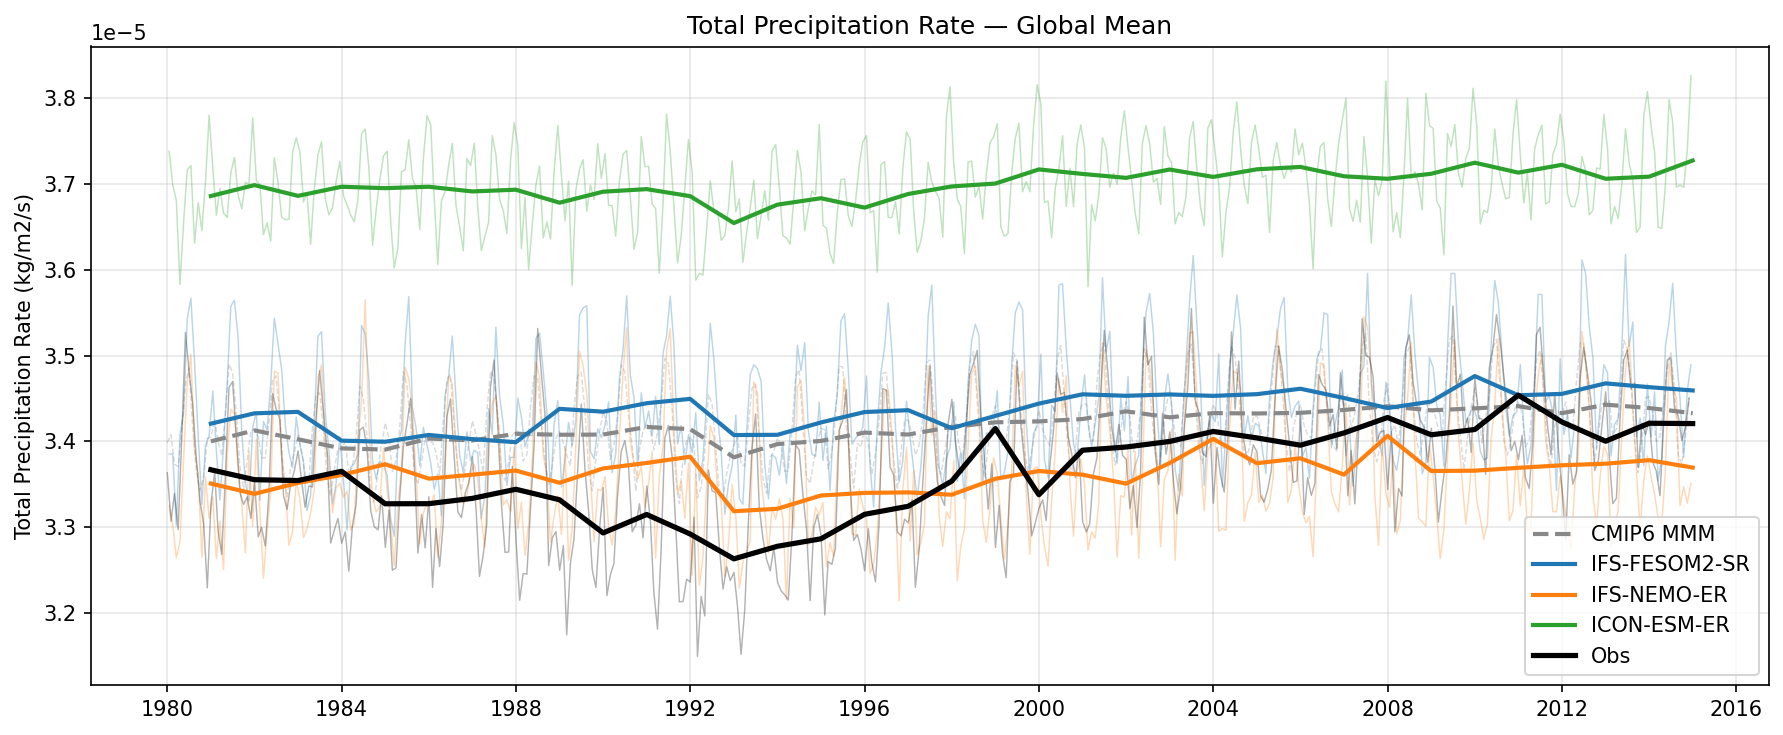
This time series compares the global mean total precipitation rate (1980–2014) of three high-resolution coupled models against ERA5 reanalysis and the CMIP6 multi-model mean.
Key Findings
- ICON-ESM-ER exhibits a significant positive bias ('wet bias'), maintaining a global mean precipitation rate (~3.7e-5 kg/m²/s) roughly 9-10% higher than observations and other models.
- IFS-NEMO-ER shows the closest agreement with ERA5 absolute magnitude during the 1980s and 1990s but underestimates the strong increasing trend seen in ERA5 from 2000 onwards.
- IFS-FESOM2-SR aligns very closely with the CMIP6 Multi-Model Mean (MMM) throughout the period, sitting slightly higher (~3.45e-5 kg/m²/s) than the observational baseline of the 1980s.
Spatial Patterns
A distinct reduction in global precipitation is visible across all datasets around 1992-1993, corresponding to the Mt. Pinatubo eruption. A prominent upward trend is observed in the ERA5 reanalysis starting around the late 1990s, which is not fully reproduced by the free-running models.
Model Agreement
There is a notable spread in mean state, with ICON-ESM-ER as a wet outlier. IFS-FESOM2-SR and the CMIP6 MMM cluster together, while IFS-NEMO-ER is the driest model. All models agree on the interannual variability phase (e.g., volcanic dips), indicating correct response to external forcings.
Physical Interpretation
The global precipitation rate is energetically constrained by the atmosphere's ability to radiate away latent heat. ICON's high bias suggests an overly vigorous hydrological cycle, possibly due to tuning or cloud physics parameterizations. The 1992 dip illustrates the suppression of the hydrological cycle due to volcanic aerosol cooling (solar dimming). The divergence in trends between ERA5 and models in the 21st century may stem from observing system changes affecting the reanalysis moisture budget or underestimated sensitivity in models.
Caveats
- ERA5 precipitation is a forecast product, not a direct observation, and its long-term trends can be influenced by changes in the assimilated satellite network (e.g., introduction of ATOVS).
- Global mean values mask potentially large regional compensations (e.g., ITCZ shifts).
Mean Sea Level Pressure Global Mean Time Series
| Variables | psl |
|---|---|
| Models | IFS-FESOM2-SR, IFS-NEMO-ER, ICON-ESM-ER |
| Reference Dataset | ERA5 |
| Units | Pa |
| Period | 1980–2014 |
Summary high
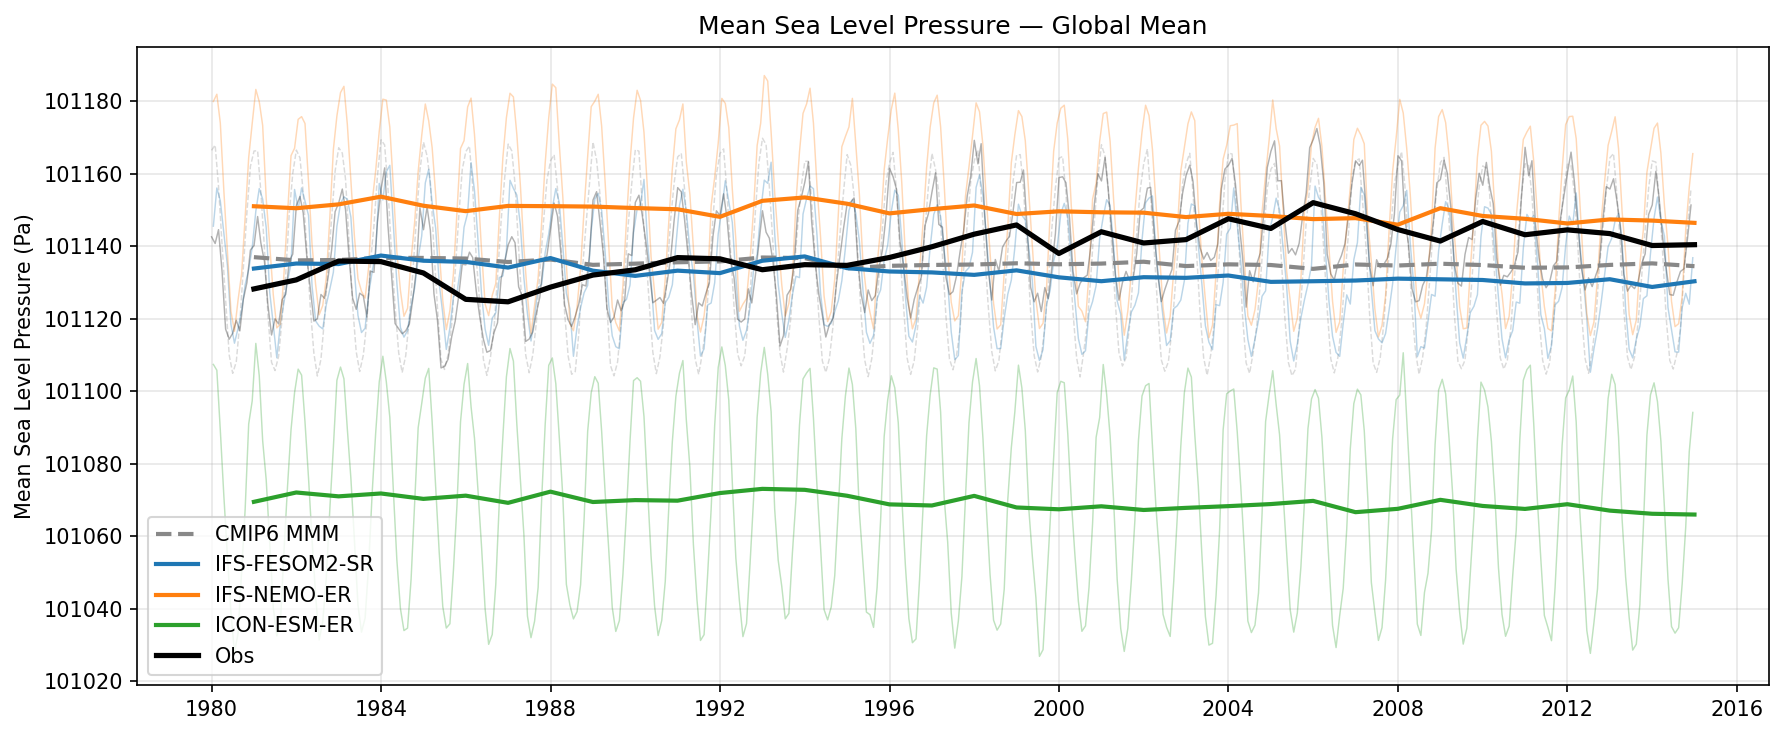
Time series analysis of global mean Mean Sea Level Pressure (MSLP) from 1980 to 2014 comparing three high-resolution coupled models against ERA5 reanalysis and the CMIP6 multi-model mean.
Key Findings
- Distinct static biases separate the models: IFS-NEMO-ER tracks highest (~1011.5 hPa), IFS-FESOM2-SR aligns well with the CMIP6 mean (~1011.35 hPa), and ICON-ESM-ER is significantly lower (~1010.7 hPa).
- ERA5 observations exhibit a noticeable upward trend and increased variability, particularly post-2000, increasing by approximately 15-20 Pa; this trend is absent in all simulation datasets.
- ICON-ESM-ER displays a noticeably larger amplitude in its seasonal cycle compared to the IFS models and the observational baseline.
Spatial Patterns
N/A (Global mean time series). Temporally, the observational dataset shows a drift that suggests a systematic increase in atmospheric mass or assimilation artifact not present in the free-running models.
Model Agreement
IFS-FESOM2-SR shows the best agreement with the CMIP6 multi-model mean and pre-2000 observations. ICON-ESM-ER is an outlier with a persistent negative bias of roughly 60-70 Pa relative to the ensemble mean.
Physical Interpretation
Global mean MSLP is a proxy for total atmospheric mass. The constant offsets between models likely stem from differences in initial total dry air mass settings or methodologies for reducing surface pressure to sea level over topography. The upward trend in ERA5 is often attributed to increasing atmospheric water vapor (mass) due to warming, though data assimilation inhomogeneities may contribute; the lack of trend in models suggests strict dry-mass conservation or weaker hydrological response.
Caveats
- Global mean MSLP is a derived quantity over land requiring extrapolation below topography; different reduction schemes can introduce biases.
- The trend in ERA5 may be influenced by changes in the assimilated observing system over time.
Surface Downwelling Longwave Global Mean Time Series
| Variables | rlds |
|---|---|
| Models | IFS-FESOM2-SR, IFS-NEMO-ER, ICON-ESM-ER |
| Reference Dataset | ERA5 |
| Units | W/m2 |
| Period | 1980–2014 |
Summary high
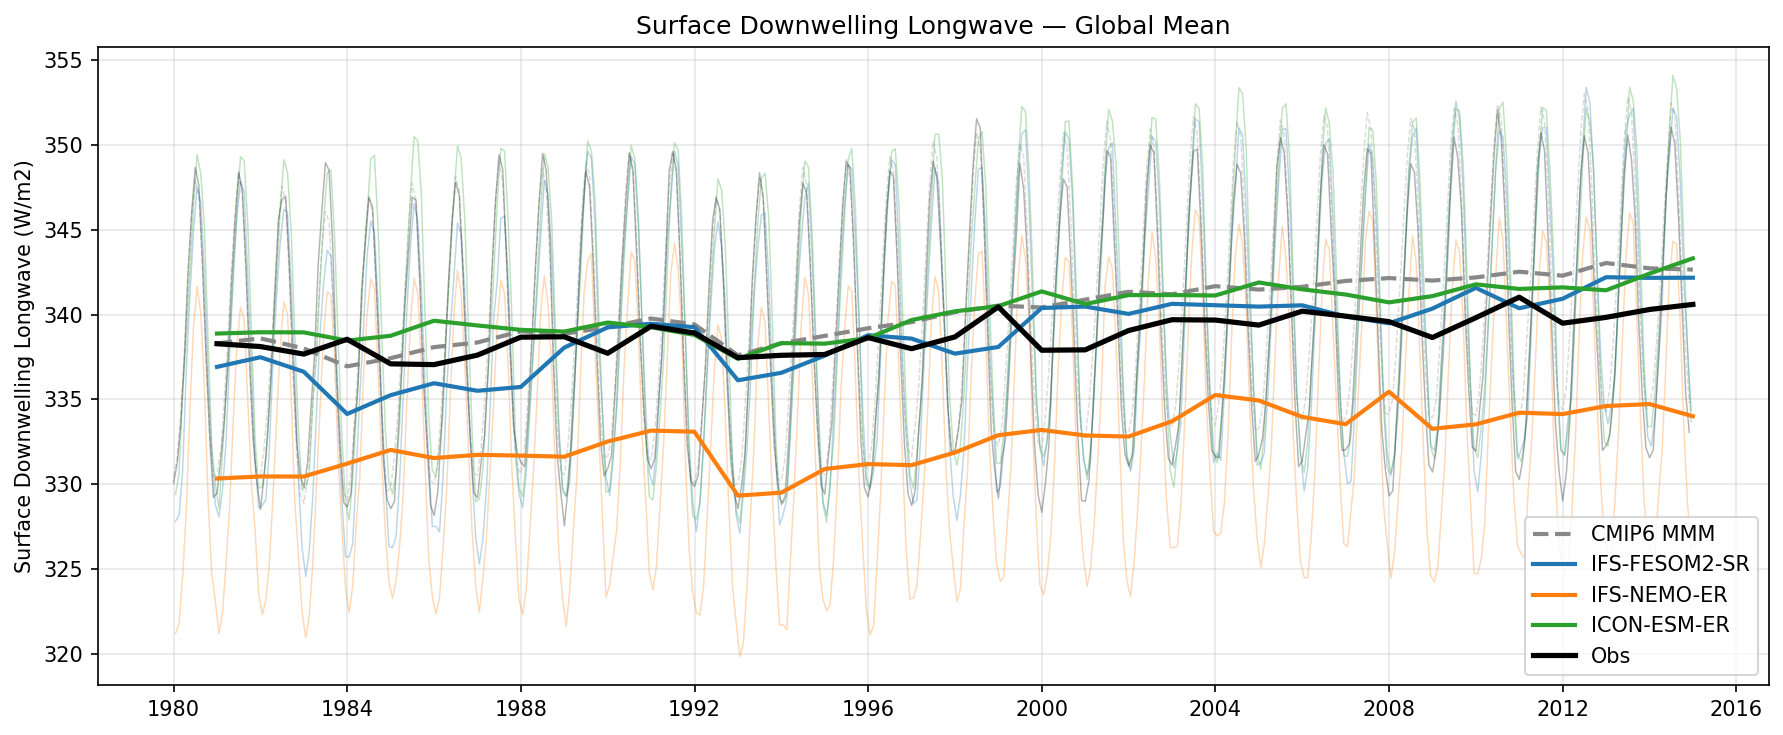
This time series shows the global mean surface downwelling longwave radiation (rlds) from 1980 to 2014 for three high-resolution models compared to ERA5 reanalysis and the CMIP6 multi-model mean.
Key Findings
- IFS-NEMO-ER exhibits a substantial systematic negative bias of approximately 6–8 W/m² relative to ERA5 throughout the period.
- ICON-ESM-ER tracks the CMIP6 multi-model mean (MMM) very closely, with both showing a positive bias of ~2–3 W/m² relative to ERA5.
- IFS-FESOM2-SR shows the closest absolute agreement with ERA5, crossing from a slight negative bias in the 1980s to a slight positive bias by the 2010s, implying a stronger trend than observed.
- All models and observations capture a distinct dip in downwelling longwave radiation around 1992, likely associated with the Mt. Pinatubo eruption.
Spatial Patterns
While spatially aggregated, the temporal pattern shows a clear increasing trend in all datasets, consistent with increasing greenhouse gas concentrations and atmospheric warming. A prominent variability feature is the drop in 1991-1993 (Pinatubo).
Model Agreement
There is significant divergence between the two IFS-based models (IFS-NEMO-ER and IFS-FESOM2-SR), with a separation of ~6-7 W/m², despite sharing similar atmospheric physics. ICON-ESM-ER aligns well with the CMIP6 ensemble mean.
Physical Interpretation
Surface downwelling longwave radiation is driven by lower-tropospheric temperature, water vapor content, and cloudiness. The large discrepancy between IFS-NEMO and IFS-FESOM likely stems from differences in the underlying ocean states; if IFS-NEMO has colder Sea Surface Temperatures (SSTs), this would reduce evaporation and atmospheric humidity, leading to reduced downwelling longwave. The general upward trend reflects the enhanced greenhouse effect and tropospheric warming. The 1992 dip corresponds to surface and tropospheric cooling following the Pinatubo eruption.
Caveats
- The observation standard used is ERA5 reanalysis, which itself relies on model physics and may have biases compared to direct satellite products like CERES.
- The large difference between IFS-NEMO and IFS-FESOM suggests strong sensitivity to ocean coupling or specific tuning configurations.
Surface Downwelling Shortwave Global Mean Time Series
| Variables | rsds |
|---|---|
| Models | IFS-FESOM2-SR, IFS-NEMO-ER, ICON-ESM-ER |
| Reference Dataset | ERA5 |
| Units | W/m2 |
| Period | 1980–2014 |
Summary high
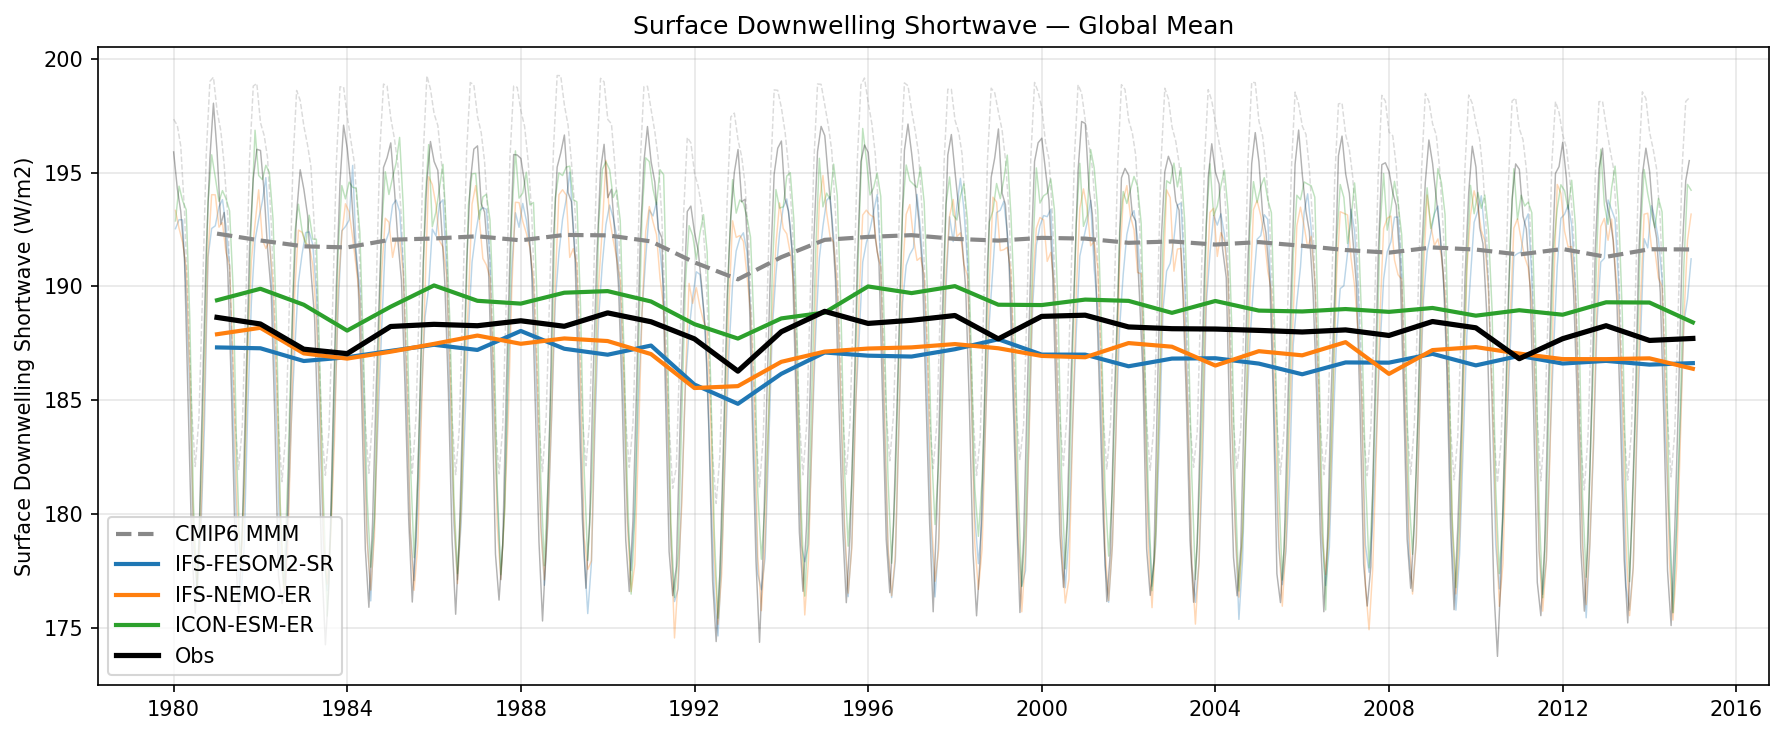
This time series analyzes global mean surface downwelling shortwave radiation (1980–2014), revealing that the high-resolution EERIE models generally outperform the CMIP6 Multi-Model Mean (MMM) in matching ERA5 reanalysis values.
Key Findings
- The CMIP6 MMM exhibits a systematic positive bias of approximately 3–4 W/m² relative to the observational baseline (ERA5).
- IFS-FESOM2-SR and IFS-NEMO-ER track nearly identically, slightly underestimating observations by ~0.5–1.0 W/m², indicating that the atmospheric component (IFS) dominates surface solar radiation irrespective of the ocean model.
- ICON-ESM-ER shows a small positive bias (~1–2 W/m²) but sits closer to observations than the CMIP6 MMM, effectively reducing the CMIP6 bias by half.
- All models clearly capture the transient reduction in surface shortwave radiation (~2–3 W/m²) associated with the 1991 Mt. Pinatubo eruption.
Spatial Patterns
The figure displays strong seasonal variability (indicated by the thin background lines) driven by the Earth's orbital eccentricity and hemispheric asymmetries in land/cloud cover. A notable interannual feature is the sharp decline in 1991–1993, corresponding to the Pinatubo volcanic dimming.
Model Agreement
There is high agreement between the two IFS-based simulations, suggesting ocean coupling (FESOM vs NEMO) has negligible impact on global mean downwelling shortwave. The high-resolution models (IFS and ICON) cluster closer to ERA5 than the coarser CMIP6 ensemble mean.
Physical Interpretation
The dip in the early 1990s confirms that all models are responding correctly to volcanic aerosol forcing (increasing atmospheric scattering/absorption). The persistent positive bias in CMIP6 and slight positive bias in ICON suggests these models may simulate slightly too little cloud cover or optically thinner clouds compared to ERA5 and the IFS configuration.
Caveats
- The observational reference is ERA5 reanalysis, which itself relies on a radiative transfer model and data assimilation, rather than direct satellite observations (e.g., CERES) which are only available for the latter part of the record.
- Global means can mask significant regional compensating biases (e.g., biases in stratus decks vs. deep convection).
2m Temperature Global Mean Time Series
| Variables | tas |
|---|---|
| Models | IFS-FESOM2-SR, IFS-NEMO-ER, ICON-ESM-ER |
| Reference Dataset | ERA5 |
| Units | K |
| Period | 1980–2014 |
Summary high
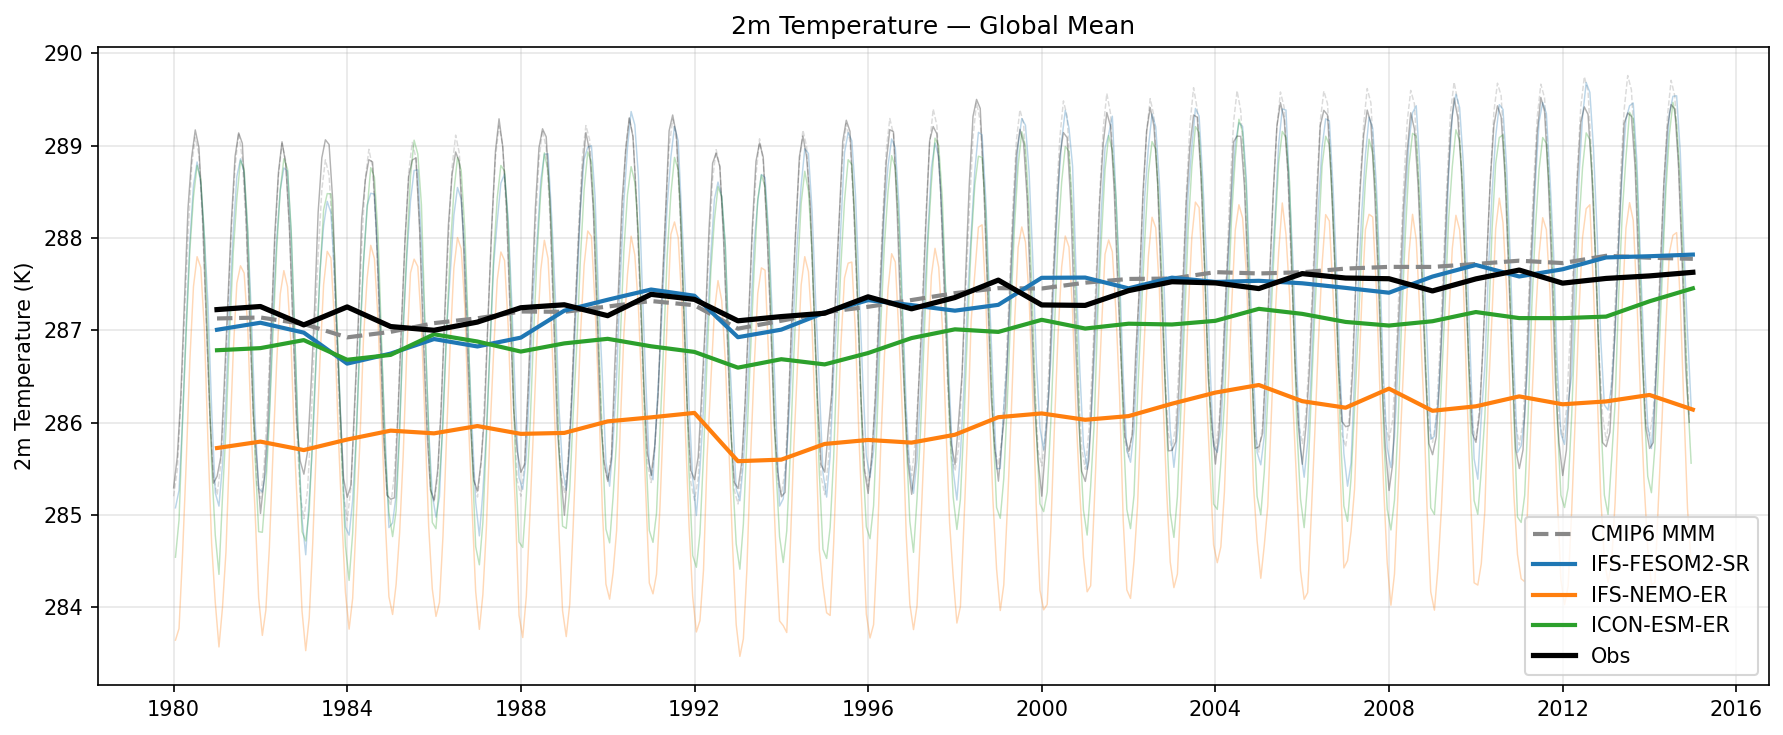
Time series analysis of global mean 2m temperature from 1980–2014 comparing three high-resolution models against ERA5 observations and the CMIP6 multi-model mean. The models capture the seasonal cycle and interannual variability but exhibit significant differences in their mean climate state.
Key Findings
- IFS-FESOM2-SR shows excellent agreement with observations (ERA5), tracking the global mean temperature magnitude and trend within ~0.1 K accuracy.
- IFS-NEMO-ER exhibits a severe systematic cold bias of approximately 1.5 K relative to observations throughout the entire period.
- ICON-ESM-ER shows a moderate systematic cold bias of roughly 0.5 K.
- All models capture major interannual variability events, such as the cooling following the 1991 Mt. Pinatubo eruption, and the long-term warming trend.
- The CMIP6 Multi-Model Mean (MMM) aligns well with observations, showing a slightly smoother warming trend that transitions from a slight cold bias in the 1980s to a slight warm bias by 2014.
Spatial Patterns
While this is a global mean time series, temporal patterns reveal synchronized seasonal cycles across all models. The interannual variability (e.g., 1998 El Niño, 1992 Pinatubo) is well-represented in phase across the ensemble, indicating correct transient forcing implementation.
Model Agreement
There is strong disagreement in the absolute mean state (offsets up to 1.5 K) but good agreement in the temporal evolution (trends and variability). IFS-FESOM2-SR is the best performer, aligning closely with ERA5. The divergence between IFS-FESOM2-SR and IFS-NEMO-ER is notable as they likely share the same atmospheric component, pointing to the ocean model or coupling as the source of the bias.
Physical Interpretation
The large cold bias in IFS-NEMO-ER compared to IFS-FESOM2-SR (which shares the IFS atmosphere) suggests that the ocean state (NEMO vs FESOM2) or sea-ice extent is driving a global cooling, possibly due to excessive ocean heat uptake or extensive sea ice increasing surface albedo. The synchronized dip around 1992 confirms that all models are responding to historical volcanic aerosol forcing.
Caveats
- Global mean values can mask significant compensating regional biases (e.g., a warm Arctic cancelling a cold tropic).
- The 1.5 K cold bias in IFS-NEMO-ER represents a significantly different climate state, which would impact process-level evaluations.
10m U Wind Global Mean Time Series
| Variables | uas |
|---|---|
| Models | IFS-FESOM2-SR, IFS-NEMO-ER, ICON-ESM-ER |
| Reference Dataset | ERA5 |
| Units | m/s |
| Period | 1980–2014 |
Summary high
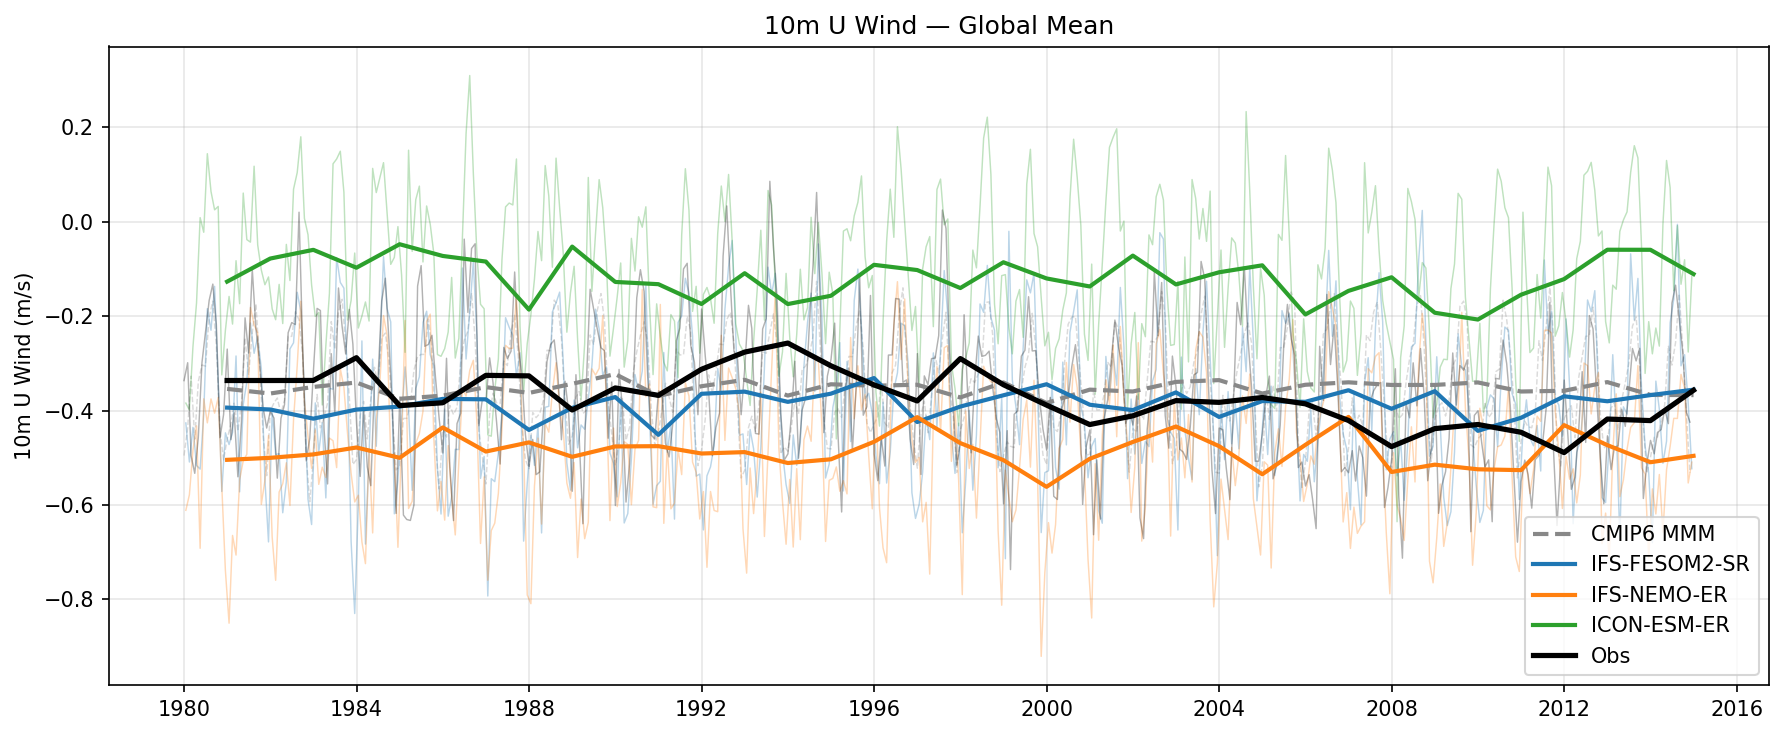
This time series compares global mean 10m zonal wind (U-component) across three high-resolution models against ERA5 observations and the CMIP6 multi-model mean (MMM). IFS-FESOM2-SR shows excellent agreement with observations, while ICON-ESM-ER and IFS-NEMO-ER exhibit systematic positive and negative biases, respectively.
Key Findings
- IFS-FESOM2-SR tracks ERA5 observations very closely, with a mean state around -0.4 m/s, matching the observational magnitude and variability almost perfectly.
- ICON-ESM-ER exhibits a distinct positive bias of approximately +0.2 m/s, indicating a global mean state that is too westerly (or insufficiently easterly) compared to reality.
- IFS-NEMO-ER displays a negative bias of roughly -0.15 m/s, suggesting a global flow that is too easterly compared to ERA5.
- Despite mean state offsets, all three models capture the phasing of interannual variability and multi-decadal trends seen in observations (e.g., the dip around 1998-2000 and 2008-2010).
- The CMIP6 MMM serves as a stable baseline that aligns closely with ERA5 and IFS-FESOM2-SR.
Spatial Patterns
While this is a global mean time series, the negative global mean values (-0.1 to -0.6 m/s) reflect the dominance of tropical easterlies (trade winds) over mid-latitude westerlies when area-weighted globally.
Model Agreement
There is significant spread in the mean state (up to 0.4 m/s difference between ICON and IFS-NEMO), but high agreement in the temporal variability. IFS-FESOM2-SR shows the best agreement with observations.
Physical Interpretation
Global mean 10m U wind is a residual metric balancing large tropical easterly zones against mid-latitude westerly zones. ICON's positive bias implies either weakened trade winds or strengthened/equatorward-shifted westerlies. The contrast between IFS-FESOM2-SR and IFS-NEMO-ER is notable as they share the same atmospheric component (IFS); the divergence suggests that differences in ocean coupling (e.g., SST patterns, sea ice extent, or surface current feedback on wind stress) significantly modulate the surface drag and resulting near-surface wind field.
Caveats
- Global mean quantities can mask compensating regional errors (e.g., too strong westerlies canceling too strong easterlies).
- The difference between IFS-NEMO and IFS-FESOM warrants investigation into surface stress coupling formulations.
10m V Wind Global Mean Time Series
| Variables | vas |
|---|---|
| Models | IFS-FESOM2-SR, IFS-NEMO-ER, ICON-ESM-ER |
| Reference Dataset | ERA5 |
| Units | m/s |
| Period | 1980–2014 |
Summary high
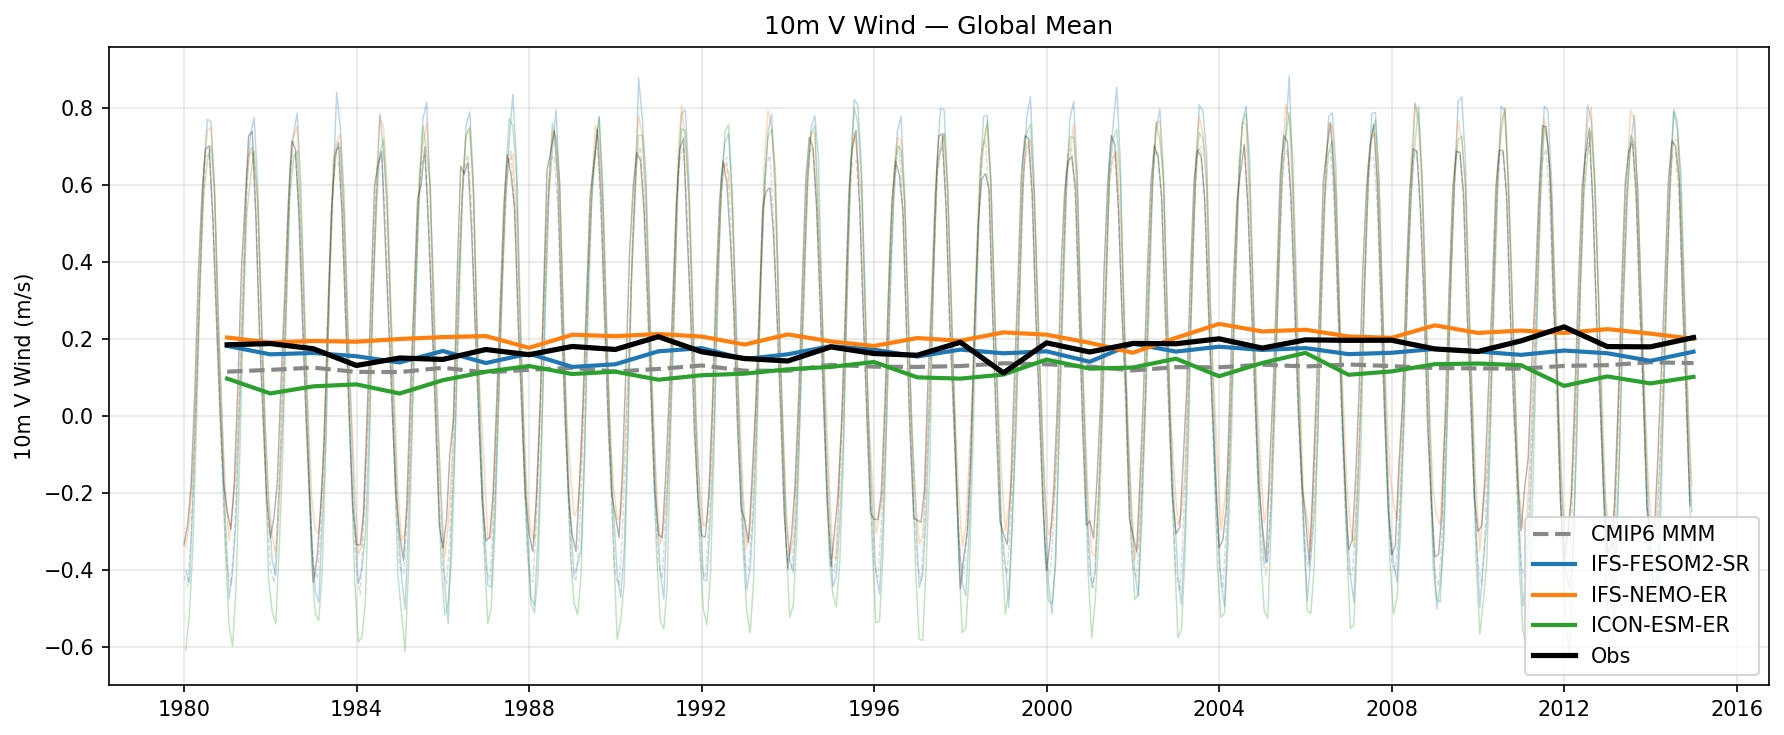
Time series analysis of global mean 10m meridional (V) wind from 1980–2014, comparing three high-resolution models against ERA5 reanalysis and the CMIP6 multi-model mean.
Key Findings
- IFS-NEMO-ER (orange) shows the closest agreement with ERA5 annual means, exhibiting a slight positive bias (~0.02 m/s above obs).
- ICON-ESM-ER (green) consistently underestimates the global mean V wind (annual mean ~0.1 m/s vs ERA5 ~0.18 m/s), driven by excessive negative excursions (southward flow) in the seasonal cycle.
- IFS-FESOM2-SR (blue) tracks ERA5 well, falling slightly below observations in the early period but aligning closely later.
- The CMIP6 Multi-Model Mean (grey dashed) shows a systematic low bias similar to ICON-ESM-ER, consistently sitting below the ERA5 baseline.
Spatial Patterns
The data is dominated by a strong, asymmetric seasonal cycle ranging roughly from -0.4 m/s to +0.8 m/s in observations. No significant long-term trend is visible in the annual means over the 35-year period for any dataset.
Model Agreement
All models capture the phase of the seasonal cycle accurately. The spread in annual means is roughly 0.1 m/s. The IFS-based models (NEMO and FESOM) cluster closer to the ERA5 reanalysis than the ICON model or the CMIP6 ensemble mean.
Physical Interpretation
Global mean surface meridional wind is a residual of large, opposing hemispheric circulation cells (Hadley/Ferrel). The positive global mean in ERA5 reflects hemispheric asymmetries in land-sea distribution and surface drag. The strong seasonality tracks the migration of the ITCZ and seasonal changes in trade wind strength. ICON's negative bias stems from deeper seasonal troughs (reaching -0.6 m/s vs Obs -0.4 m/s), indicating overly strong net southward surface flow during the relevant season (likely boreal winter/austral summer).
Caveats
- Global mean V wind is a small residual quantity, making it sensitive to subtle asymmetries in circulation strength.
- ERA5 is produced using an IFS model cycle, which may structurally favor agreement with the IFS-NEMO and IFS-FESOM simulations (model genealogy effect).