Ocean Surface Ocean SST Evaluation
Synthesis
Related diagnostics
SST Annual Mean Bias
| Variables | tos |
|---|---|
| Models | IFS-FESOM2-SR, IFS-NEMO-ER, ICON-ESM-ER |
| Reference Dataset | ESA-CCI L4 v3.0.1 |
| Units | K |
| Period | 1980–2014 |
| IFS-FESOM2-SR | Global Mean Bias: -0.06 · Rmse: 0.84 |
| IFS-NEMO-ER | Global Mean Bias: -0.92 · Rmse: 1.16 |
| ICON-ESM-ER | Global Mean Bias: -0.23 · Rmse: 1.66 |
Summary high
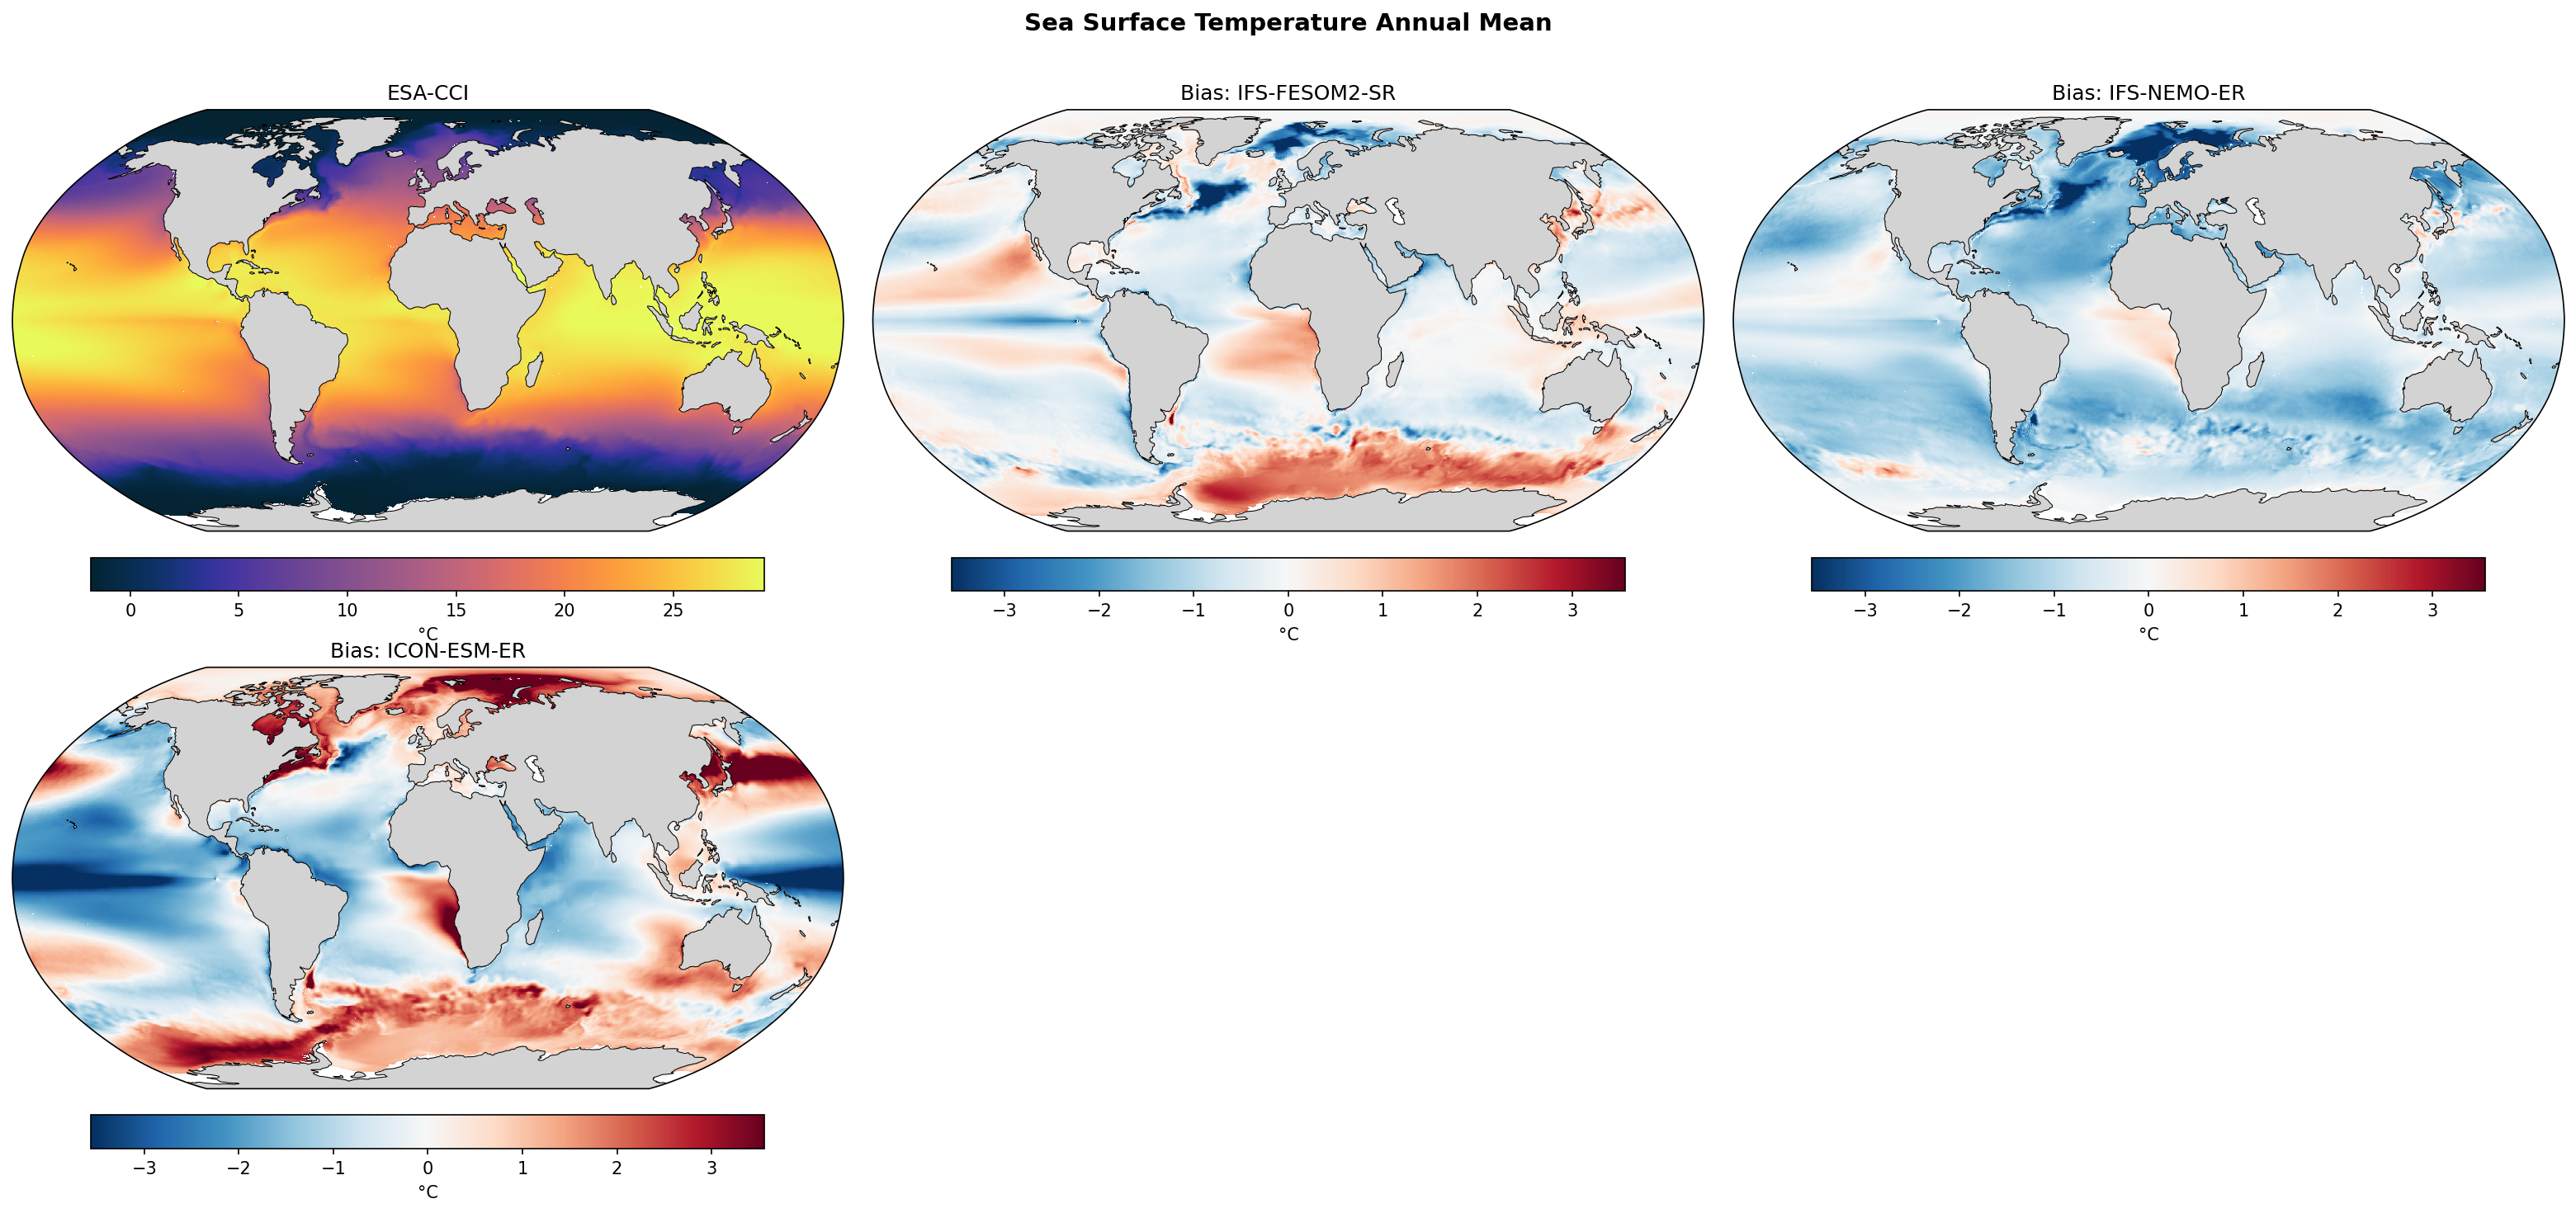
This figure evaluates annual mean Sea Surface Temperature (SST) biases in three coupled climate models relative to ESA-CCI satellite climatology. IFS-FESOM2-SR demonstrates the best agreement with observations (lowest RMSE), whereas IFS-NEMO-ER exhibits a systematic global cold bias and ICON-ESM-ER displays severe regional warm biases in upwelling zones and the Southern Ocean.
Key Findings
- IFS-FESOM2-SR has the lowest global RMSE (0.84 °C) and minimal global mean bias (-0.06 °C), though it shows a notable warm bias in the Southern Ocean and cold bias in the North Atlantic subpolar gyre.
- IFS-NEMO-ER is characterized by a pervasive, strong cold bias globally (mean -0.92 °C), most pronounced in the North Atlantic and North Pacific, with no major regions of warm bias.
- ICON-ESM-ER exhibits the highest spatial variance (RMSE 1.66 °C) with extreme warm biases (>3 °C) in eastern boundary upwelling systems (Humboldt, Benguela, California currents) and the Southern Ocean, contrasting with a cold bias in the equatorial Pacific.
Spatial Patterns
The North Atlantic subpolar gyre shows a 'cold blob' bias in both IFS variants, but a strong warm bias in ICON-ESM-ER. The Southern Ocean is too warm in IFS-FESOM2 and ICON (likely a cloud radiative issue) but neutral/cold in IFS-NEMO. ICON shows distinct, intense warm biases along the western coasts of the Americas and Africa, typical of poorly resolved coastal upwelling or stratocumulus decks.
Model Agreement
There is significant inter-model disagreement. The two IFS-based models diverge strongly in their mean state (NEMO being much colder than FESOM), suggesting the ocean component or coupling plays a dominant role over the shared atmosphere. ICON presents a completely different error topology with high-magnitude local biases.
Physical Interpretation
The Southern Ocean warm biases in FESOM and ICON are likely driven by insufficient shortwave reflection from clouds (too few supercooled liquid clouds). The extreme warm biases in ICON's eastern boundary currents suggest a failure to capture coastal upwelling dynamics or associated cloud decks, despite the 'Eddy-Rich' resolution. The systematic cooling in IFS-NEMO-ER points to a global energy imbalance or initialization drift, possibly related to vertical mixing parameterizations.
Caveats
- The color scale saturates at ±3°C, which likely hides the full magnitude of errors in ICON-ESM-ER's upwelling regions.
- IFS-FESOM2 is labeled 'SR' (Standard Resolution) while others are 'ER' (Eddy Rich), yet the SR model outperforms the ER models in bulk metrics, suggesting tuning or physics parameterization may outweigh pure resolution benefits here.
SST DJF Bias
| Variables | tos |
|---|---|
| Models | IFS-FESOM2-SR, IFS-NEMO-ER, ICON-ESM-ER |
| Reference Dataset | ESA-CCI L4 v3.0.1 |
| Units | K |
| Period | 1980–2014 |
| IFS-FESOM2-SR | Global Mean Bias: 0.06 · Rmse: 1.21 |
| IFS-NEMO-ER | Global Mean Bias: -0.94 · Rmse: 1.22 |
| ICON-ESM-ER | Global Mean Bias: -0.20 · Rmse: 2.00 |
Summary high
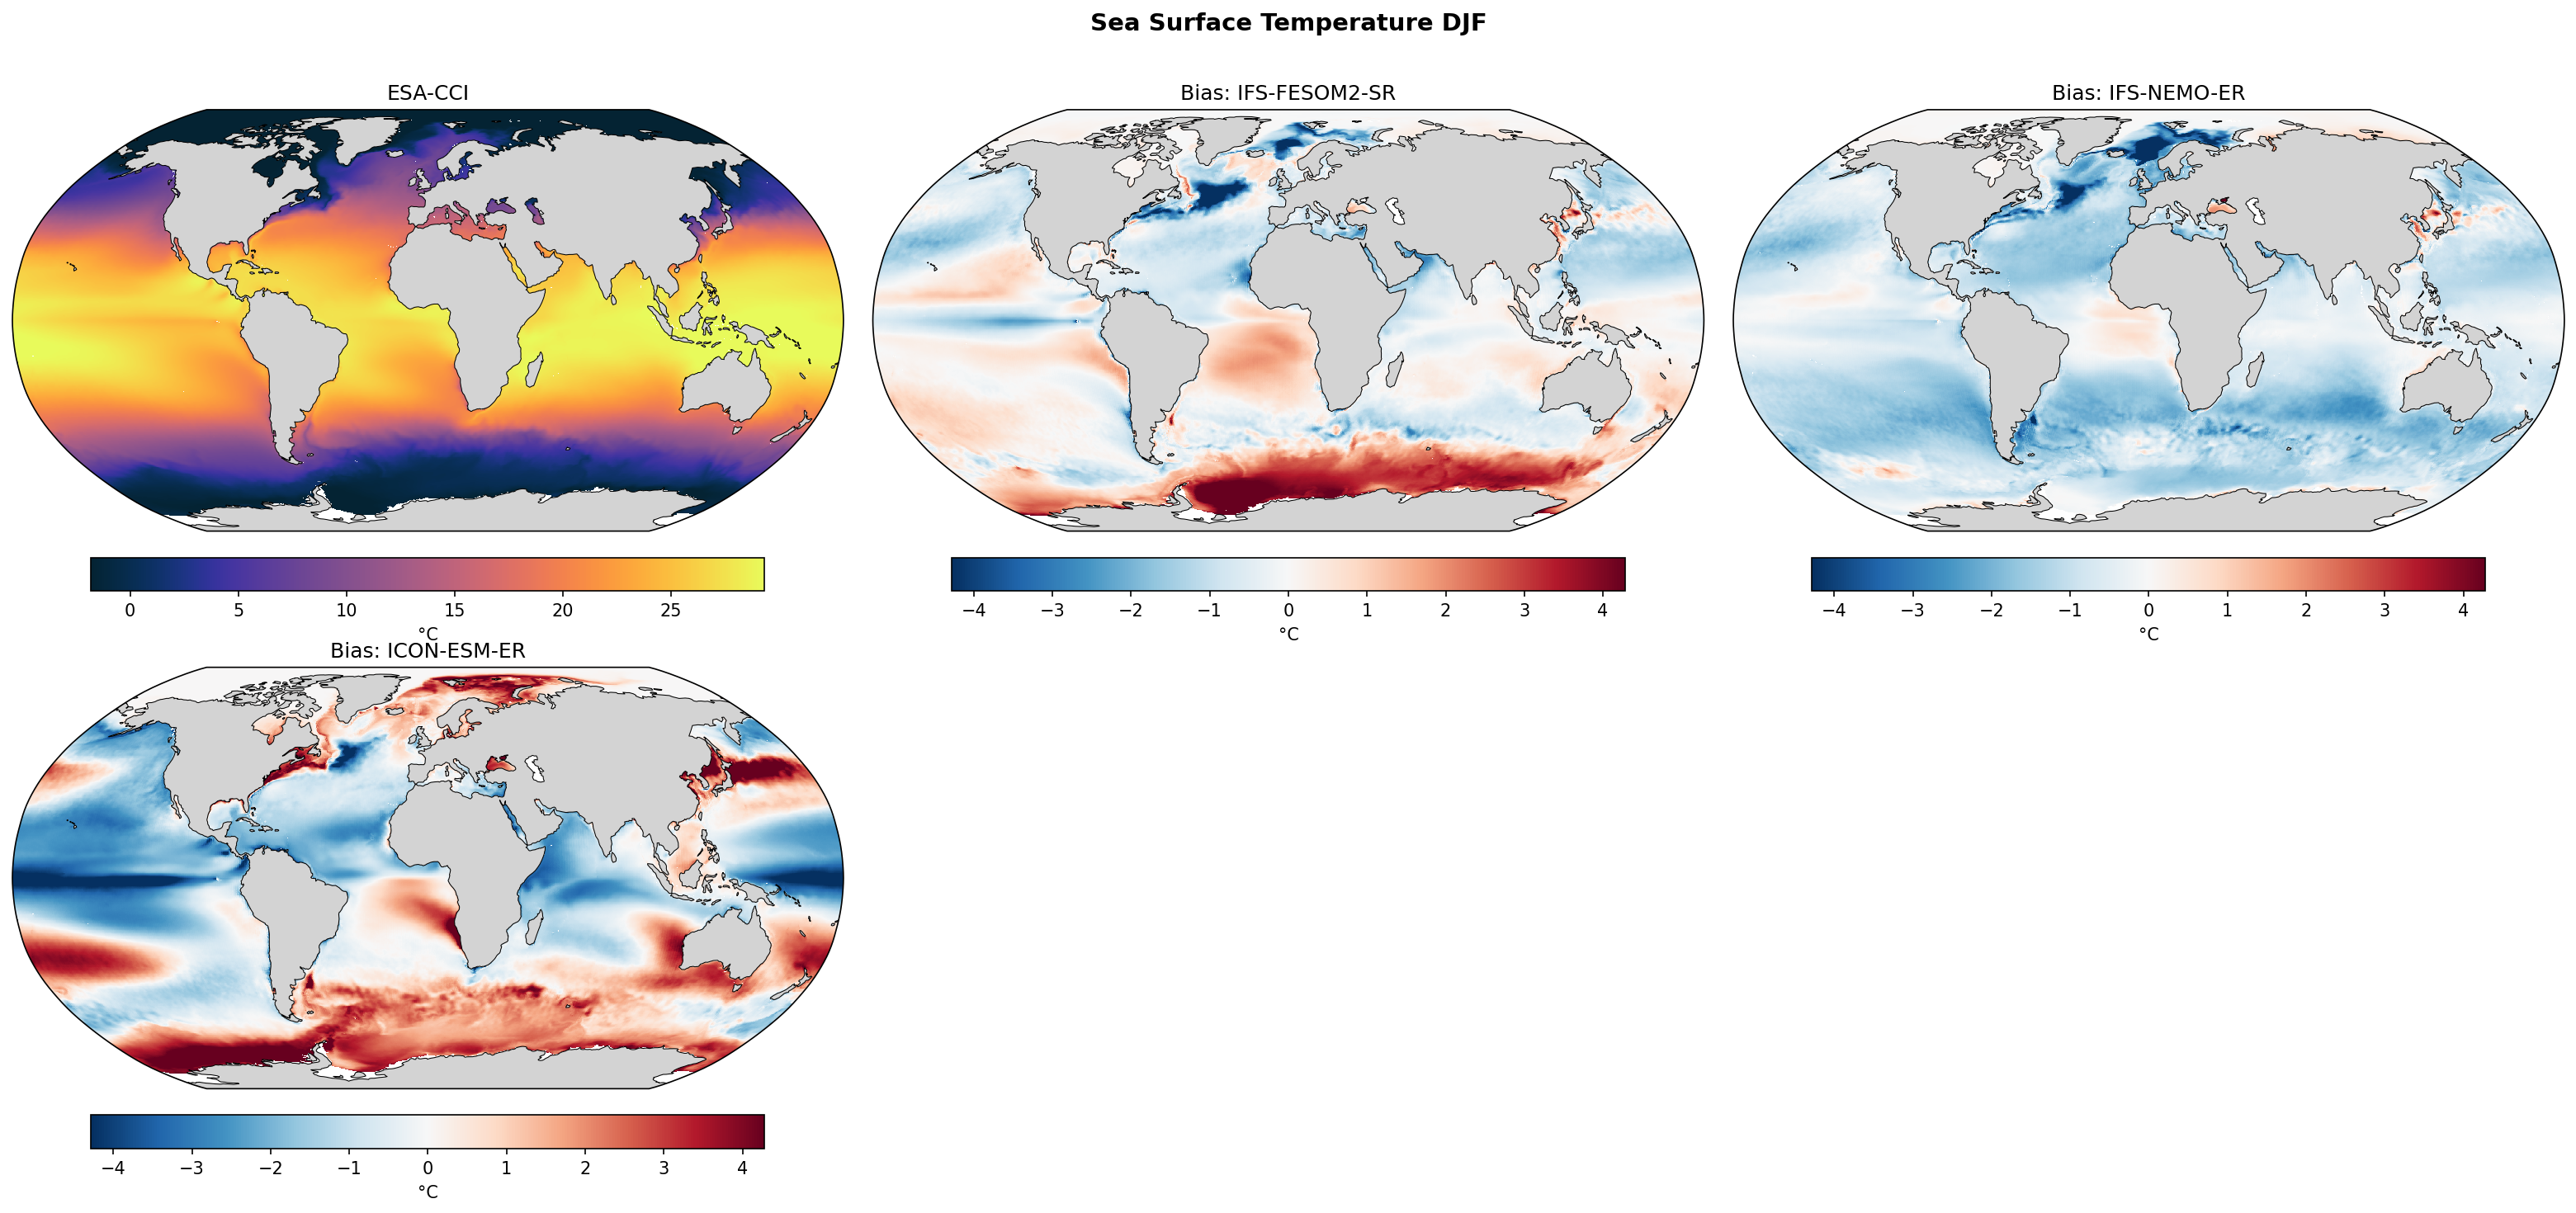
This diagnostic figure evaluates Sea Surface Temperature (SST) biases in DJF for three coupled models against ESA-CCI observations. While all models exhibit a prominent cold bias in the North Atlantic, they diverge significantly in the Southern Ocean, where IFS-FESOM2-SR and ICON-ESM-ER show strong warm biases contrasting with a cool bias in IFS-NEMO-ER.
Key Findings
- All three models share a significant cold bias in the North Atlantic subpolar gyre region, locally exceeding -3°C, suggesting common structural deficiencies in simulating the North Atlantic Current pathway.
- IFS-FESOM2-SR and ICON-ESM-ER exhibit a strong warm bias band in the Southern Ocean (up to +4°C), whereas IFS-NEMO-ER shows a weak cold bias in this region, highlighting sensitivity to the ocean model component.
- ICON-ESM-ER displays the largest regional biases and RMSE (~2.0 K), characterized by intense dipolar structures in western boundary currents (e.g., Gulf Stream, Kuroshio) and a strong cold tongue bias in the equatorial Pacific.
- IFS-NEMO-ER has a widespread global cool bias (global mean -0.94 K), distinct from the nearly zero global mean bias of IFS-FESOM2-SR (+0.06 K) which results from compensating regional errors.
Spatial Patterns
The North Atlantic is dominated by a 'cold blob' south of Greenland in all models. The Southern Ocean features a zonal band of strong warming in FESOM and ICON, absent in NEMO. ICON shows sharp dipole biases along the Gulf Stream and Kuroshio Extension, indicating positional shifts of these fronts. Warm biases in eastern boundary upwelling zones (e.g., Benguela, Peru) are visible in FESOM and ICON but dampened in NEMO due to its general cold state.
Model Agreement
Models agree on the sign of the bias in the North Atlantic (cold) but disagree strongly in the Southern Ocean and global mean state. IFS-NEMO stands out as consistently colder than observations, while FESOM and ICON show mixed large-magnitude regional biases.
Physical Interpretation
The pervasive North Atlantic cold bias suggests issues with the North Atlantic Current separation and heat transport, a persistent challenge even at eddy-rich resolutions. The divergence in Southern Ocean biases between IFS-FESOM and IFS-NEMO (which share the same atmospheric component) points to ocean-specific causes, likely related to vertical mixing schemes, sea-ice coupling, or surface albedo parameterizations affecting heat uptake. The dipolar biases in ICON suggest dynamic misplacement of sharp frontal gradients.
Caveats
- Analysis is limited to the DJF season; seasonal variations in biases (especially in sea ice zones) are not assessed.
- Global mean statistics for IFS-FESOM mask large compensating regional errors.
SST JJA Bias
| Variables | tos |
|---|---|
| Models | IFS-FESOM2-SR, IFS-NEMO-ER, ICON-ESM-ER |
| Reference Dataset | ESA-CCI L4 v3.0.1 |
| Units | K |
| Period | 1980–2014 |
| IFS-FESOM2-SR | Global Mean Bias: -0.16 · Rmse: 0.95 |
| IFS-NEMO-ER | Global Mean Bias: -0.92 · Rmse: 1.29 |
| ICON-ESM-ER | Global Mean Bias: -0.26 · Rmse: 1.83 |
Summary high
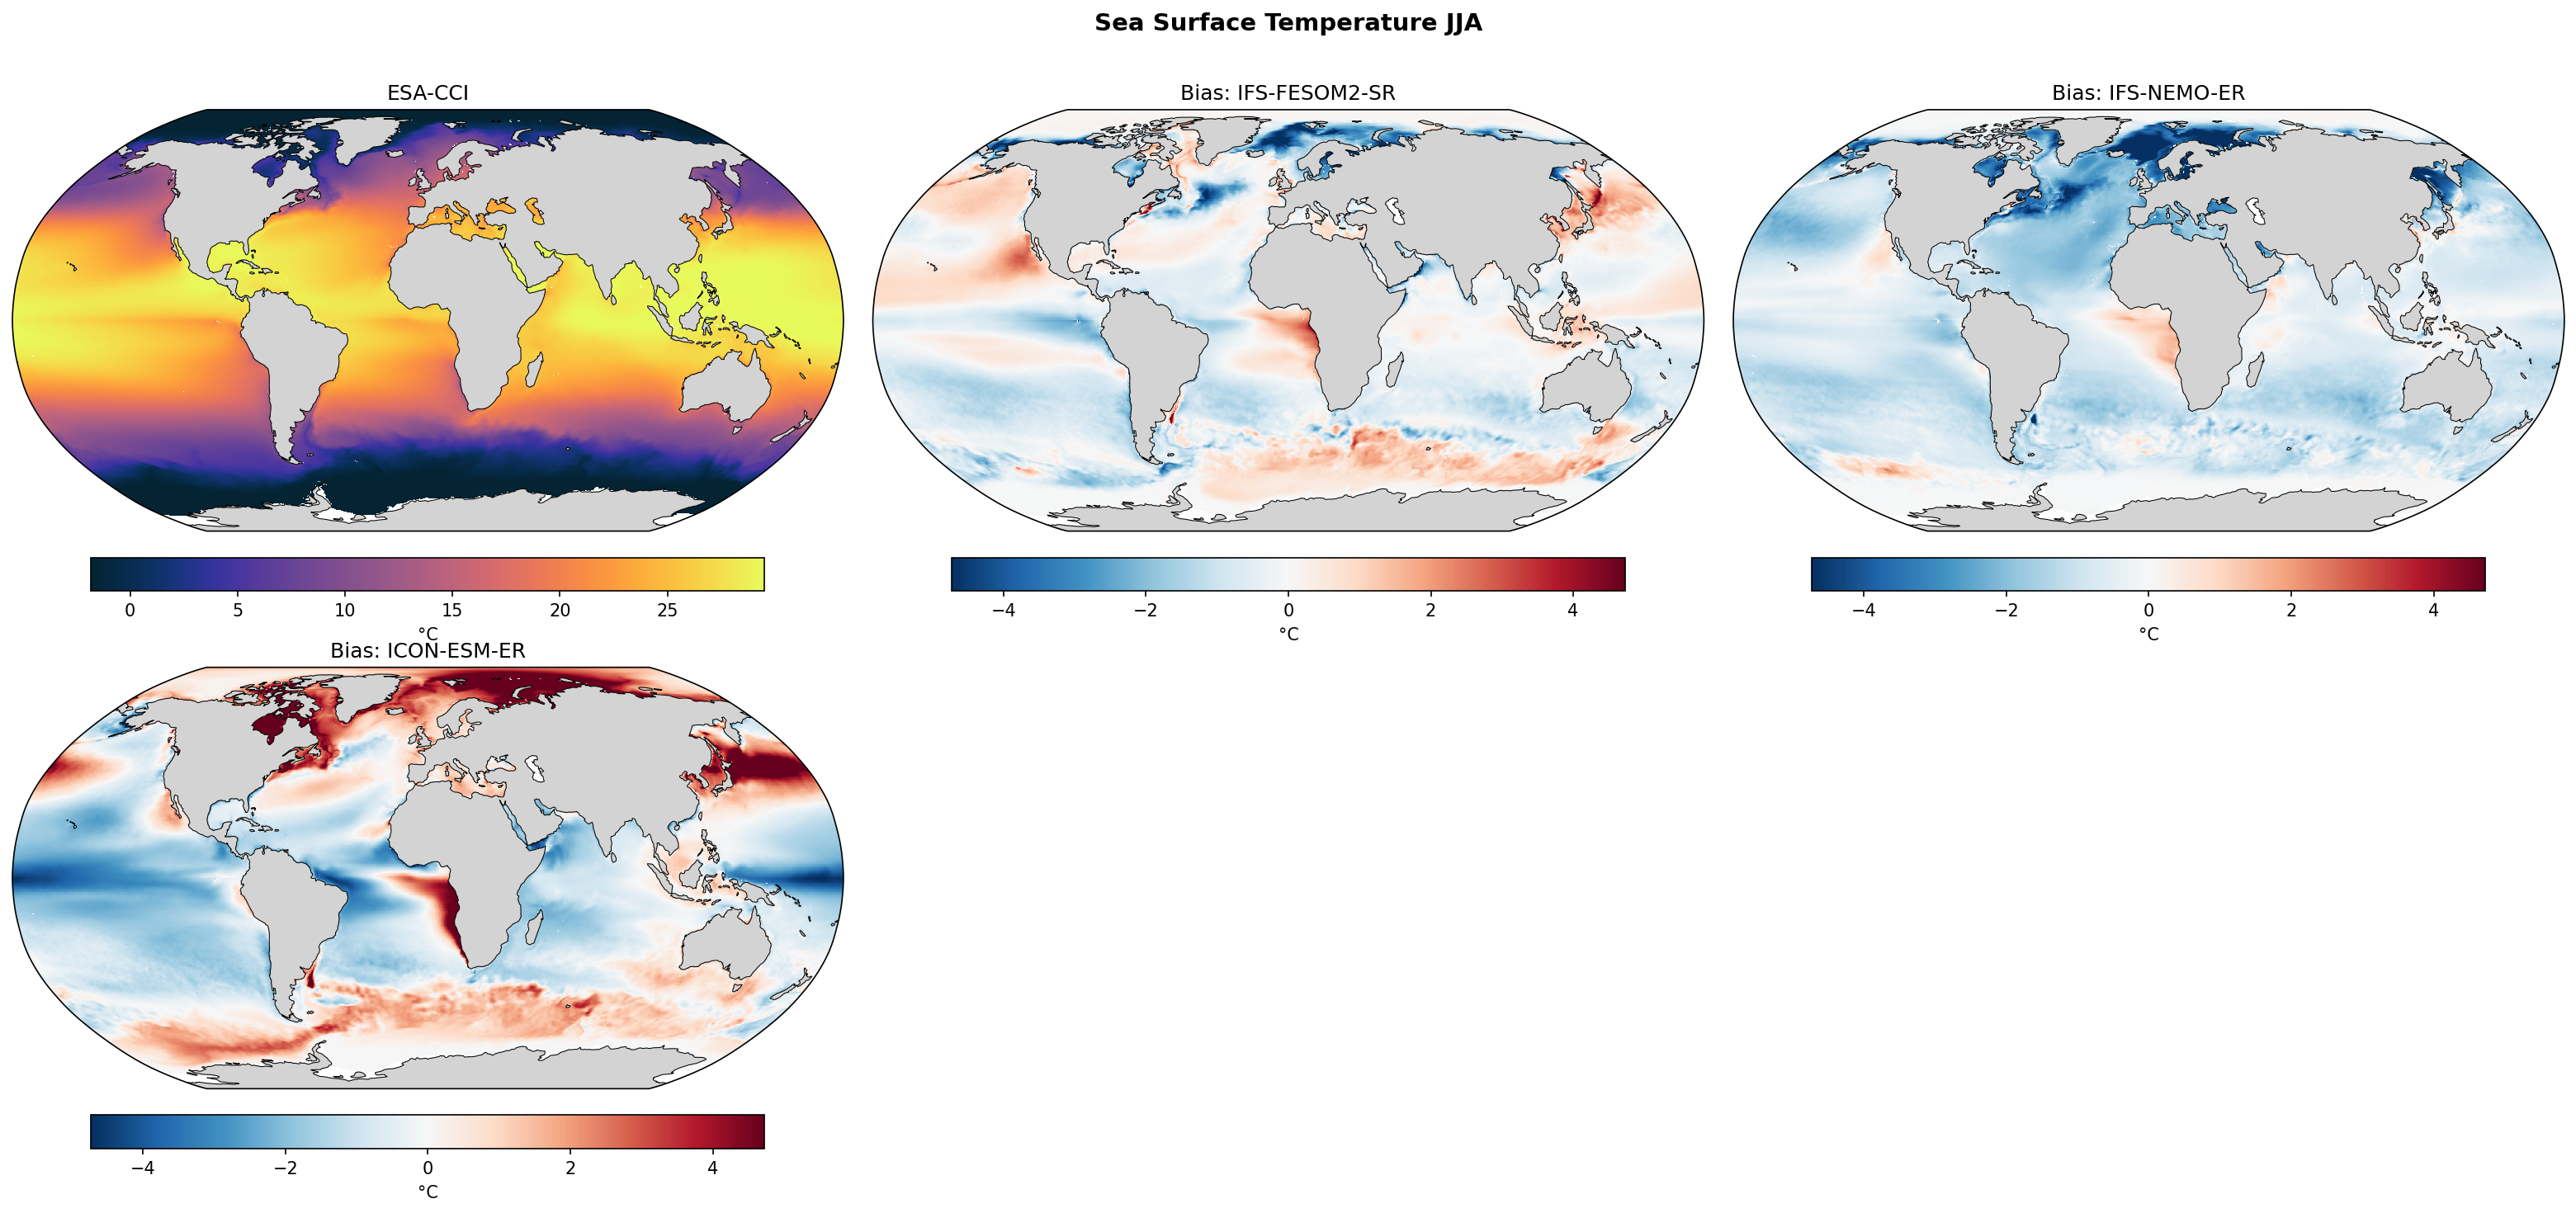
This JJA analysis reveals distinct bias regimes across the three high-resolution models: IFS-FESOM2-SR is the most accurate globally, IFS-NEMO-ER suffers from a pervasive global cold bias, and ICON-ESM-ER exhibits extreme regional contrasts with excessive warming in high latitudes and upwelling zones.
Key Findings
- IFS-NEMO-ER exhibits a systematic global cold bias (mean -0.92°C), reaching deviations beyond -4°C in the North Atlantic subpolar gyre.
- ICON-ESM-ER displays the largest regional errors (RMSE 1.83°C), characterized by severe warm biases (>4°C) in the North Atlantic subpolar gyre, Nordic Seas, Southern Ocean, and Benguela upwelling system, contrasted by a cold tropical band.
- IFS-FESOM2-SR shows the lowest global mean bias (-0.16°C) and RMSE (0.95°C), though it retains typical warm biases in Western Boundary Current extensions and Eastern Boundary upwelling regions.
Spatial Patterns
The North Atlantic subpolar gyre is a region of extreme disagreement: IFS-NEMO is excessively cold, ICON is excessively warm, and IFS-FESOM shows a cold-subpolar/warm-Gulf Stream dipole. Classic warm biases in the Benguela upwelling region (South Atlantic) are present in all models but are most severe in ICON.
Model Agreement
There is low agreement in high-latitude oceans, with bias signs opposing each other (NEMO cold vs ICON warm). However, models qualitatively agree on warm biases in eastern boundary upwelling zones (Benguela) and cold biases in the equatorial Indian and Western Pacific oceans.
Physical Interpretation
The persistent warm bias in the Benguela region across all models suggests that even at ~10 km atmospheric resolution, coastal wind stress curl and resulting Ekman pumping may be under-resolved or vertical mixing parameterizations are insufficient. The stark contrast in the North Atlantic suggests fundamentally different AMOC states or convective mixing behaviors, with ICON likely having too strong northward heat transport or deep convection, and IFS-NEMO potentially suffering from a 'cold start' or weak circulation state.
Caveats
- Analysis is restricted to JJA (boreal summer); biases may shift seasonally.
- The extreme warm bias in ICON's high latitudes suggests a possible model drift or initialization shock that warrants investigation of the full time series.
SST Seasonal Cycle
| Variables | tos |
|---|---|
| Models | IFS-FESOM2-SR, IFS-NEMO-ER, ICON-ESM-ER, ESA-CCI |
| Reference Dataset | ESA-CCI L4 v3.0.1 |
| Units | K |
| Period | 1980–2014 |
Summary high
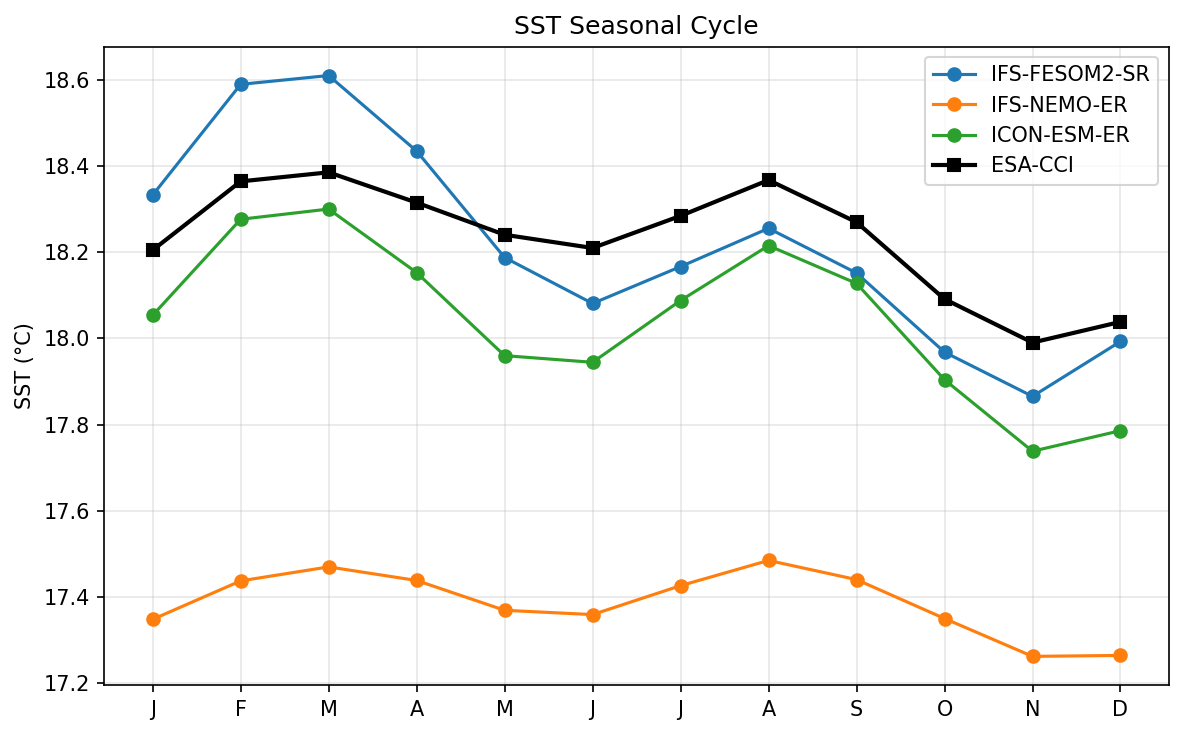
This figure shows the climatological seasonal cycle of global-mean Sea Surface Temperature (SST) for three coupled models compared to ESA-CCI satellite observations. While IFS-FESOM2-SR and ICON-ESM-ER capture the general magnitude and phase of the seasonal cycle (within ±0.2°C), IFS-NEMO-ER exhibits a severe systematic cold bias of nearly 1°C.
Key Findings
- IFS-NEMO-ER is a distinct outlier with a systematic cold bias of approximately 0.8–0.9°C relative to observations throughout the year.
- ICON-ESM-ER reproduces the phase and shape of the observed seasonal cycle (bimodal peaks in March and August) most accurately, despite a consistent slight cold bias of ~0.1–0.2°C.
- IFS-FESOM2-SR shows a warm bias in boreal winter/spring (JFM, +0.2°C) and a good match or slight cold bias in boreal autumn, resulting in an exaggerated seasonal amplitude relative to ESA-CCI.
Spatial Patterns
The global mean SST seasonal cycle is characterized by a double peak (March and August) driven by hemispheric asymmetries in ocean area and seasonality. IFS-FESOM2-SR amplifies the March peak (associated with Southern Hemisphere late summer), whereas IFS-NEMO-ER exhibits a damped cycle amplitude alongside its cold offset.
Model Agreement
Inter-model agreement on the mean state is poor due to the IFS-NEMO-ER outlier. However, IFS-FESOM2-SR and ICON-ESM-ER agree relatively well with each other and observations, differing by less than 0.3°C on average.
Physical Interpretation
The pervasive cold bias in IFS-NEMO-ER suggests potential issues with model spin-up, vertical mixing, or surface energy budget (e.g., negative cloud radiative forcing bias). The bimodal seasonal cycle reflects the interplay between the larger ocean area in the Southern Hemisphere (March peak) and the stronger seasonal temperature amplitude of the Northern Hemisphere (August peak). The JFM warm bias in IFS-FESOM2-SR implies excessive heat uptake or insufficient cooling during the Southern Hemisphere summer.
Caveats
- Global mean metrics can mask large, compensating regional biases (e.g., warm tropics vs. cold poles).
- The analysis period (1980–2014) is relatively short; initialization drifts in deep ocean heat content could influence surface temperatures.
SST Global Mean Time Series
| Variables | tos |
|---|---|
| Models | IFS-FESOM2-SR, IFS-NEMO-ER, ICON-ESM-ER, ESA-CCI |
| Reference Dataset | ESA-CCI L4 v3.0.1 |
| Units | K |
| Period | 1980–2014 |
Summary high
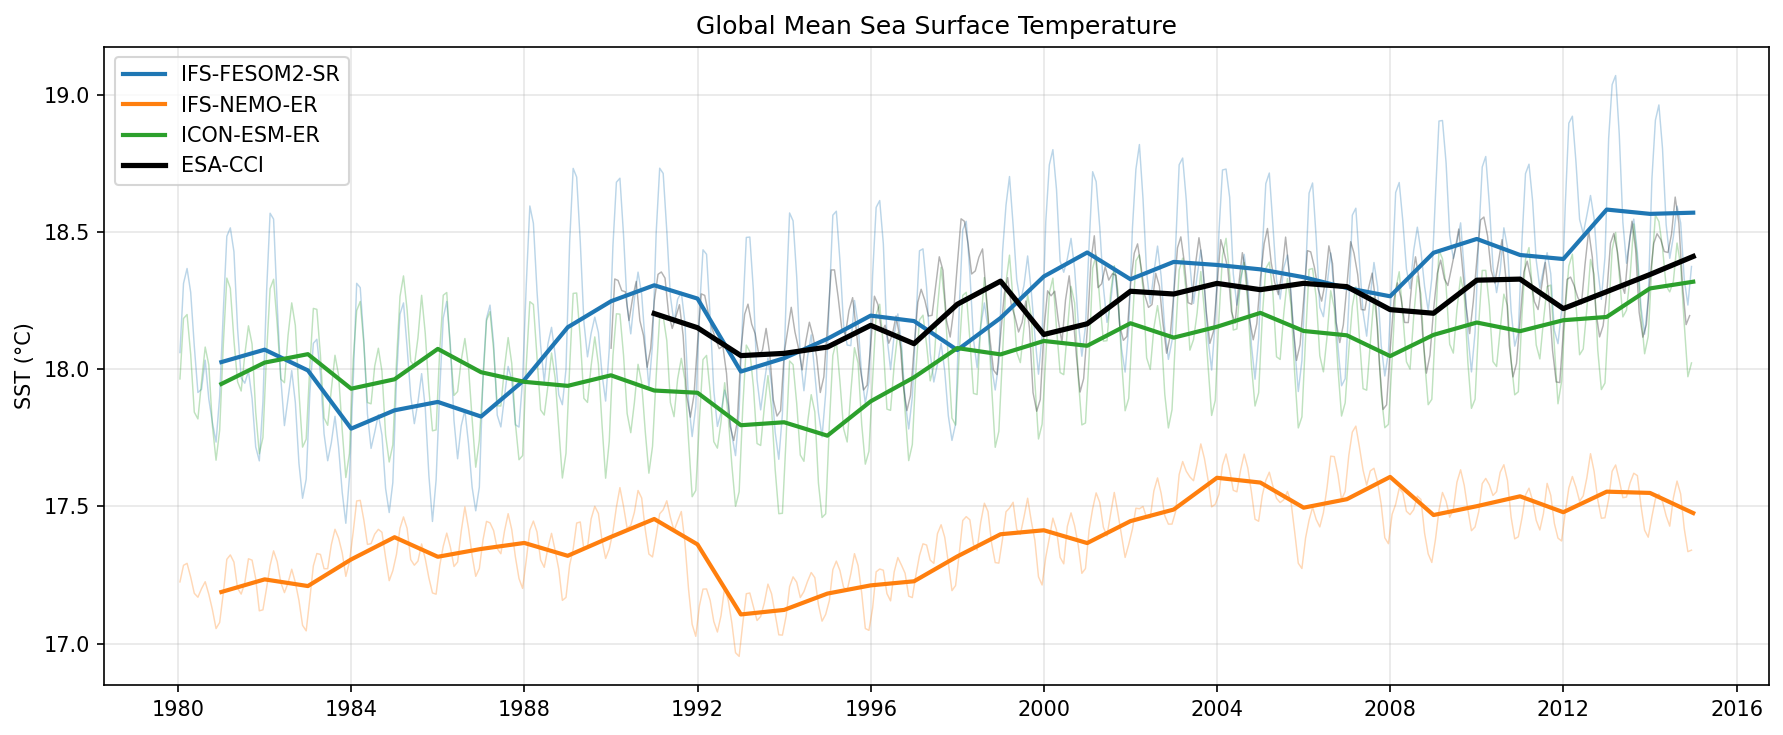
Time series analysis of global mean sea surface temperature (SST) from 1980 to 2014 comparing three high-resolution coupled models against ESA-CCI satellite observations.
Key Findings
- IFS-NEMO-ER exhibits a substantial systematic cold bias of approximately 0.8–1.0°C relative to ESA-CCI observations throughout the entire period.
- ICON-ESM-ER shows the best agreement with observations in absolute magnitude, tracking the ESA-CCI climatology closely with a negligible cold bias (< 0.1°C) and accurately reproducing interannual variability.
- IFS-FESOM2-SR displays a slight warm bias (~0.2°C) relative to observations in the 2000s and notably larger seasonal amplitude (monthly excursions) compared to both other models and the observational baseline.
- All models capture the multi-decadal warming trend and major climate events, such as the cooling following the 1991 Pinatubo eruption and the 1998 El Niño warming spike.
Spatial Patterns
While this is a global mean time series, temporal patterns reveal distinct responses to forcing. The 1991–1993 cooling dip (Mt. Pinatubo) is most pronounced in IFS-NEMO-ER and ICON-ESM-ER. The 1998 El Niño signal is evident in all simulations. The seasonal cycle amplitude (indicated by the spread of the thin monthly lines) is widest in IFS-FESOM2-SR.
Model Agreement
Models disagree significantly on the mean state, with a spread of nearly 1°C between the coldest (IFS-NEMO-ER) and warmest (IFS-FESOM2-SR) simulations. However, they show high agreement on the long-term warming trend and interannual variability phases, suggesting consistent responses to external forcing despite mean-state biases.
Physical Interpretation
The persistent cold bias in IFS-NEMO-ER suggests a systemic issue with the surface energy budget, potentially due to excessive vertical mixing bringing cold deep water to the surface or cloud radiative biases reflecting too much shortwave radiation. The larger seasonal amplitude in IFS-FESOM2-SR may relate to its unstructured grid formulation or shallower mixed layer depths responding more vigorously to seasonal insolation cycles. The alignment of trends indicates that climate sensitivity to GHGs and aerosols is broadly consistent across models.
Caveats
- ESA-CCI observational data plotted here only covers the period from ~1991 onwards, limiting validation of the 1980–1990 model spin-up/drift.
- The analysis is based on global means, which may mask compensating regional biases (e.g., cold tongue bias vs. warm boundary currents).
SST Zonal Mean Profile
| Variables | tos |
|---|---|
| Models | IFS-FESOM2-SR, IFS-NEMO-ER, ICON-ESM-ER, ESA-CCI |
| Reference Dataset | ESA-CCI L4 v3.0.1 |
| Units | K |
| Period | 1980–2014 |
Summary high
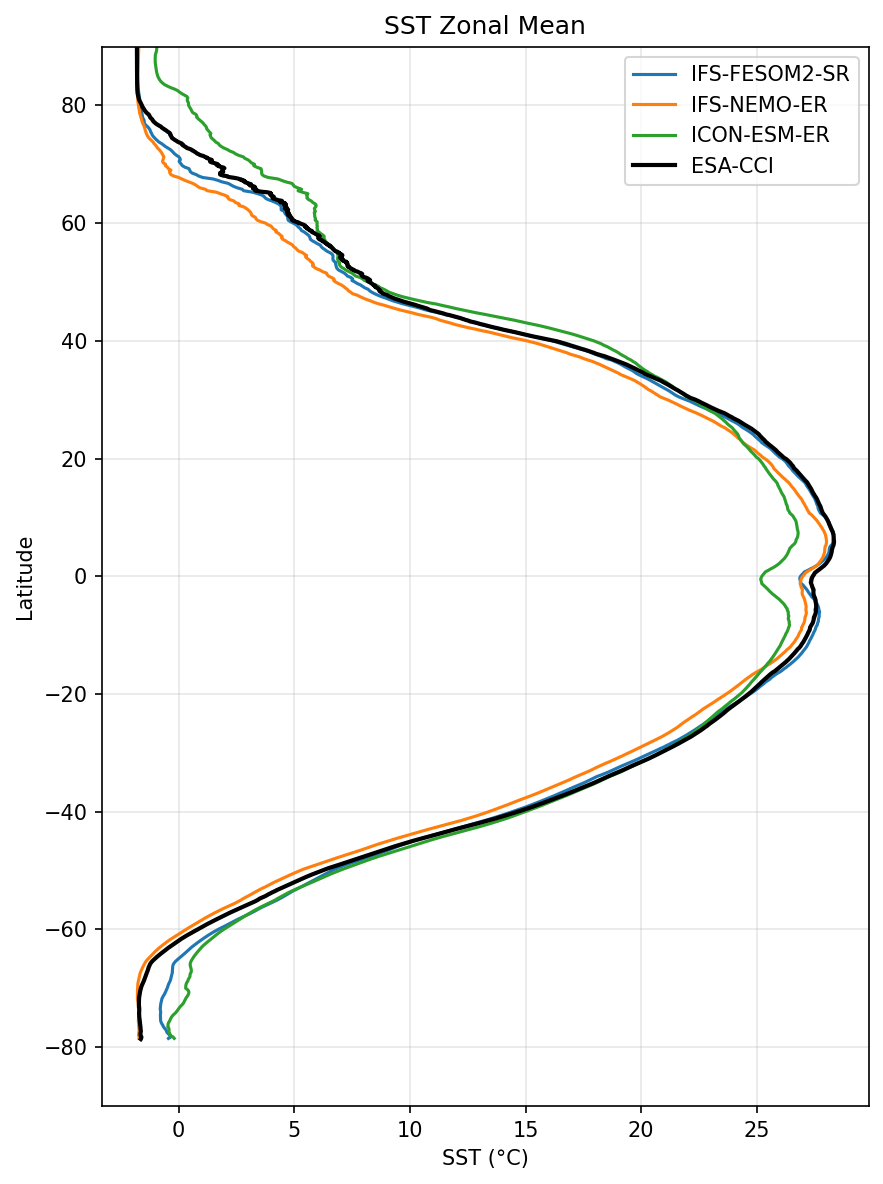
This figure compares the zonal mean Sea Surface Temperature (SST) climatology (1980–2014) of three high-resolution coupled models against ESA-CCI satellite observations.
Key Findings
- IFS-FESOM2-SR demonstrates the highest fidelity to observations, tracking the ESA-CCI profile very closely across all latitudes with minimal bias.
- ICON-ESM-ER exhibits a severe tropical cold bias (approx. 3°C too cold at the equator), indicative of an excessive equatorial cold tongue, and a substantial warm bias in the Northern Hemisphere mid-to-high latitudes (>45°N).
- IFS-NEMO-ER shows a hemispheric asymmetry: a distinct warm bias in the Southern Hemisphere (approx. 60°S to 10°S) and a cold bias in the Northern Hemisphere mid-latitudes (20°N to 60°N).
Spatial Patterns
The tropical peak (approx. 28°C in observations) is significantly underestimated by ICON-ESM-ER, which dips to ~25°C at the equator. In the extratropics, biases diverge: ICON is too warm in the NH north of 40°N, while IFS-NEMO is too cold in the same region. Conversely, in the SH, IFS-NEMO is consistently warmer than the other models and observations.
Model Agreement
Agreement is highest in the Southern Ocean (south of 60°S) where models converge near freezing, though IFS-NEMO remains slightly warmer. Divergence is largest in the tropics (due to ICON's cold tongue) and the Northern Hemisphere mid-latitudes (where ICON is warm and IFS-NEMO is cold). IFS-FESOM2-SR consistently lies between the diverging models, aligning well with the observational reference.
Physical Interpretation
ICON-ESM-ER's strong equatorial cold bias suggests issues with the parameterization of tropical upwelling or mixing (classic 'cold tongue bias'). Its NH warm bias may stem from AMOC strength or insufficient surface heat loss/sea-ice in the high latitudes. IFS-NEMO-ER's NH cold bias might reflect a weak North Atlantic Current or issues with western boundary current separation (e.g., 'cold blob'), while its SH warm bias is often associated with cloud radiative feedback errors (insufficient low cloud reflection).
Caveats
- Zonal averaging masks regional biases (e.g., Gulf Stream separation errors vs. broad basin biases).
- The figure represents an annual mean climatology, potentially hiding seasonal biases in SST evolution.