Temperature 2m Temperature (Berkeley Earth) CMIP6
CMIP6 Multi-Model Mean Context
Comparison with CMIP6 ensemble mean from 11 members.
Contributing models: ACCESS-ESM1-5, AWI-CM-1-1-MR, CNRM-CM6-1, CNRM-ESM2-1, EC-Earth3, FGOALS-g3, GISS-E2-1-G, INM-CM5-0, IPSL-CM6A-LR, MPI-ESM1-2-LR, MRI-ESM2-0
Synthesis
Related diagnostics
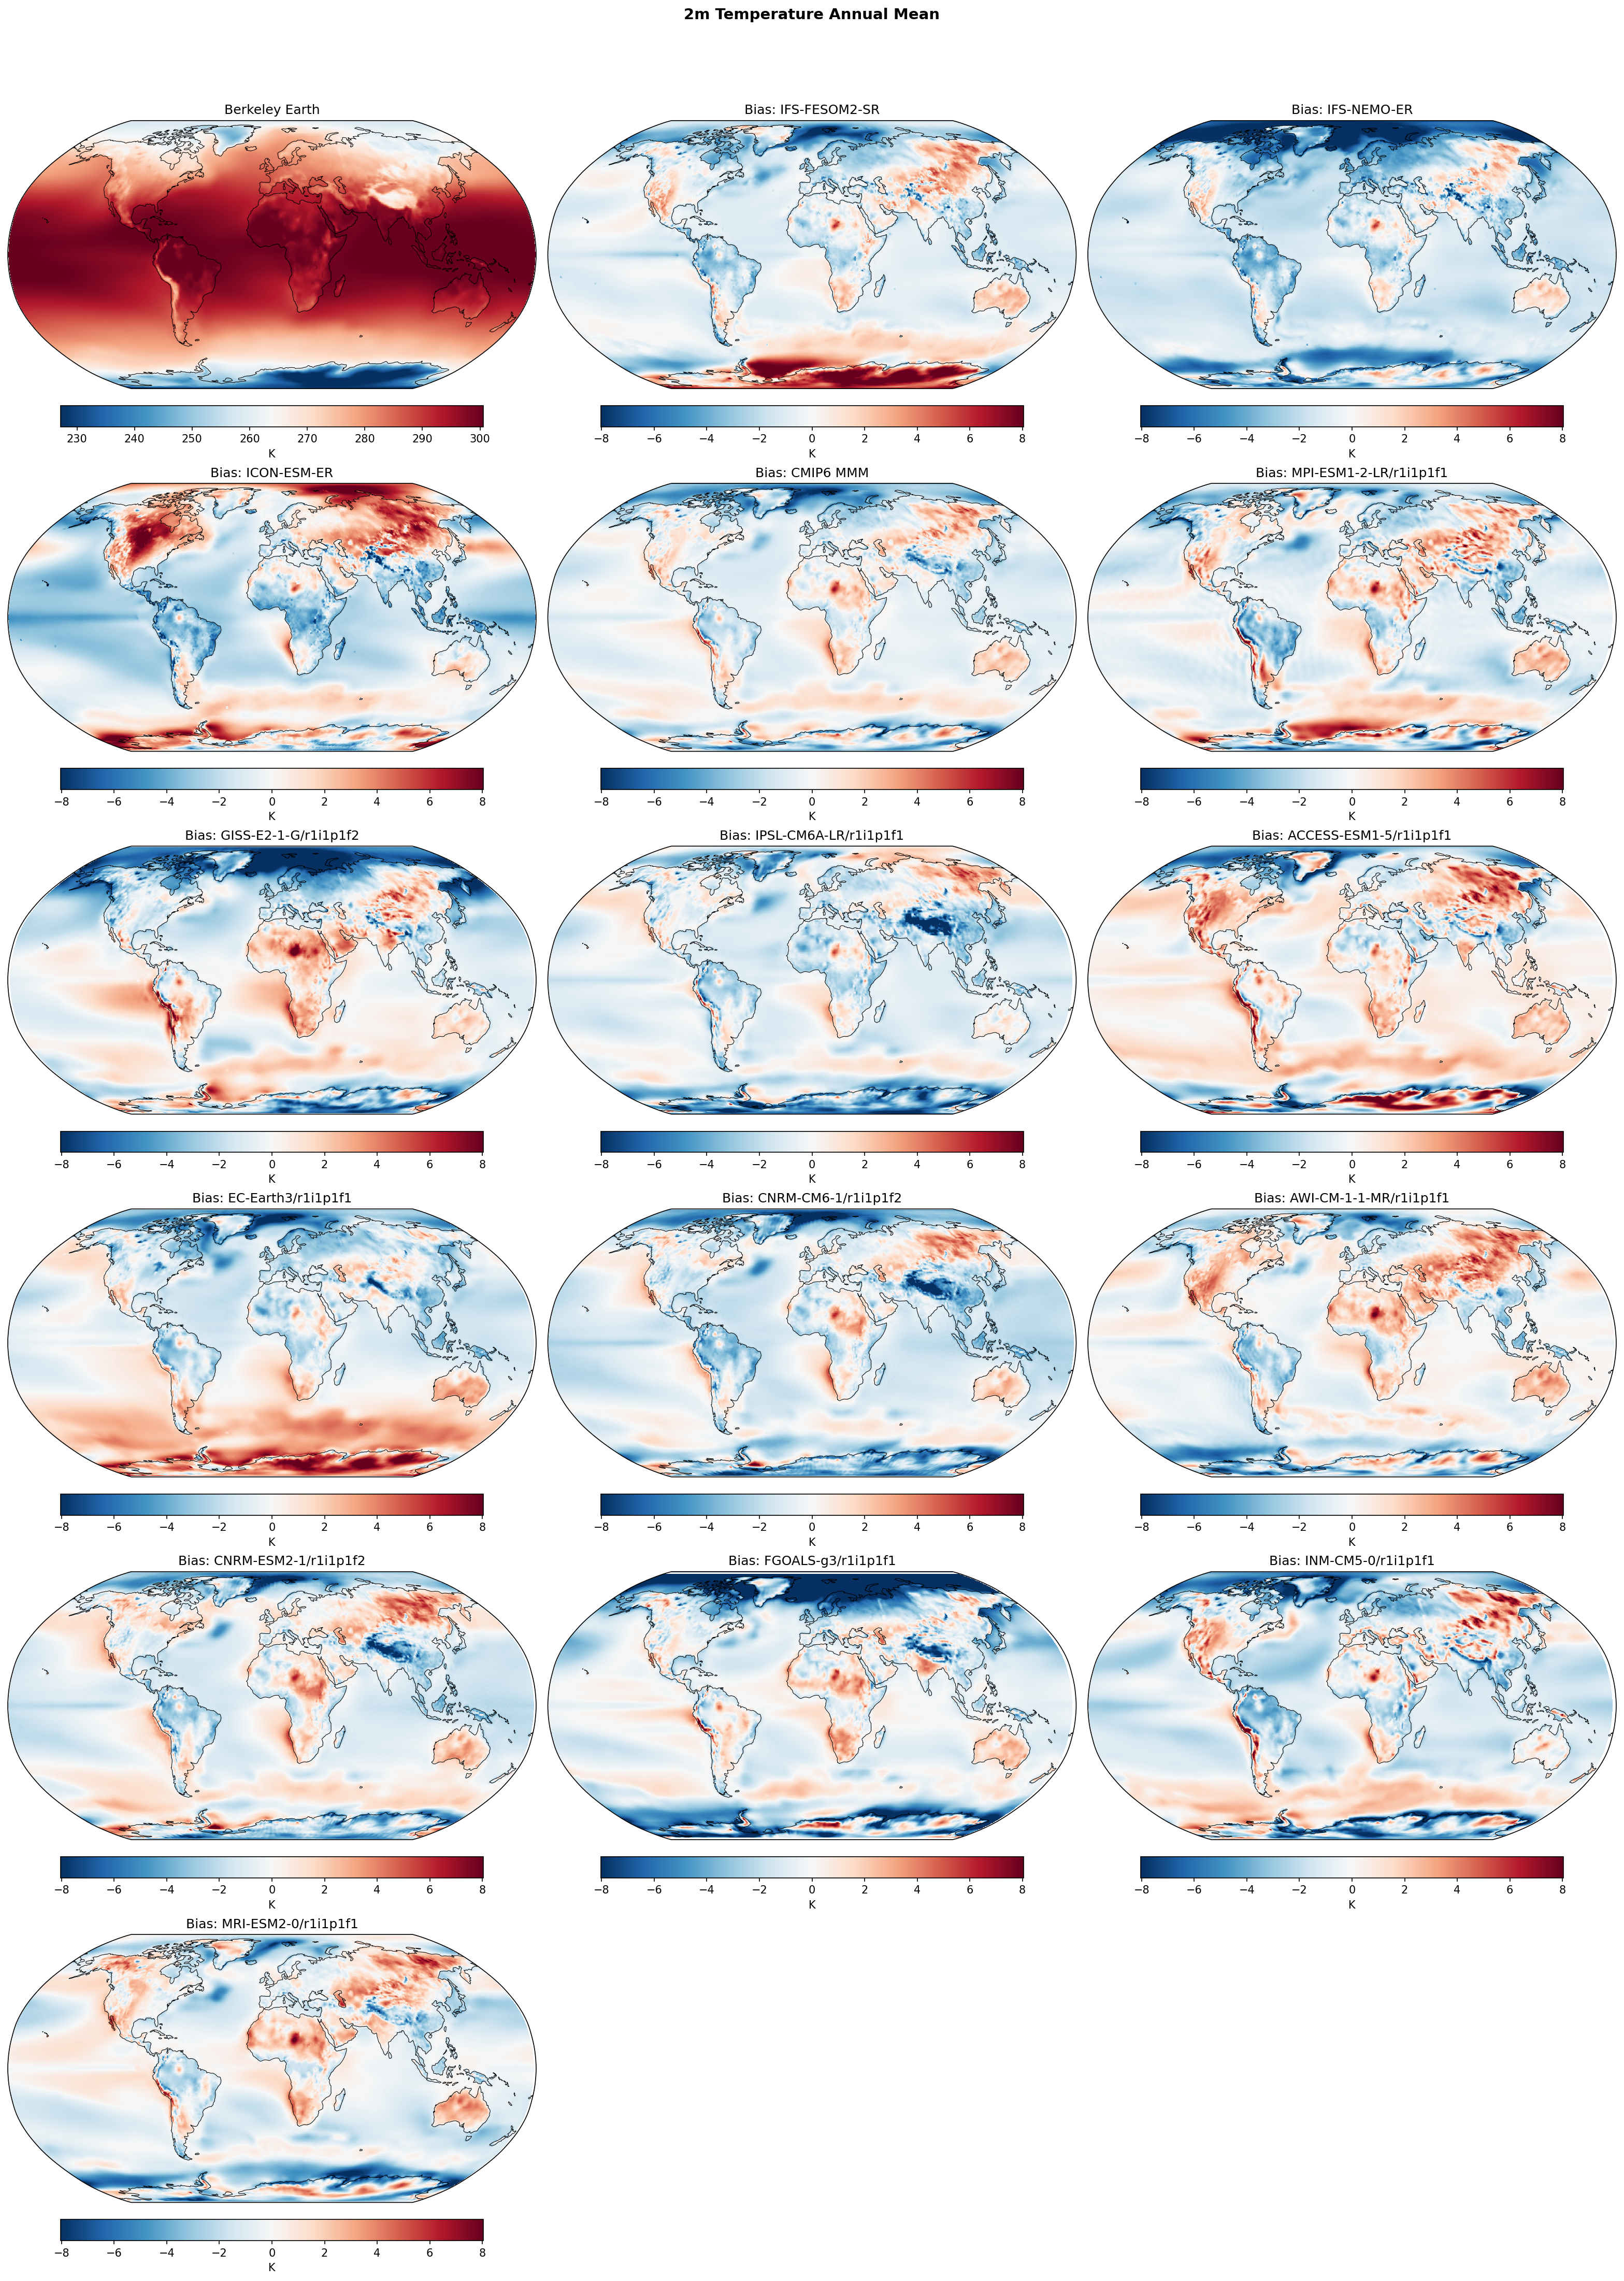
2m Temperature Annual Mean Bias
| Variables | tas |
|---|---|
| Models | IFS-FESOM2-SR, IFS-NEMO-ER, ICON-ESM-ER, CMIP6 MMM, MPI-ESM1-2-LR/r1i1p1f1, GISS-E2-1-G/r1i1p1f2, IPSL-CM6A-LR/r1i1p1f1, ACCESS-ESM1-5/r1i1p1f1, EC-Earth3/r1i1p1f1, CNRM-CM6-1/r1i1p1f2, AWI-CM-1-1-MR/r1i1p1f1, CNRM-ESM2-1/r1i1p1f2, FGOALS-g3/r1i1p1f1, INM-CM5-0/r1i1p1f1, MRI-ESM2-0/r1i1p1f1 |
| Reference Dataset | Berkeley Earth |
| Units | K |
| Period | 1980–2014 |
| IFS-FESOM2-SR | Pattern Correlation: 0.99 · Std Ratio: 0.96 · Rmse: 1.99 · Global Mean Bias: -0.54 · Arctic Bias: -2.32 · Tropical Bias: -0.83 · Antarctic Bias: 2.13 |
| IFS-NEMO-ER | Pattern Correlation: 0.99 · Std Ratio: 1.04 · Rmse: 2.62 · Global Mean Bias: -1.84 · Arctic Bias: -5.20 · Tropical Bias: -1.42 · Antarctic Bias: -3.08 |
| ICON-ESM-ER | Pattern Correlation: 0.99 · Std Ratio: 0.91 · Rmse: 2.61 · Global Mean Bias: -0.89 · Arctic Bias: 1.58 · Tropical Bias: -2.21 · Antarctic Bias: 1.13 |
Summary high
This diagnostic evaluates annual mean 2m temperature biases in high-resolution EERIE simulations (IFS-FESOM2-SR, IFS-NEMO-ER, ICON-ESM-ER) and CMIP6 models against Berkeley Earth climatology (1980–2014). The models exhibit strikingly different bias regimes, ranging from systematic global cooling to distinct latitudinal gradients.
Key Findings
- IFS-NEMO-ER exhibits a severe, systematic cold bias globally (mean: -1.84 K), which is amplified in the polar regions (Arctic: -5.2 K; Antarctic: -3.1 K).
- ICON-ESM-ER displays a 'cold tropics / warm poles' bias structure, characterized by strong warm biases over high-latitude continents (Siberia, N. America) and broad cooling in the tropics (-2.2 K).
- IFS-FESOM2-SR achieves the lowest RMSE (1.99 K) and best pattern correlation (0.99) among the EERIE models, but shows opposing polar biases: significantly warm over Antarctica (+2.1 K) and cold in the Arctic (-2.3 K).
Spatial Patterns
The CMIP6 Multi-Model Mean (MMM) shows the classic 'warm Southern Ocean' bias and 'cold North Atlantic' warming hole. IFS-FESOM2-SR reproduces the warm Antarctic bias but has a generally cooler global ocean. In contrast, IFS-NEMO-ER is dominated by blue (cold) biases everywhere, erasing the warm Southern Ocean feature entirely. ICON-ESM-ER is unique with its intense warm biases restricted largely to high-latitude land masses and sea ice zones, contrasting with a deep blue tropical band.
Model Agreement
There is low agreement among the three EERIE models, which diverge significantly in their mean state. IFS-FESOM2-SR aligns most closely with the observational mean state (despite regional biases), while IFS-NEMO-ER is an outlier with its strong global cold offset. CMIP6 individual models show high variability, but the EERIE models span nearly the full range of CMIP6 behavior (from cold IPSL-like patterns to warm ACCESS-like features).
Physical Interpretation
IFS-NEMO-ER's global coldness suggests a fundamental top-of-atmosphere energy imbalance, likely due to excessive planetary albedo (too many clouds or too extensive/bright sea ice). The strong land-warming in ICON-ESM-ER at high latitudes points to deficiencies in land-surface coupling, specifically snow albedo feedbacks or stable boundary layer parameterizations (insufficient decoupling in winter). The divergence between IFS-NEMO (cold Antarctic) and IFS-FESOM (warm Antarctic), which likely share atmospheric physics, highlights the critical role of the ocean/sea-ice component and resolution in regulating Southern Hemisphere surface temperatures.
Caveats
- Resolution differences (SR vs ER) complicate direct comparisons; IFS-NEMO-ER and ICON-ESM-ER are eddy-rich (~10km), while IFS-FESOM2-SR is standard resolution (~25km), which may influence the tuning status.
- Observational uncertainty in Antarctic temperatures is higher than in other regions.
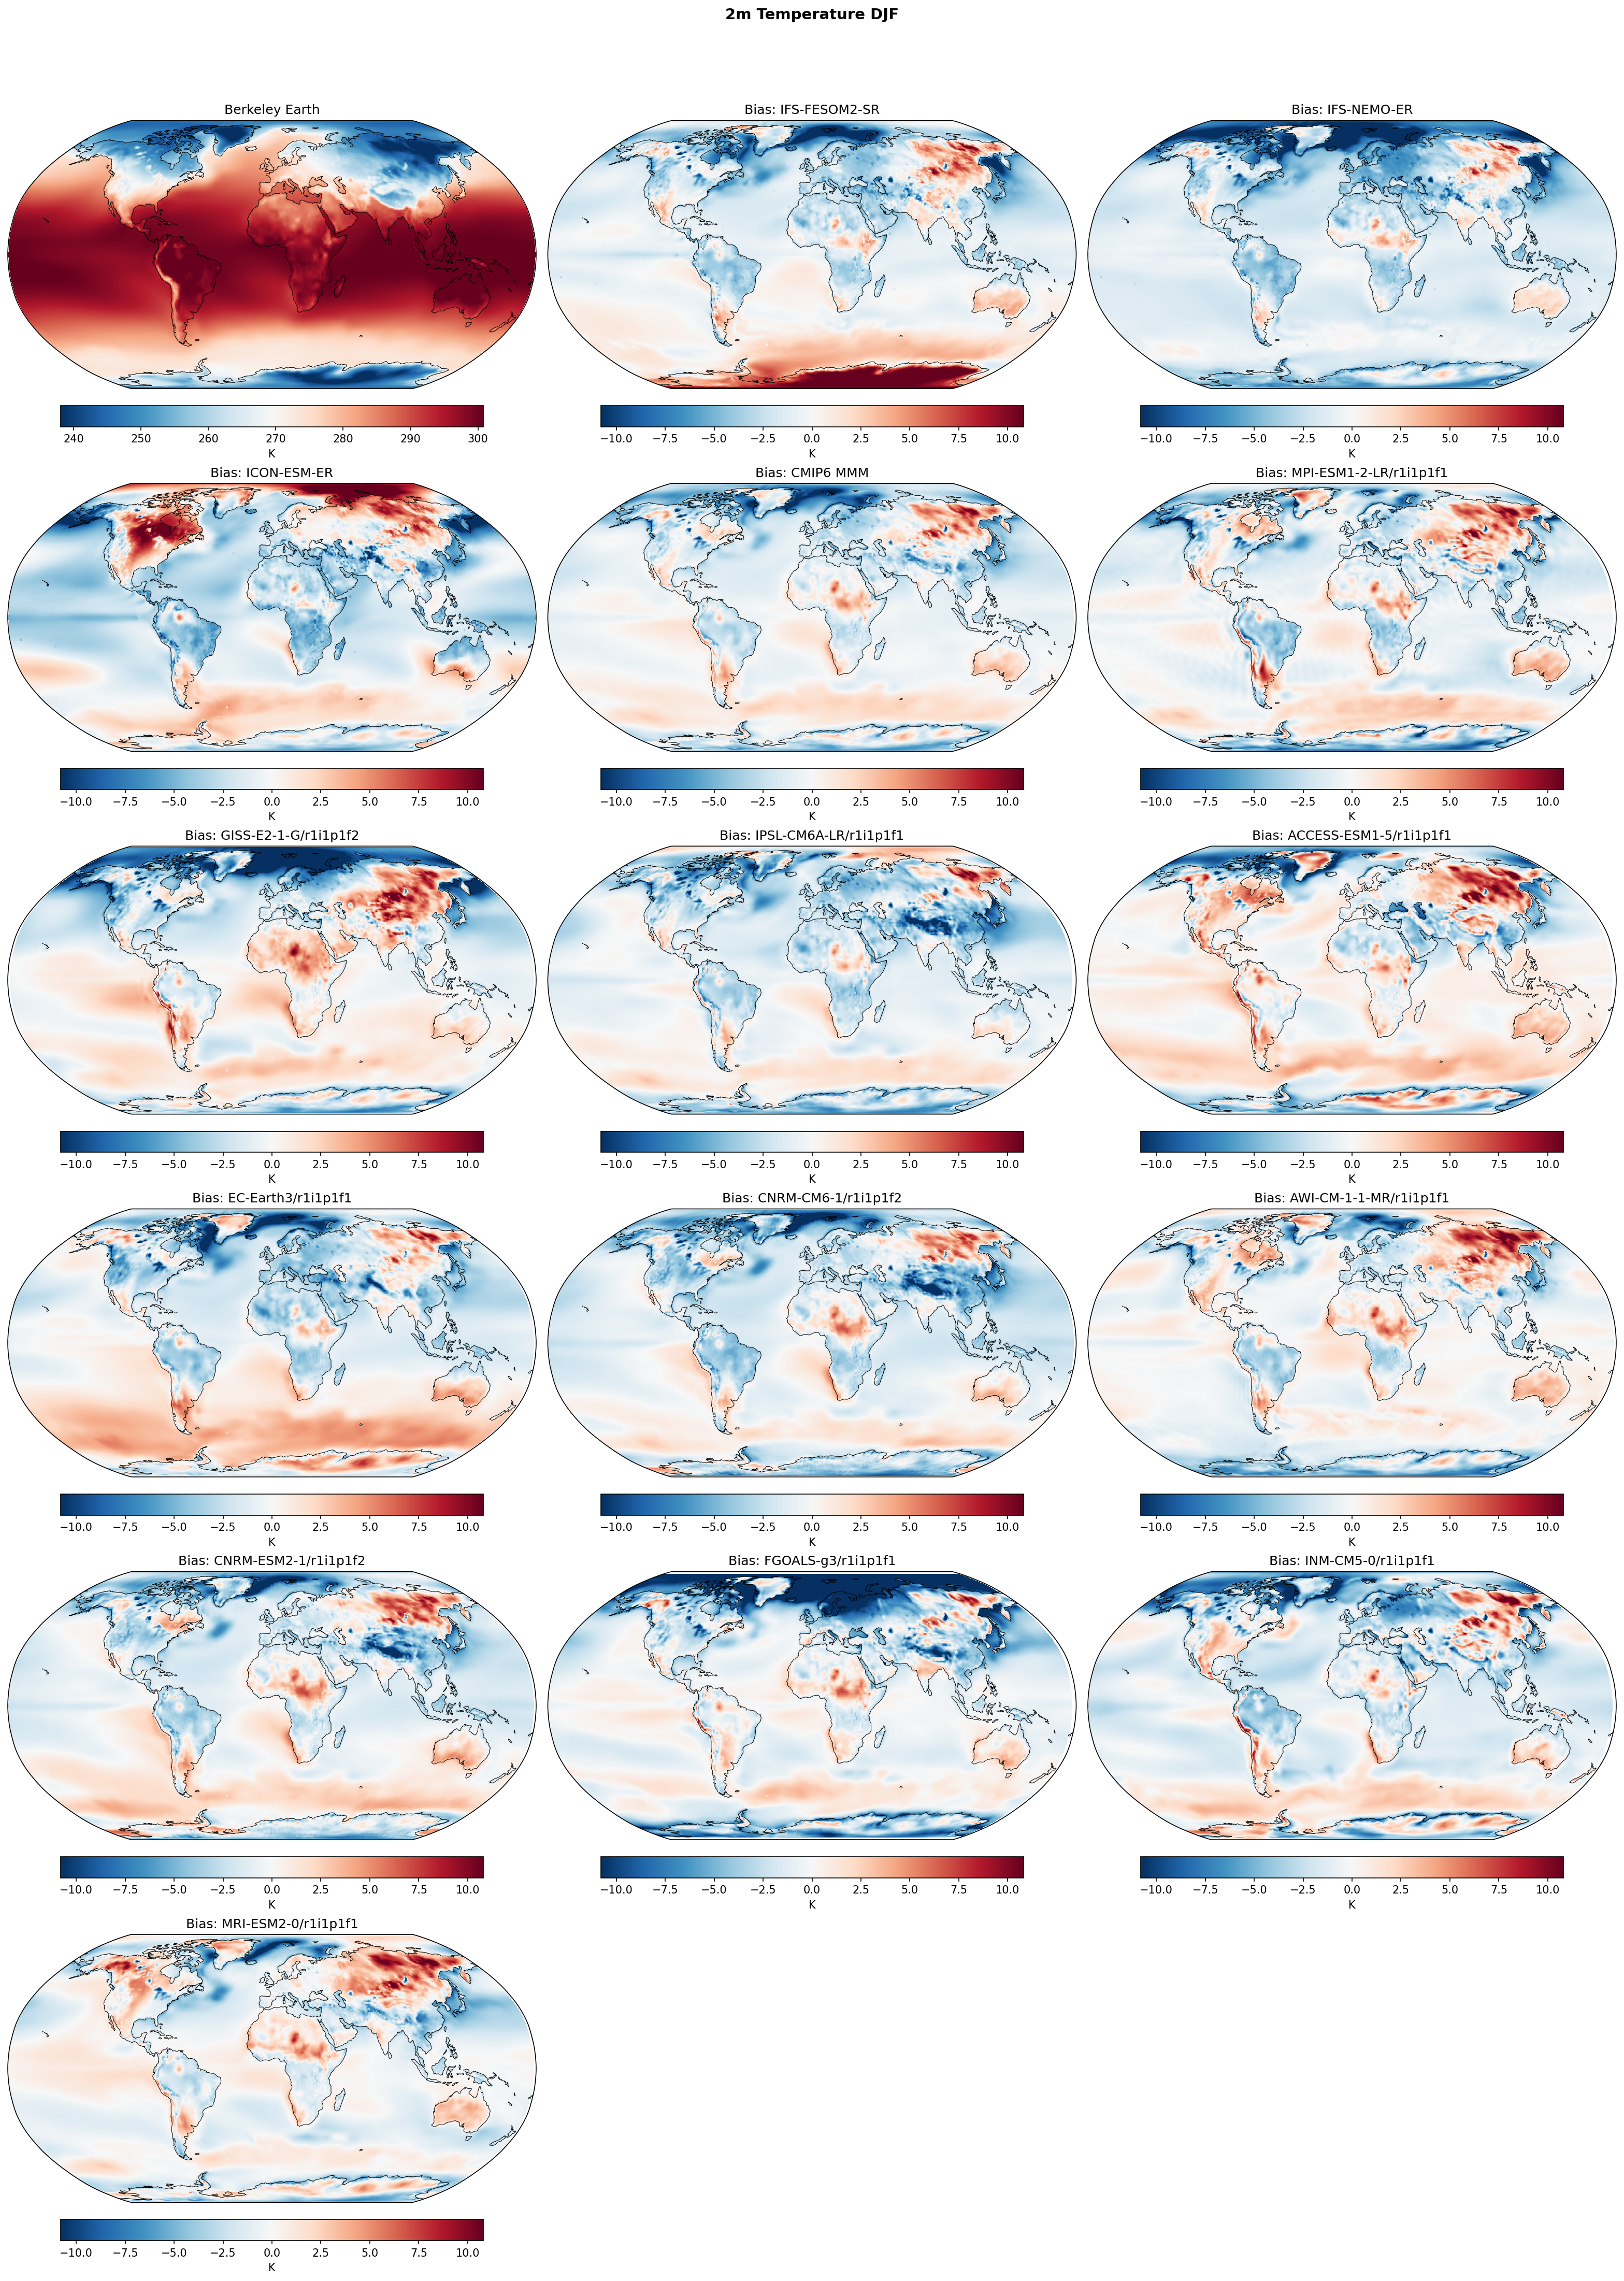
2m Temperature DJF Bias
| Variables | tas |
|---|---|
| Models | IFS-FESOM2-SR, IFS-NEMO-ER, ICON-ESM-ER, CMIP6 MMM, MPI-ESM1-2-LR/r1i1p1f1, GISS-E2-1-G/r1i1p1f2, IPSL-CM6A-LR/r1i1p1f1, ACCESS-ESM1-5/r1i1p1f1, EC-Earth3/r1i1p1f1, CNRM-CM6-1/r1i1p1f2, AWI-CM-1-1-MR/r1i1p1f1, CNRM-ESM2-1/r1i1p1f2, FGOALS-g3/r1i1p1f1, INM-CM5-0/r1i1p1f1, MRI-ESM2-0/r1i1p1f1 |
| Reference Dataset | Berkeley Earth |
| Units | K |
| Period | 1980–2014 |
Summary high
This figure evaluates the climatological DJF (boreal winter/austral summer) 2m temperature biases of three high-resolution EERIE models (IFS-FESOM2-SR, IFS-NEMO-ER, ICON-ESM-ER) and the CMIP6 ensemble against Berkeley Earth observations.
Key Findings
- ICON-ESM-ER exhibits a severe warm bias (>8 K) over North America, Greenland, and the Arctic, contrasted with a cold bias over Siberia, suggesting a significant stationary wave or circulation anomaly.
- IFS-FESOM2-SR shows a strong warm bias over the Antarctic continent and Weddell Sea which is largely absent in IFS-NEMO-ER, indicating that the FESOM ocean/sea-ice component is the likely source of this error given the shared atmospheric component.
- A systematic cold bias persists over North Africa (Sahara) and the Tibetan Plateau across nearly all models, including the high-resolution runs and the CMIP6 MMM.
- Both IFS variants and ICON-ESM-ER display a 'cold blob' bias in the North Atlantic subpolar gyre, a feature also common in the CMIP6 ensemble.
Spatial Patterns
Biases are most pronounced in high-latitude regions and over complex topography. The Northern Hemisphere winter (DJF) shows large continental biases: widespread warmth in ICON over North America versus widespread cold in INM-CM5-0. Topographic cold biases mark the Andes, Himalayas, and Rockies in most simulations. The Southern Ocean shows distinct warm biases in many CMIP6 models and IFS-FESOM2-SR, whereas IFS-NEMO-ER and ICON-ESM-ER remain closer to neutral.
Model Agreement
There is strong inter-model agreement on the cold bias over North African deserts and major mountain ranges. Disagreement is highest in the polar regions: IFS-NEMO-ER performs significantly better in the Antarctic than IFS-FESOM2-SR, and ICON-ESM-ER is an outlier with its extreme Arctic/North American warming compared to the IFS models and the CMIP6 MMM.
Physical Interpretation
The large difference between IFS-FESOM and IFS-NEMO in the Antarctic points to deficiencies in FESOM's representation of vertical mixing or sea-ice thermodynamics (excessive heat release). ICON's dipole bias (warm N. America, cold Siberia) implies a displacement of the polar vortex or errors in blocking frequency. The widespread desert cold biases are likely related to errors in surface emissivity or dust radiative effects common to many land surface schemes.
Caveats
- Observational uncertainty is higher in polar regions (Antarctica/Arctic) where station density is low.
- Biases in DJF combine snow-albedo feedback issues with atmospheric circulation errors, making cause-and-effect separation difficult without further diagnostics.
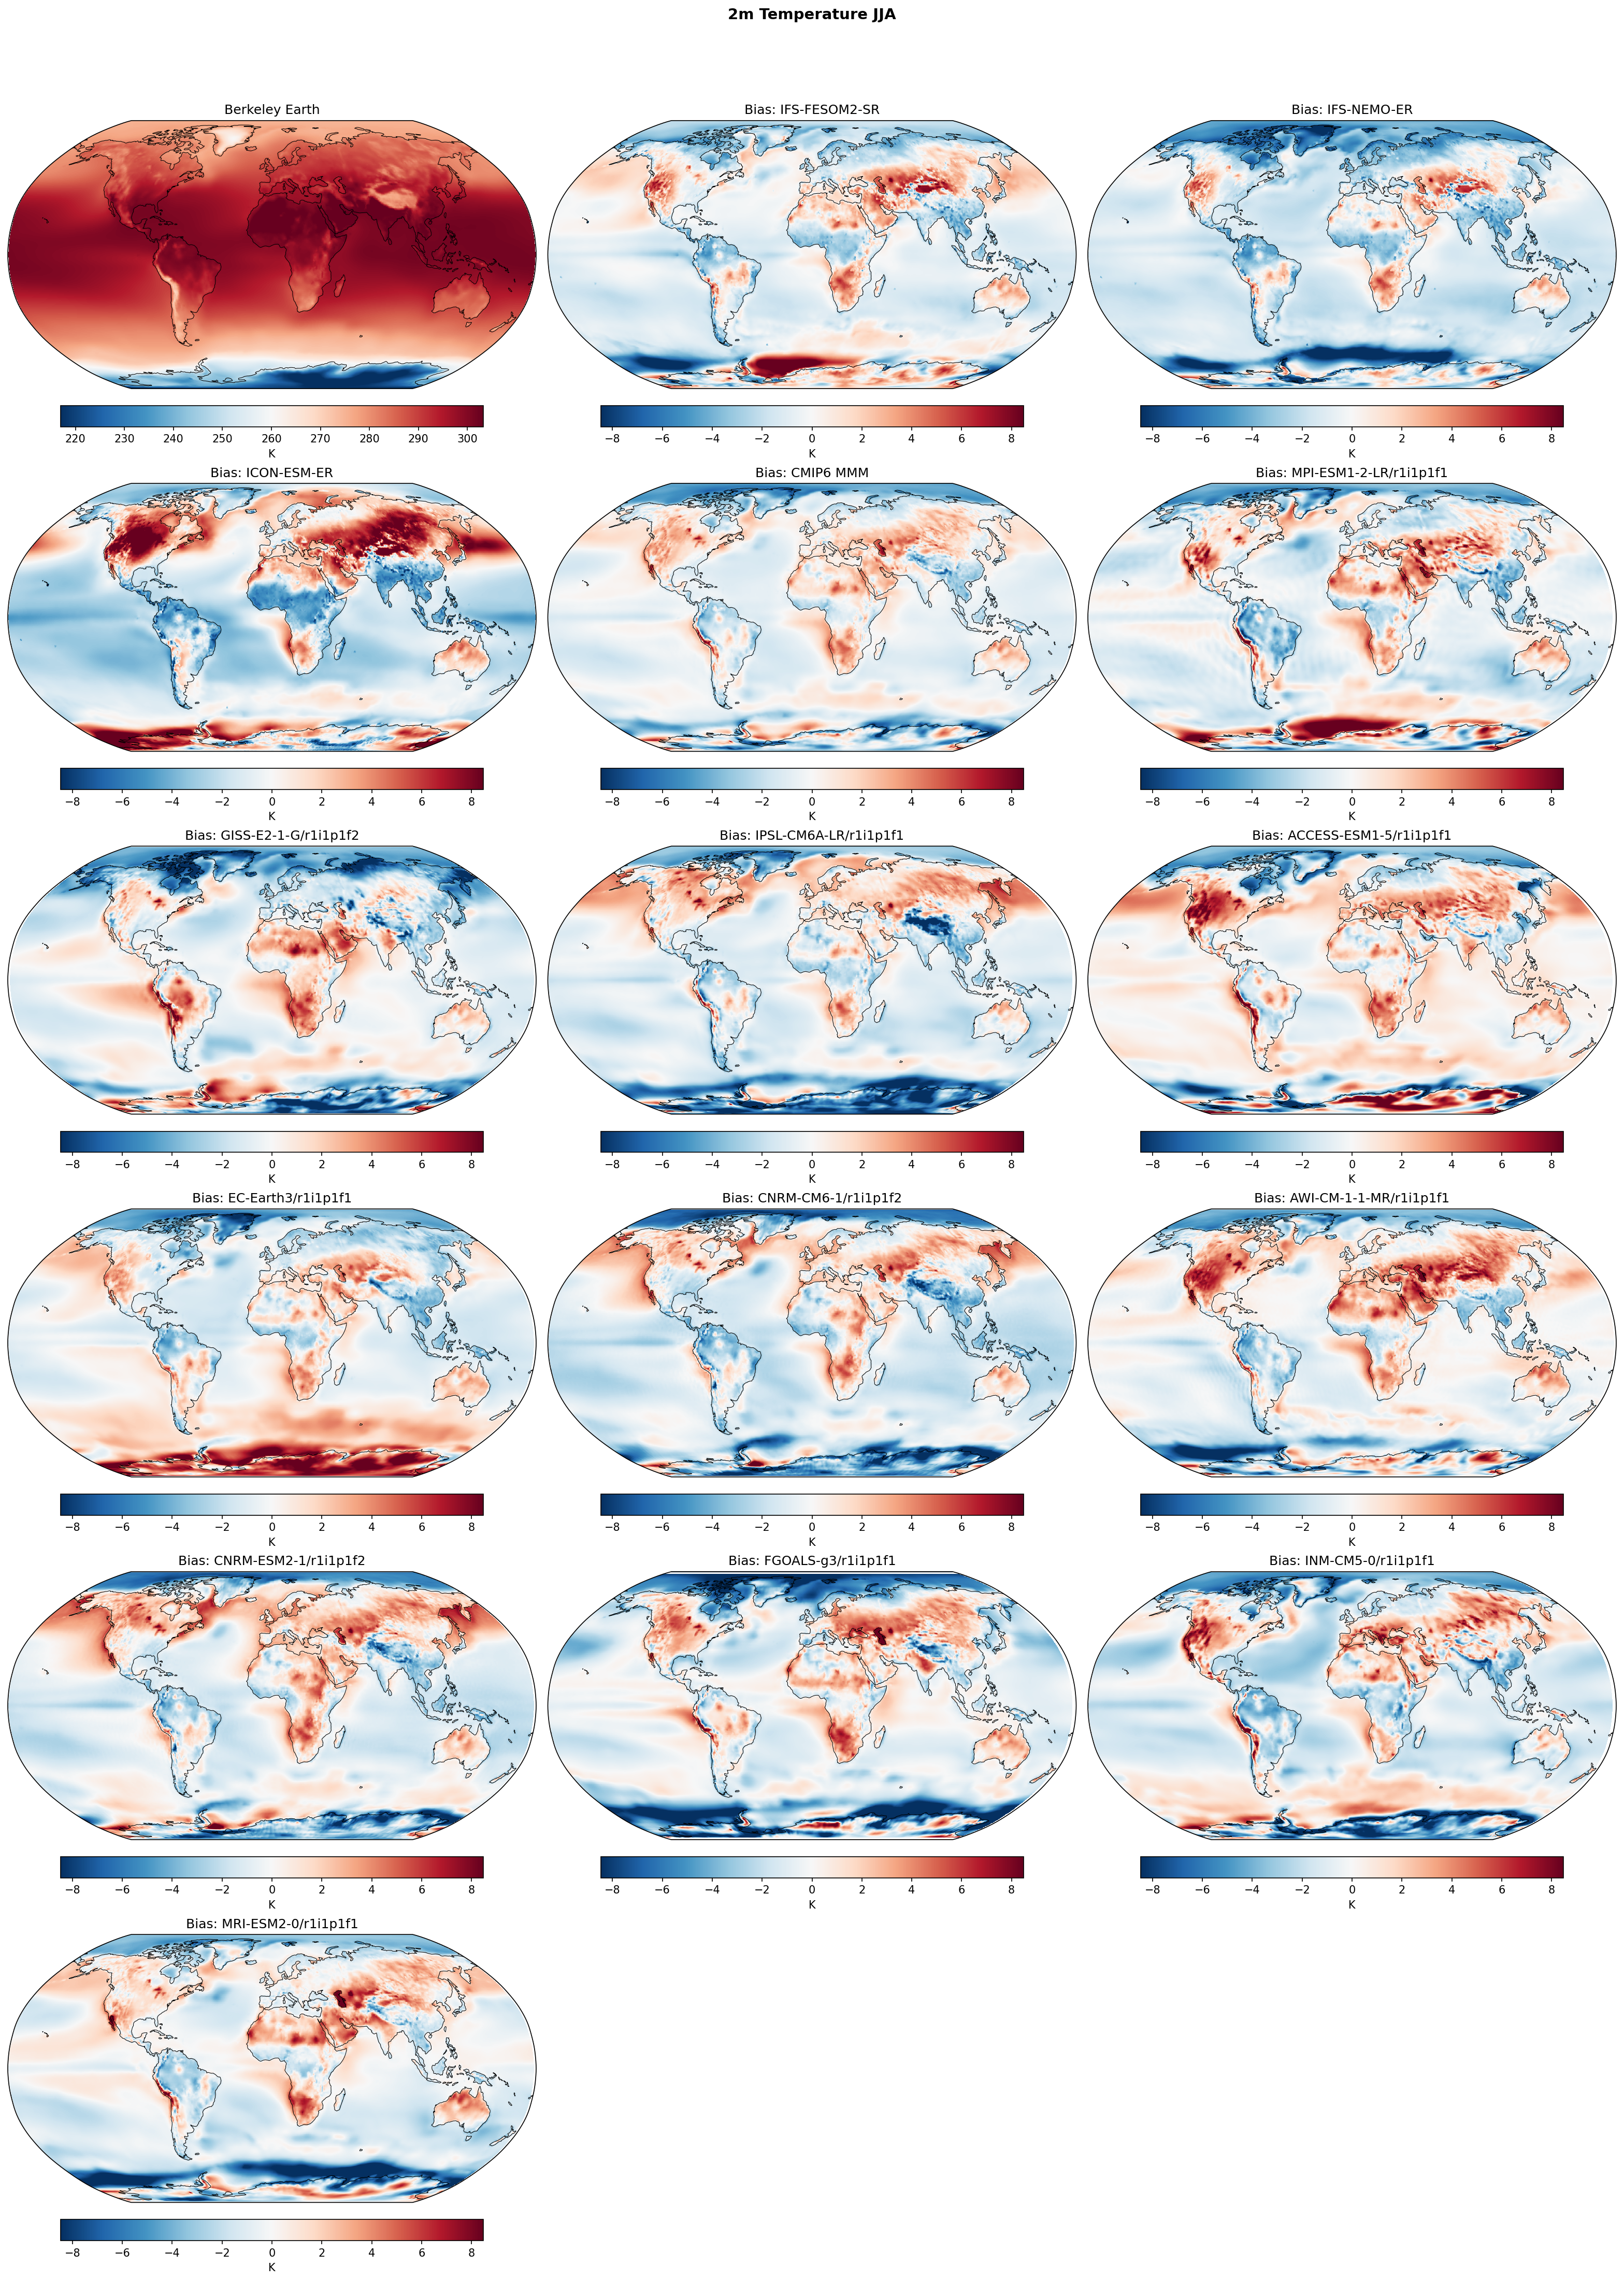
2m Temperature JJA Bias
| Variables | tas |
|---|---|
| Models | IFS-FESOM2-SR, IFS-NEMO-ER, ICON-ESM-ER, CMIP6 MMM, MPI-ESM1-2-LR/r1i1p1f1, GISS-E2-1-G/r1i1p1f2, IPSL-CM6A-LR/r1i1p1f1, ACCESS-ESM1-5/r1i1p1f1, EC-Earth3/r1i1p1f1, CNRM-CM6-1/r1i1p1f2, AWI-CM-1-1-MR/r1i1p1f1, CNRM-ESM2-1/r1i1p1f2, FGOALS-g3/r1i1p1f1, INM-CM5-0/r1i1p1f1, MRI-ESM2-0/r1i1p1f1 |
| Reference Dataset | Berkeley Earth |
| Units | K |
| Period | 1980–2014 |
Summary high
This figure evaluates June-July-August (JJA) 2-meter temperature biases relative to Berkeley Earth for three high-resolution EERIE models (IFS-FESOM2-SR, IFS-NEMO-ER, ICON-ESM-ER) compared against the CMIP6 Multi-Model Mean (MMM) and individual CMIP6 simulations.
Key Findings
- ICON-ESM-ER exhibits a distinct, severe warm bias (> 4-8 K) over high-latitude Northern Hemisphere continents (Canada, Siberia) during summer (JJA) and a strong cold bias over the Southern Ocean.
- IFS-FESOM2-SR and IFS-NEMO-ER show remarkably similar bias patterns, characterized by cold biases over the Southern Ocean and Antarctica, and moderate warm biases over Central Asia and North America.
- The high-resolution EERIE models generally reduce the warm sea surface temperature biases typically found in Eastern Boundary Upwelling Systems (off Peru, Namibia, California) compared to the CMIP6 ensemble.
Spatial Patterns
In the Northern Hemisphere summer, ICON-ESM-ER is an outlier with widespread continental warming, whereas IFS models are closer to observations but still warm in central continental interiors. In the Southern Hemisphere winter (JJA), all three EERIE models show strong circumpolar cold biases (-4 to -8 K) over the Southern Ocean and Antarctica, contrasting with the CMIP6 MMM which shows mixed or warm biases in the Antarctic region. The classic 'warm hole' bias in the North Atlantic is present in most models, including ICON and IFS.
Model Agreement
There is very high agreement between IFS-FESOM2-SR and IFS-NEMO-ER, indicating that the atmospheric component (IFS) or common resolution dictates the surface temperature bias structure more than the ocean formulation (unstructured vs. structured grid). ICON-ESM-ER diverges significantly from the IFS models over Northern Hemisphere land.
Physical Interpretation
The reduction of warm biases in coastal upwelling regions in the EERIE models compared to CMIP6 is a robust signature of increased ocean resolution (~10 km) resolving eddies and upwelling dynamics better than coarse models. The strong summer warm bias in ICON over land suggests deficiencies in land-atmosphere coupling, likely related to soil moisture deficits or insufficient cloud cover allowing excess solar heating. The cold Southern Ocean bias in EERIE models may result from sea-ice extent or ocean mixing parameterisations specific to the high-resolution setups.
Caveats
- Observational coverage in the Southern Ocean and Antarctica is sparse, increasing uncertainty in bias estimates for these regions.
- JJA represents summer in the NH and winter in the SH; seasonal biases may flip in DJF.
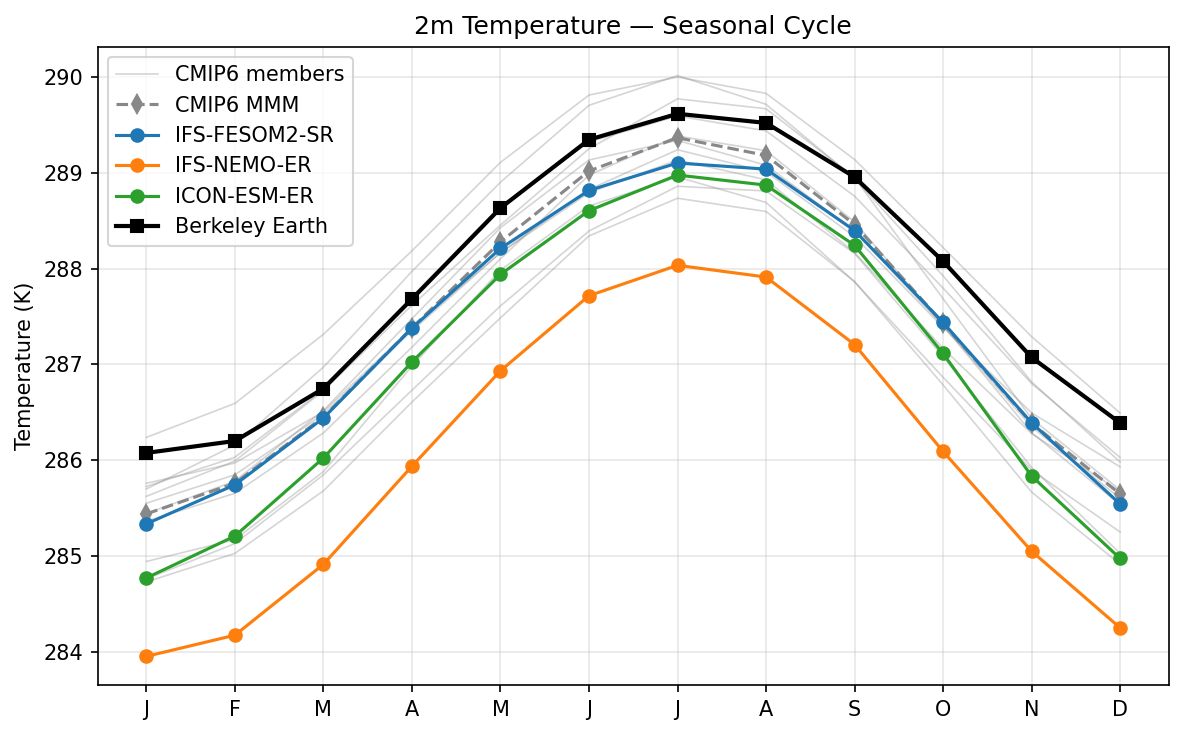
2m Temperature Seasonal Cycle
| Variables | tas |
|---|---|
| Models | IFS-FESOM2-SR, IFS-NEMO-ER, ICON-ESM-ER, MPI-ESM1-2-LR, GISS-E2-1-G, IPSL-CM6A-LR, ACCESS-ESM1-5, EC-Earth3, CNRM-CM6-1, AWI-CM-1-1-MR, CNRM-ESM2-1, FGOALS-g3, INM-CM5-0, MRI-ESM2-0 |
| Reference Dataset | Berkeley Earth |
| Units | K |
| Period | 1980–2014 |
Summary high
The figure illustrates the climatological seasonal cycle of global-mean 2m temperature, comparing three high-resolution models (IFS-FESOM2-SR, IFS-NEMO-ER, ICON-ESM-ER) against Berkeley Earth observations and the CMIP6 ensemble.
Key Findings
- All evaluated high-resolution models and the CMIP6 Multi-Model Mean (MMM) exhibit a systematic global cold bias relative to Berkeley Earth throughout the year.
- IFS-NEMO-ER is a significant outlier with a severe cold bias of approximately 1.5–2.0 K, falling well below the entire spread of the CMIP6 ensemble.
- IFS-FESOM2-SR performs best among the EERIE models, closely tracking the CMIP6 MMM, though both remain ~0.5–0.8 K cooler than observations.
- The models tend to overestimate the amplitude of the seasonal cycle compared to observations, primarily due to larger cold biases in the boreal winter (January) than in summer.
Spatial Patterns
The seasonal phase is consistent across all datasets, featuring a minimum in January (~286 K in obs) and a maximum in July (~290 K in obs), driven by Northern Hemisphere landmass dominance. However, the models exaggerate this amplitude; for instance, ICON-ESM-ER shows a seasonal range of ~4.2 K compared to the observed ~3.5 K.
Model Agreement
There is a notable divergence between the IFS configurations: IFS-FESOM2-SR aligns well with the CMIP6 MMM, whereas IFS-NEMO-ER is systematically ~2 K colder. ICON-ESM-ER falls between these two, sitting at the lower edge of the CMIP6 ensemble spread.
Physical Interpretation
The global seasonal cycle is driven by the asymmetry in land-ocean distribution, with Northern Hemisphere land heating dominating the July peak. The systematic cold bias across models, particularly IFS-NEMO-ER, suggests potential issues in global energy balance tuning (e.g., planetary albedo, cloud radiative effects) or ocean heat uptake. The larger amplitude in models suggests a stronger cooling response in boreal winter, possibly linked to sea-ice extent or snow cover feedbacks in the Northern Hemisphere.
Caveats
- Global means can obscure compensating regional biases (e.g., warm tropics vs. cold poles).
- Discrepancies may partially arise from differences in reference height definitions or the handling of data-sparse polar regions in the Berkeley Earth interpolation vs. model full fields.
Taylor Diagram — 2m Temperature
| Variables | tas |
|---|---|
| Models | IFS-FESOM2-SR, IFS-NEMO-ER, ICON-ESM-ER, CMIP6 MMM |
| Reference Dataset | Berkeley Earth |
| Units | K |
| Period | 1980–2014 |
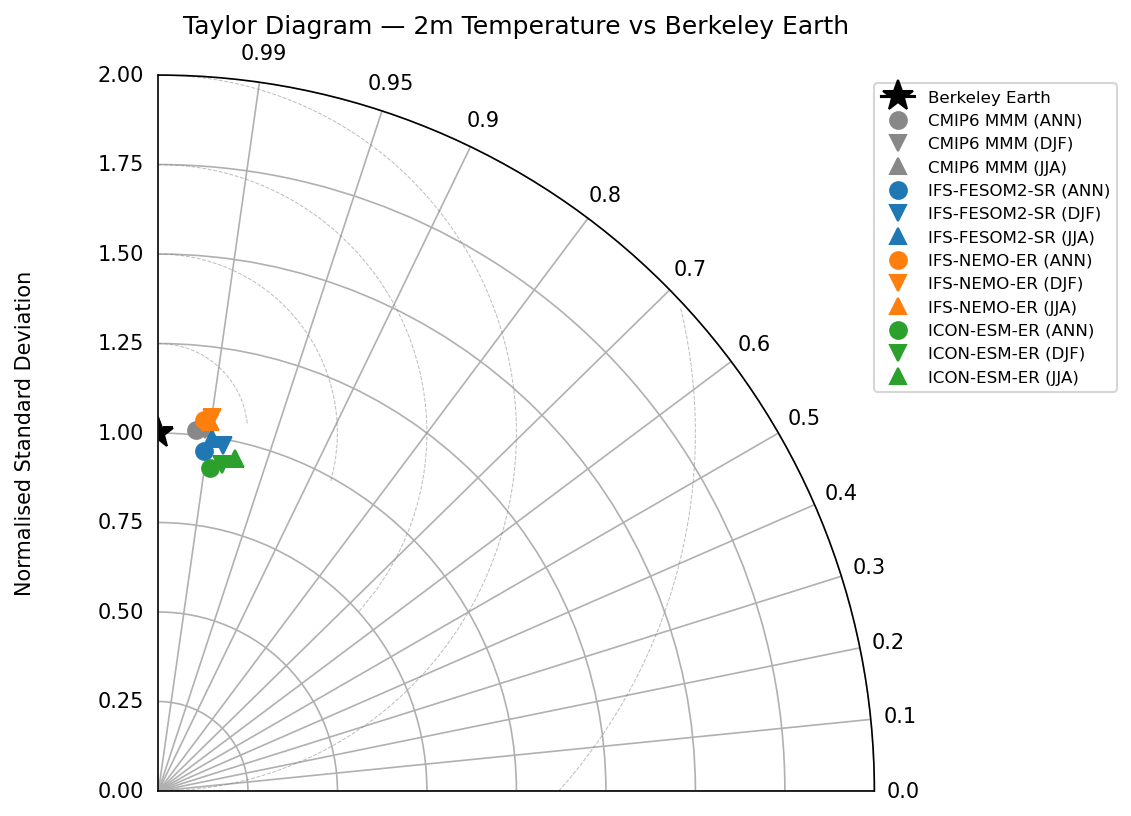
| IFS-FESOM2-SR_ANN | Corr: 0.99 · Std Ratio: 0.96 |
| IFS-FESOM2-SR_DJF | Corr: 0.98 · Std Ratio: 0.98 |
| IFS-FESOM2-SR_JJA | Corr: 0.99 · Std Ratio: 1.00 |
| IFS-NEMO-ER_ANN | Corr: 0.99 · Std Ratio: 1.04 |
| IFS-NEMO-ER_DJF | Corr: 0.99 · Std Ratio: 1.05 |
| IFS-NEMO-ER_JJA | Corr: 0.99 · Std Ratio: 1.04 |
| ICON-ESM-ER_ANN | Corr: 0.99 · Std Ratio: 0.91 |
| ICON-ESM-ER_DJF | Corr: 0.98 · Std Ratio: 0.93 |
| ICON-ESM-ER_JJA | Corr: 0.97 · Std Ratio: 0.96 |
Summary high
The Taylor diagram evaluates the spatial skill of 2m temperature climatologies against Berkeley Earth, revealing high pattern correlations (>0.97) for all models but distinct clustering based on spatial variability amplitude.
Key Findings
- All models achieve very high spatial correlations (>0.97) with observations, driven by the dominant pole-to-equator temperature gradient.
- IFS-NEMO-ER consistently overestimates spatial variability (normalized standard deviation ~1.04–1.05), whereas ICON-ESM-ER consistently underestimates it (~0.91–0.95).
- IFS-FESOM2-SR exhibits the best performance among the individual models for the JJA season, with a normalized standard deviation ratio near unity (0.998) and high correlation.
- The CMIP6 Multi-Model Mean (MMM) clusters tightly around the reference point, indicating that the ensemble average effectively cancels out individual model spatial errors.
Spatial Patterns
While the diagram abstracts spatial geography, the radial distribution indicates that IFS-NEMO-ER produces temperature fields with stronger spatial gradients (steeper pole-to-equator or land-sea contrasts) than observed, while ICON-ESM-ER produces flatter fields with reduced spatial variance.
Model Agreement
There is high inter-model agreement on the pattern phase (correlation), but significant divergence in pattern amplitude (standard deviation). IFS-based models (NEMO and FESOM2) generally outperform ICON-ESM-ER in capturing the correct magnitude of spatial variability.
Physical Interpretation
The high correlations are physically constrained by the solar forcing gradient. Deviations in normalized standard deviation likely reflect biases in the strength of the meridional temperature gradient (e.g., polar amplification biases) or the amplitude of land-sea temperature contrasts. ICON-ESM-ER's low standard deviation suggests a 'damped' climate with reduced gradients.
Caveats
- Global temperature Taylor diagrams are often dominated by the large-scale meridional gradient, potentially compressing results and masking significant regional biases.
- Comparing single high-resolution realizations against the CMIP6 ensemble mean (MMM) inherently favors the MMM due to error cancellation.
2m Temperature Global Mean Time Series
| Variables | tas |
|---|---|
| Models | IFS-FESOM2-SR, IFS-NEMO-ER, ICON-ESM-ER, MPI-ESM1-2-LR, GISS-E2-1-G, IPSL-CM6A-LR, ACCESS-ESM1-5, EC-Earth3, CNRM-CM6-1, AWI-CM-1-1-MR, CNRM-ESM2-1, FGOALS-g3, INM-CM5-0, MRI-ESM2-0 |
| Reference Dataset | Berkeley Earth |
| Units | K |
| Period | 1980–2014 |
Summary high
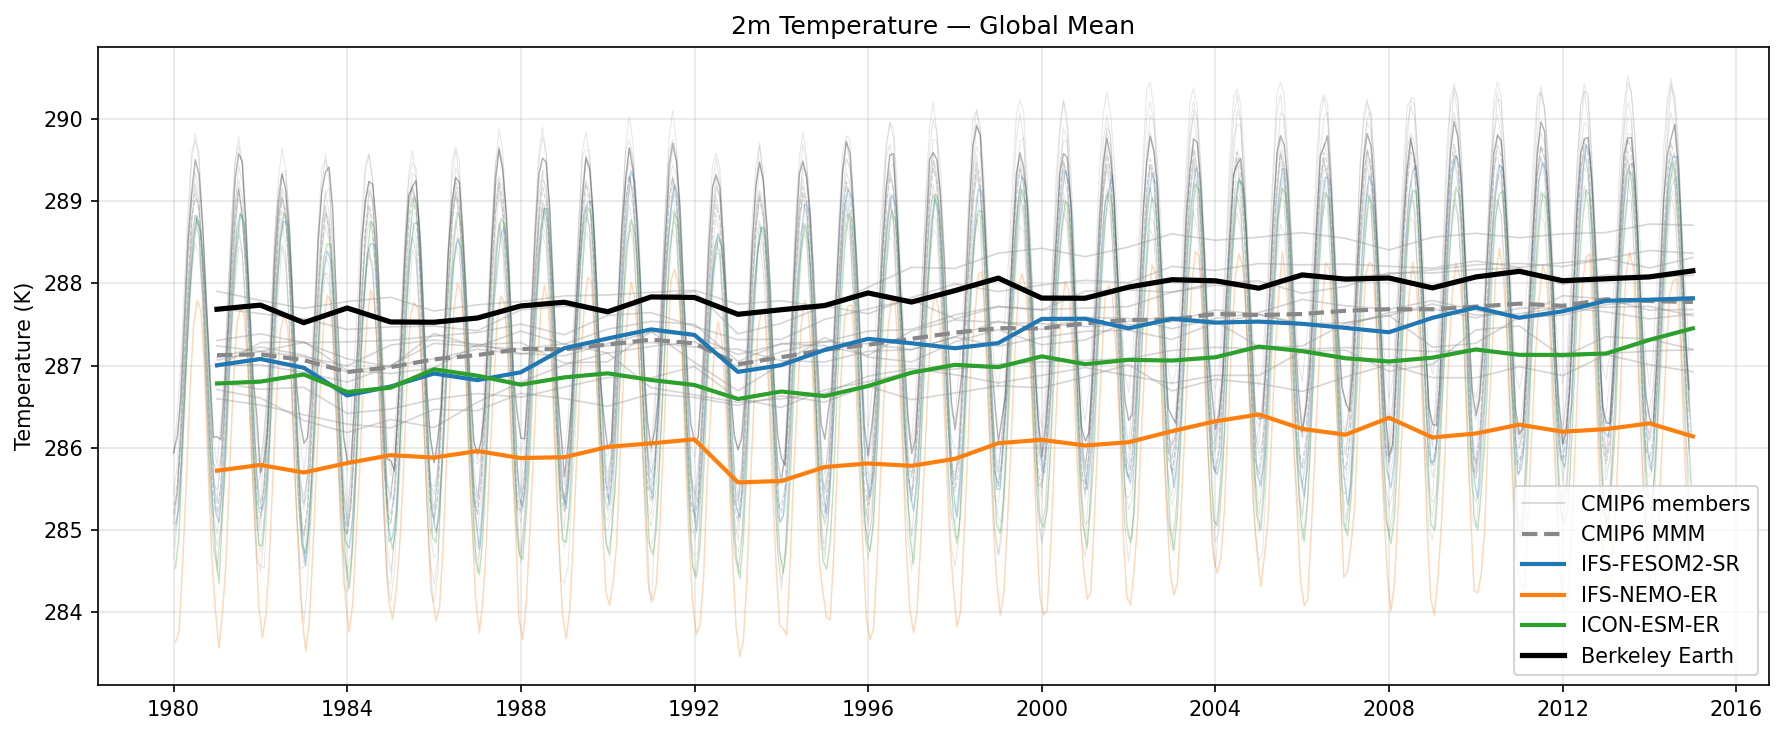
Time series analysis of global mean 2m temperature (1980–2014) comparing three high-resolution EERIE models against Berkeley Earth observations and the CMIP6 ensemble.
Key Findings
- All evaluated high-resolution models exhibit a systematic cold bias relative to Berkeley Earth observations.
- IFS-FESOM2-SR performs best among the high-res models, tracking the CMIP6 Multi-Model Mean closely with a bias of approximately -0.5 K relative to observations.
- IFS-NEMO-ER displays a severe cold bias of roughly -2 K, positioning it at the extreme lower bound of the CMIP6 ensemble spread.
- The radiative cooling response to the 1991 Mt. Pinatubo eruption is robustly captured across all models and observations.
Spatial Patterns
While the figure is a global time series, temporal patterns reveal that the seasonal cycle amplitude is consistent across models. Long-term warming trends are visible in all datasets, though IFS-NEMO-ER appears to show a slightly dampened warming rate compared to IFS-FESOM2-SR and observations.
Model Agreement
There is significant disagreement in the absolute mean state, with a ~1.5 K spread between the warmest (IFS-FESOM2-SR) and coldest (IFS-NEMO-ER) high-res models. However, the phase of seasonal and inter-annual variability (e.g., volcanic events) shows strong agreement.
Physical Interpretation
The pervasive cold bias suggests issues with the global energy budget, likely stemming from cloud radiative forcing (excessive reflection) or spin-up drift. The distinct offset of IFS-NEMO-ER compared to the other IFS configuration (IFS-FESOM2) implies that the ocean component or coupling strategy significantly impacts the equilibrium surface temperature state.
Caveats
- Absolute global mean temperature values are sensitive to the observational product chosen (Berkeley Earth), though the magnitude of the IFS-NEMO-ER bias exceeds typical observational uncertainty.
- The analysis is limited to global means, masking potential regional compensations between hemispheres or land/ocean domains.
2m Temperature Trends (Antarctic (<50°S))
| Variables | tas |
|---|---|
| Models | IFS-FESOM2-SR, IFS-NEMO-ER, ICON-ESM-ER, CMIP6 MMM |
| Reference Dataset | Berkeley Earth |
| Units | K |
| Period | 1980–2014 |
| Method | Linear OLS regression per grid point, x10 for K/decade |
Summary high
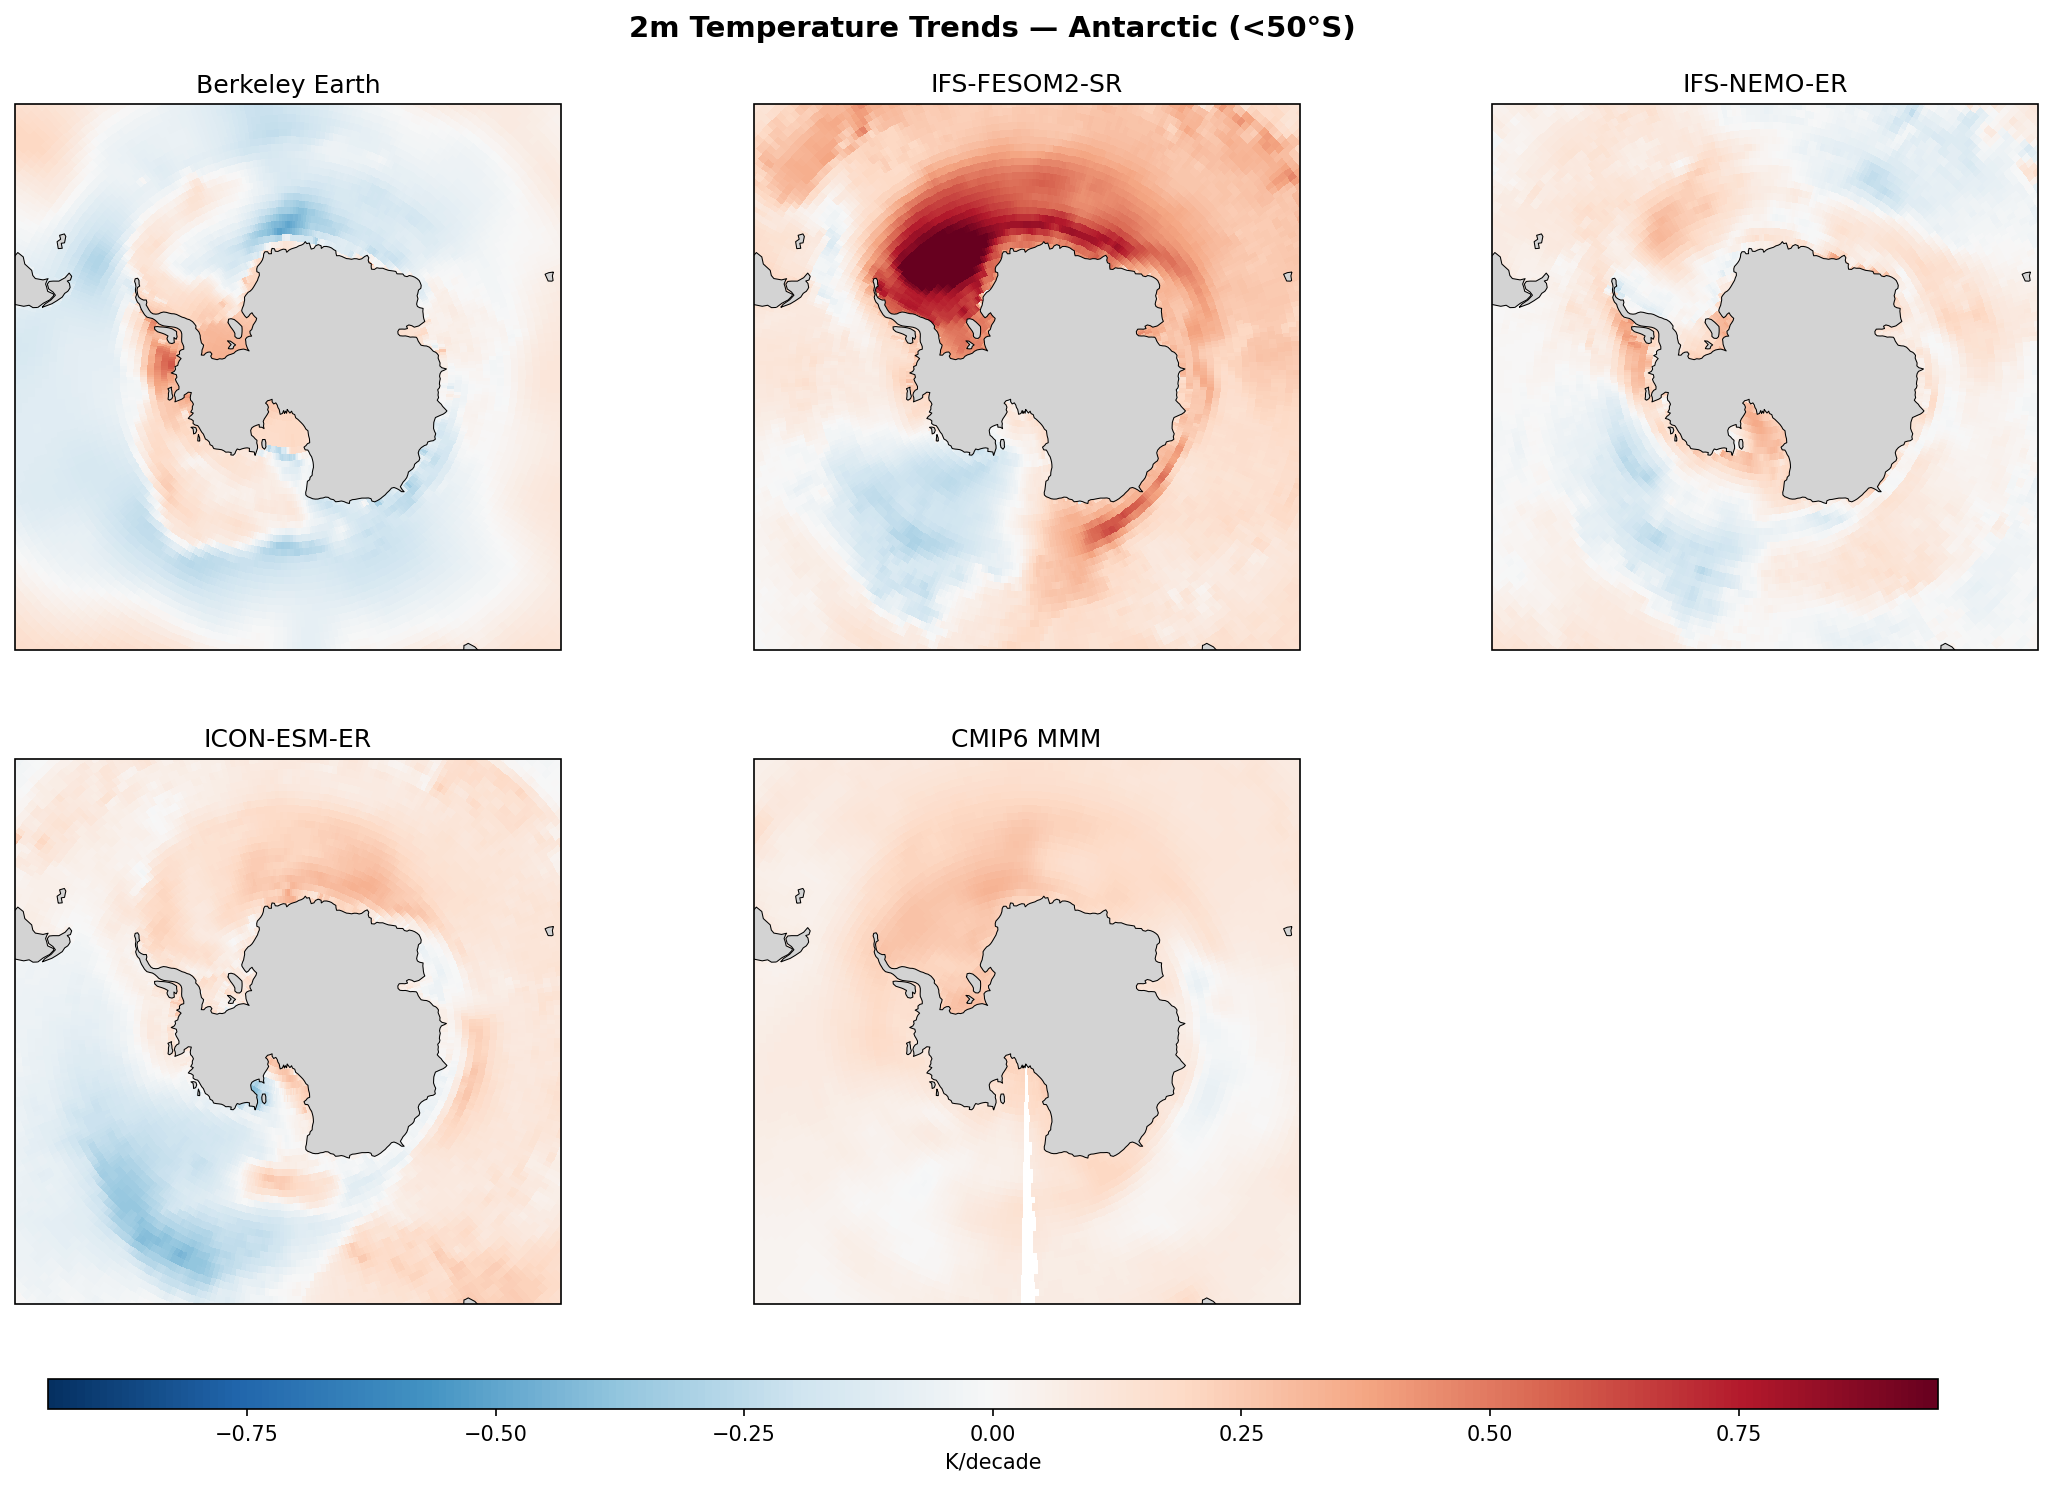
This figure displays linear trends in 2m temperature (K/decade) over the Antarctic and Southern Ocean (<50°S) for the period 1980–2014, comparing Berkeley Earth observations with three high-resolution coupled models and the CMIP6 multi-model mean.
Key Findings
- IFS-FESOM2-SR exhibits a massive, unrealistic warming trend (>0.9 K/decade) in the Weddell Sea, indicative of spurious deep convection or a persistent open-ocean polynya.
- Berkeley Earth observations show a complex pattern of weak warming and distinct regional cooling (particularly in the Pacific sector), reflecting the 'delayed warming' of the Southern Ocean during this period.
- The CMIP6 Multi-Model Mean (MMM) shows broad, uniform warming and fails to capture the observed regional cooling patches, likely due to ensemble averaging of internal variability.
- ICON-ESM-ER and IFS-NEMO-ER capture the spatial heterogeneity of trends better than CMIP6, including sectors of cooling (blue), though the specific locations and magnitudes of these internal variability features differ from observations.
Spatial Patterns
Observations show cooling in the Pacific sector (Amundsen/Bellingshausen seas) and weak warming near the Peninsula. IFS-FESOM2-SR is dominated by the intense Weddell Sea warming anomaly. ICON-ESM-ER displays a strong cooling trend in the Pacific sector similar to, but stronger than, observations. IFS-NEMO-ER shows a mixed pattern with weak anomalies, avoiding the extreme drift seen in FESOM.
Model Agreement
Inter-model agreement is low due to strong internal variability and the outlier behavior of IFS-FESOM2-SR. However, the high-resolution single realizations (IFS-NEMO, ICON) agree better with the *character* of observations (mixed warming/cooling) than the CMIP6 MMM, which shows only smooth warming.
Physical Interpretation
The extreme warming in IFS-FESOM2-SR is likely driven by a 'polynya mode' where the ocean stratification breaks down, bringing warm Circumpolar Deep Water to the surface and preventing sea ice formation. The cooling trends observed in reality and in ICON/IFS-NEMO are associated with wind-driven sea ice expansion and internal climate variability (e.g., SAM, IPO) specific to the 1980-2014 period, which the CMIP6 ensemble mean averages out.
Caveats
- Trends are computed over 1980–2014, a period where internal variability strongly influences Antarctic climate trends.
- Coupled models (unless nudged) are not expected to reproduce the exact phase of internal variability (e.g. specific cooling locations) seen in observations, only the statistical likelihood of such patterns.
2m Temperature Trends (Arctic (>50°N))
| Variables | tas |
|---|---|
| Models | IFS-FESOM2-SR, IFS-NEMO-ER, ICON-ESM-ER, CMIP6 MMM |
| Reference Dataset | Berkeley Earth |
| Units | K |
| Period | 1980–2014 |
| Method | Linear OLS regression per grid point, x10 for K/decade |
Summary high
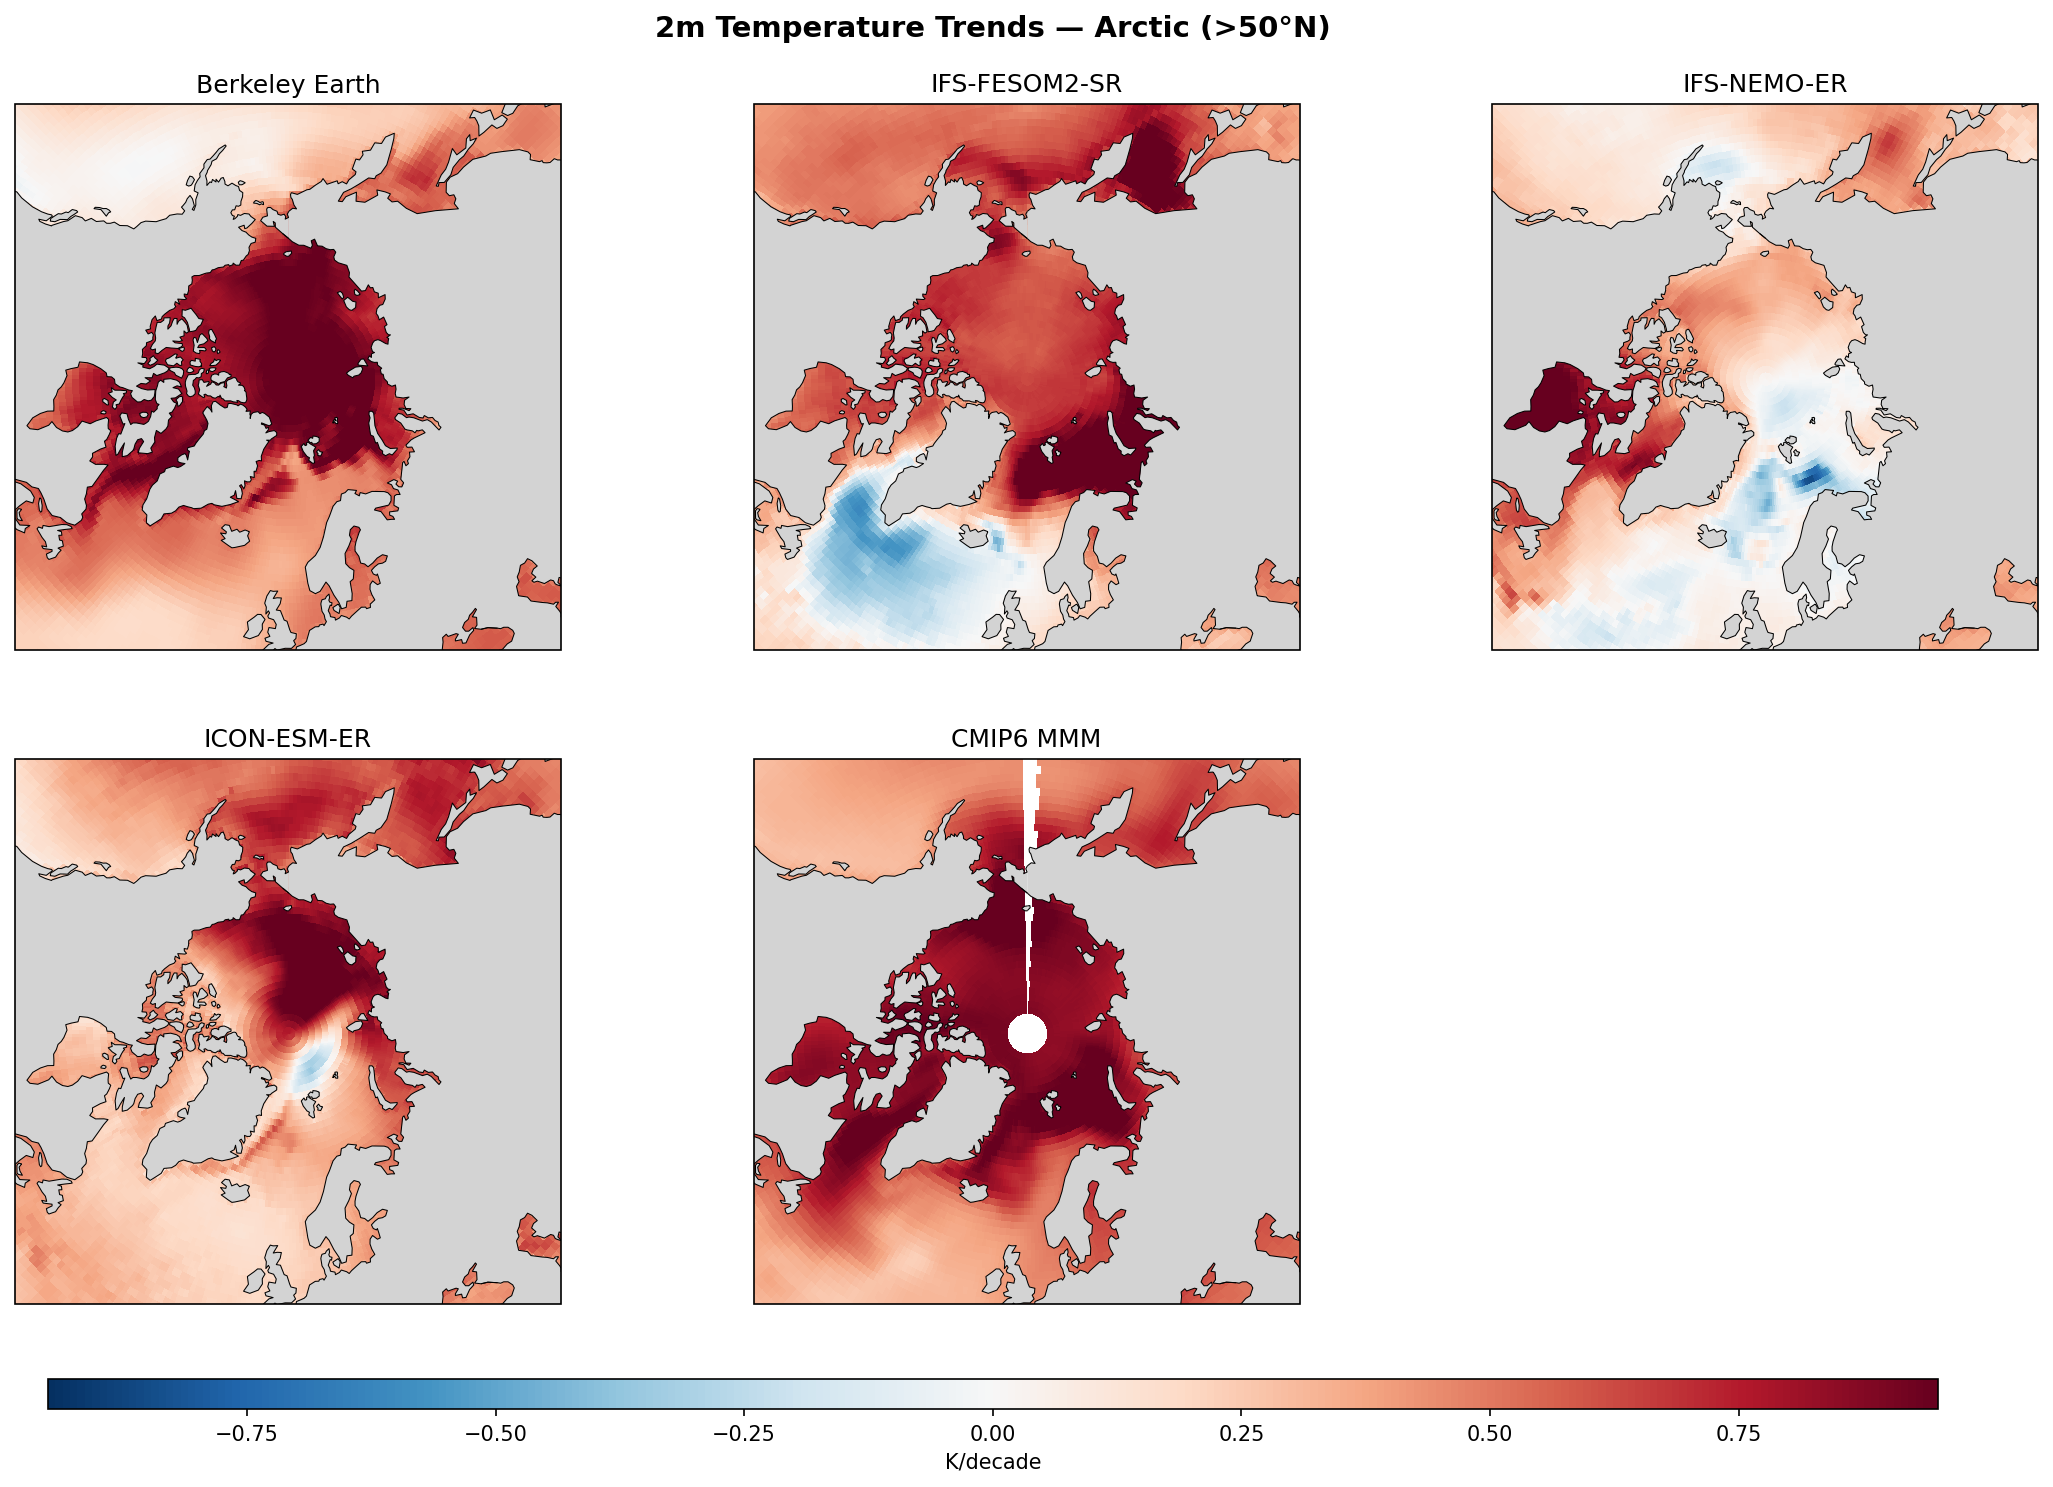
This figure compares linear trends in 2m temperature (1980–2014) across the Arctic (>50°N) from three high-resolution models and the CMIP6 multi-model mean against Berkeley Earth observations. While the CMIP6 MMM and IFS-FESOM2-SR capture the strong Arctic amplification seen in observations, IFS-NEMO-ER underestimates warming magnitudes, and ICON-ESM-ER exhibits an erroneous cooling trend in the Barents Sea sector.
Key Findings
- Berkeley Earth observations show pronounced Arctic amplification, with warming trends exceeding 0.75 K/decade centered on the Barents, Kara, and Laptev Seas.
- IFS-FESOM2-SR best reproduces the magnitude and spatial extent of the observed Arctic warming but displays a strong cooling trend (<-0.5 K/decade) in the North Atlantic subpolar gyre, significantly stronger than in observations.
- ICON-ESM-ER shows a distinct negative trend (cooling) in the Barents Sea region, a major discrepancy compared to the strong warming observed there (the 'Atlantification' signal).
- IFS-NEMO-ER significantly underestimates the magnitude of Arctic warming compared to both observations and the CMIP6 ensemble, showing largely neutral or weak trends in the sea-ice zones.
Spatial Patterns
Observations are dominated by strong positive trends (>0.75 K/decade) over the Arctic Ocean and moderate warming over land masses. A 'warming hole' (cooling trend) in the North Atlantic is prominently visible in IFS-FESOM2-SR but is weaker/neutral in observations and other models within this domain. ICON-ESM-ER shows a dipole of central Arctic warming versus Barents Sea cooling.
Model Agreement
The CMIP6 Multi-Model Mean provides the closest match to the smooth, widespread warming pattern of Berkeley Earth. Among the high-res models, inter-model disagreement is high: IFS-FESOM2-SR over-accentuates North Atlantic cooling; ICON-ESM-ER fails in the Barents Sea; and IFS-NEMO-ER is generally too insensitive to Arctic amplification forcing.
Physical Interpretation
The strong warming in the Barents/Kara Seas in observations and IFS-FESOM2-SR is driven by sea-ice loss and the 'Atlantification' of the Arctic Ocean (inflow of warm Atlantic water). The failure of ICON-ESM-ER to capture this (showing cooling instead) suggests potential biases in sea ice retreat or ocean heat transport pathways. The North Atlantic cooling in IFS-FESOM2-SR is a classic signature of AMOC (Atlantic Meridional Overturning Circulation) slowdown, suggesting this model may have a more sensitive or rapidly declining overturning circulation over the historical period compared to others.
Caveats
- The 1980–2014 period is relatively short for trend analysis in the presence of strong internal variability (e.g., NAO, AMO).
- The cooling in the North Atlantic in IFS-FESOM2-SR might be an initialization shock or drift rather than a forced response, requiring inspection of the full time series.
2m Temperature Warming Trends
| Variables | tas |
|---|---|
| Models | IFS-FESOM2-SR, IFS-NEMO-ER, ICON-ESM-ER, CMIP6 MMM |
| Reference Dataset | Berkeley Earth |
| Units | K |
| Period | 1980–2014 |
| Method | Linear OLS regression per grid point, x10 for K/decade |
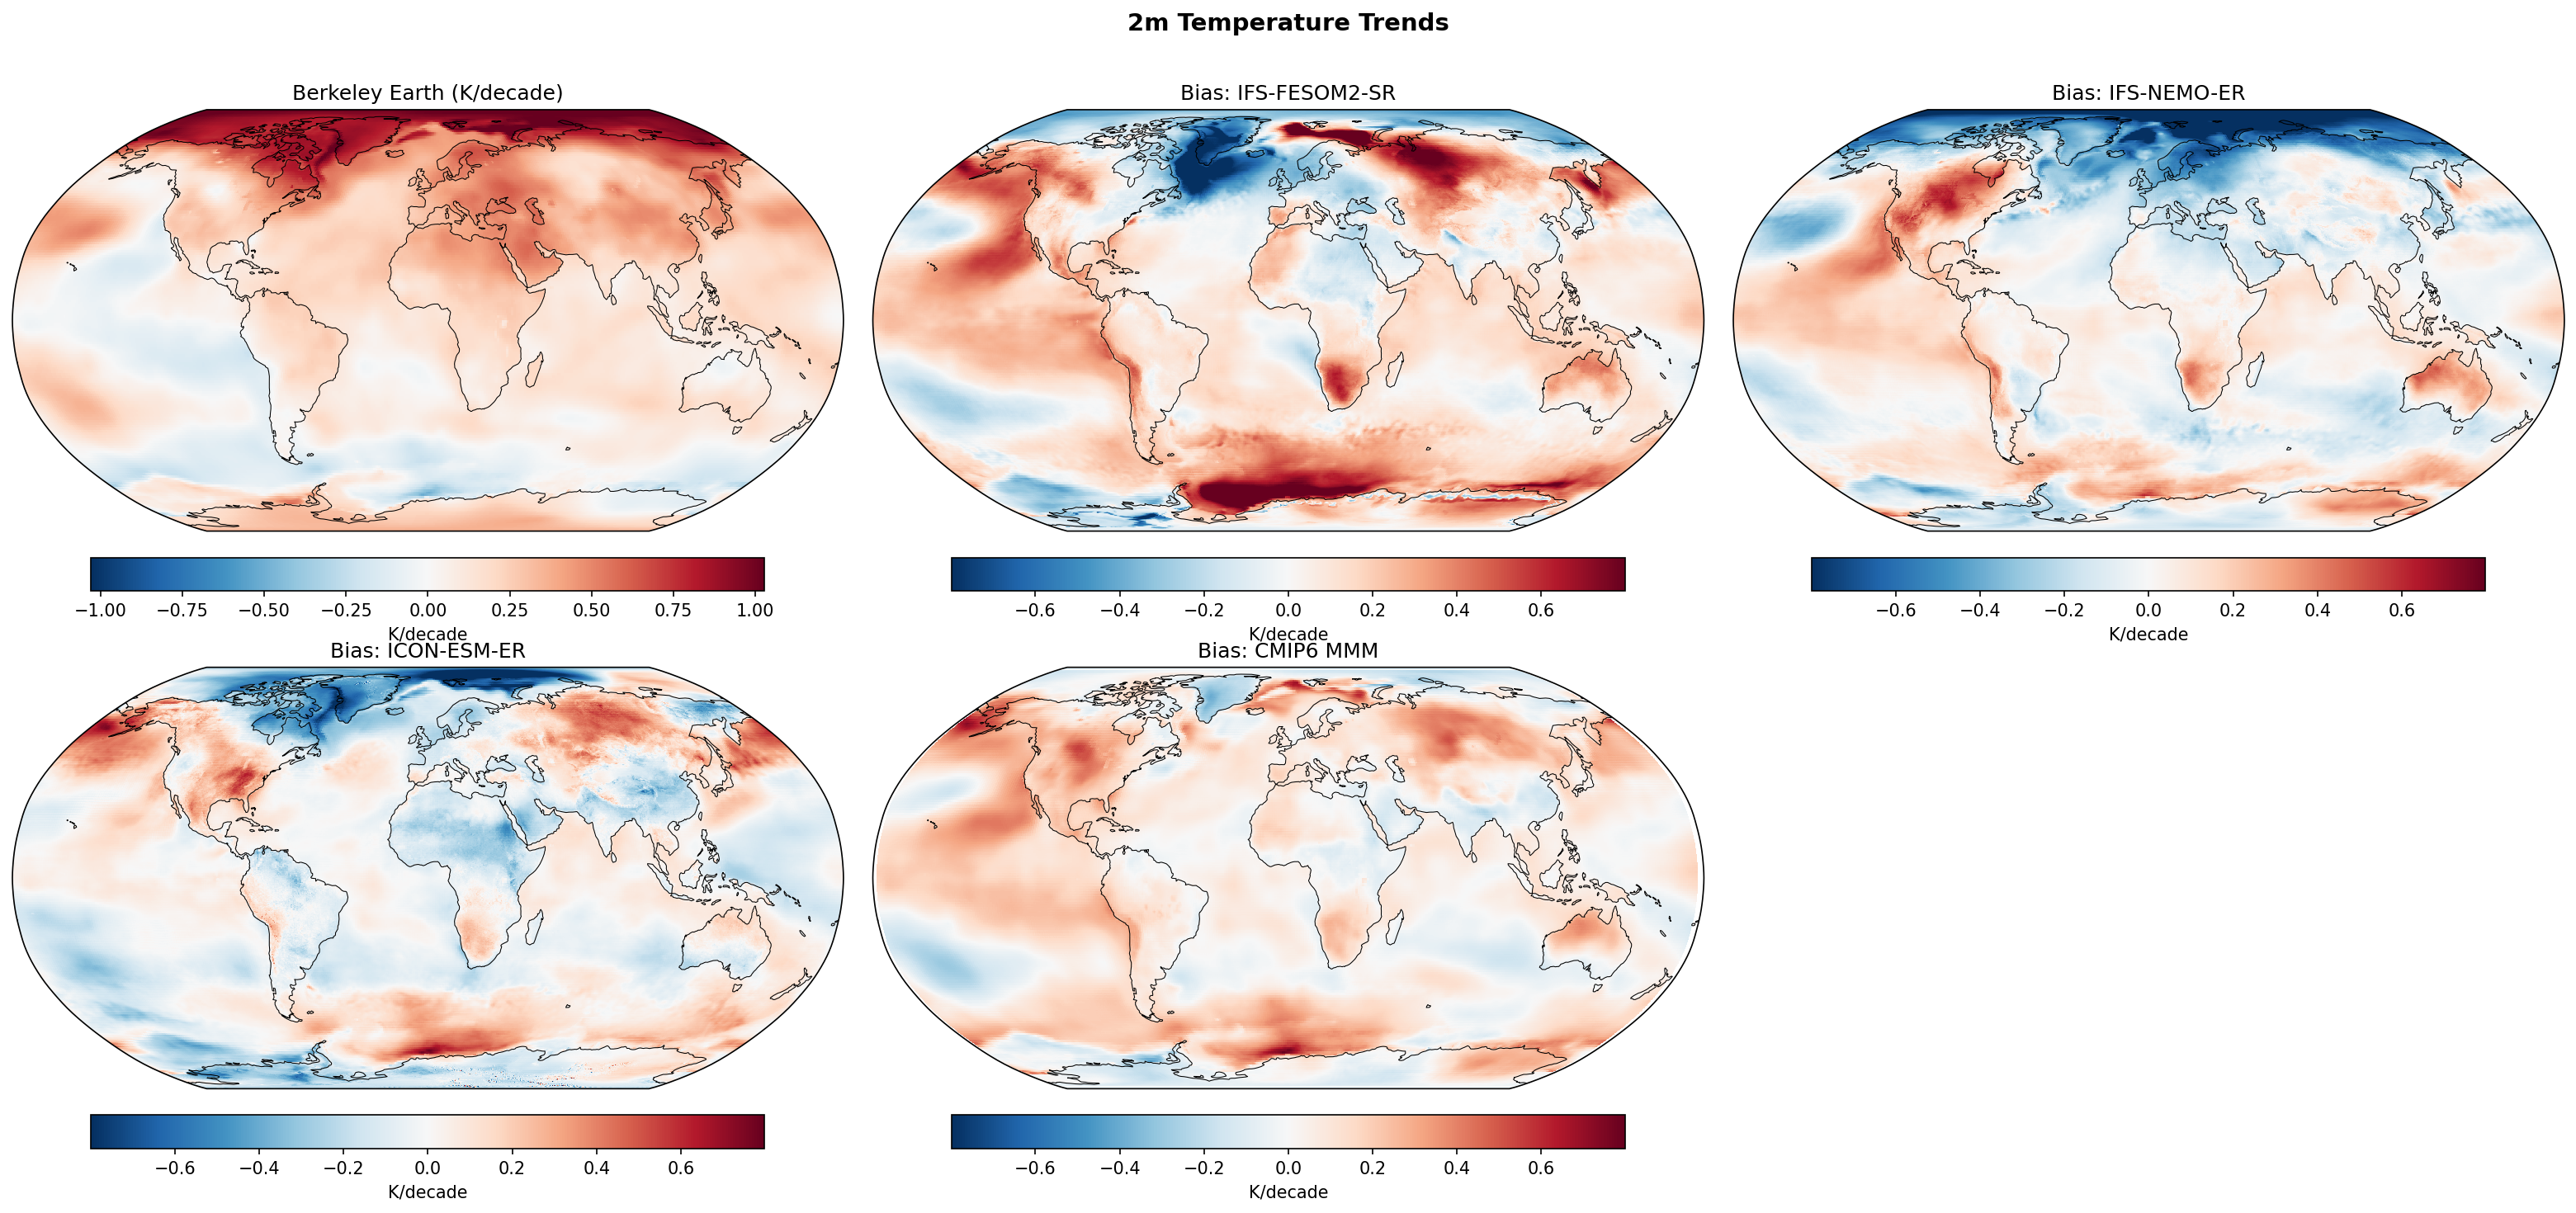
Summary high
This figure compares 1980–2014 linear 2m temperature trends from Berkeley Earth observations against biases in three high-resolution models (IFS-FESOM2-SR, IFS-NEMO-ER, ICON-ESM-ER) and the CMIP6 multi-model mean. While all datasets capture Arctic amplification, the models exhibit distinct regional bias patterns, particularly over Northern Hemisphere land masses and the North Atlantic.
Key Findings
- Berkeley Earth observations show strong Arctic amplification (>0.75 K/decade), general continental warming, and localised cooling in the Southern Ocean and parts of the North Atlantic.
- IFS-FESOM2-SR and IFS-NEMO-ER significantly overestimate warming trends (positive bias >0.4 K/decade) over high-latitude continents (Eurasia, North America) and the Southern Ocean.
- ICON-ESM-ER displays a widespread negative trend bias (underestimated warming) over tropical and subtropical land masses, particularly Africa, South America, and India.
- A notable 'cold bias' exists in the North Atlantic warming hole region across the high-resolution models (strongest in IFS-FESOM2-SR), indicating they simulate stronger cooling or weaker warming there than observed.
- The CMIP6 MMM shows a distinct positive trend bias in the eastern tropical Pacific and Southern Ocean, reflecting the common model difficulty in capturing observed cooling trends in these regions.
Spatial Patterns
The observations are dominated by polar amplification and land-sea warming contrast. The models introduce regional dipoles: IFS models show a 'warm-continent/cold-North Atlantic' bias pattern in the Northern Hemisphere. ICON introduces a 'cool-tropics' bias pattern. The Southern Ocean consistently shows a warm bias (red) in IFS models and CMIP6, contrasting with the observed cooling trend.
Model Agreement
The two IFS-based models (NEMO and FESOM) show high agreement in their bias structures (overheating NH high latitudes), suggesting the atmospheric component dominates these errors. ICON diverges significantly with its suppression of warming over tropical land. None of the high-resolution models fully replicate the observed trend pattern in the Pacific, though they differ from the smooth positive bias seen in the CMIP6 MMM.
Physical Interpretation
The strong positive bias in high-latitude land warming in IFS models may suggest excessive snow-albedo feedback or issues with stable boundary layer parameterisations. The negative bias in the North Atlantic likely reflects a too-strong AMOC slowdown or internal variability phasing (AMV) producing a deep 'warming hole' relative to observations. The warm bias in the Southern Ocean is a longstanding coupled model issue, often attributed to cloud phase errors (lack of supercooled liquid) or insufficient ocean heat uptake efficiency.
Caveats
- Trends calculated over 35 years (1980-2014) are sensitive to internal climate variability (e.g., IPO, AMO), which is not phased with observations in free-running simulations.
- Observational coverage in the Southern Ocean and Arctic is sparser, increasing uncertainty in the reference trends for these regions.
2m Temperature Zonal Mean Profile
| Variables | tas |
|---|---|
| Models | CMIP6 MMM, IFS-FESOM2-SR, IFS-NEMO-ER, ICON-ESM-ER |
| Reference Dataset | Berkeley Earth |
| Units | K |
| Period | 1980–2014 |
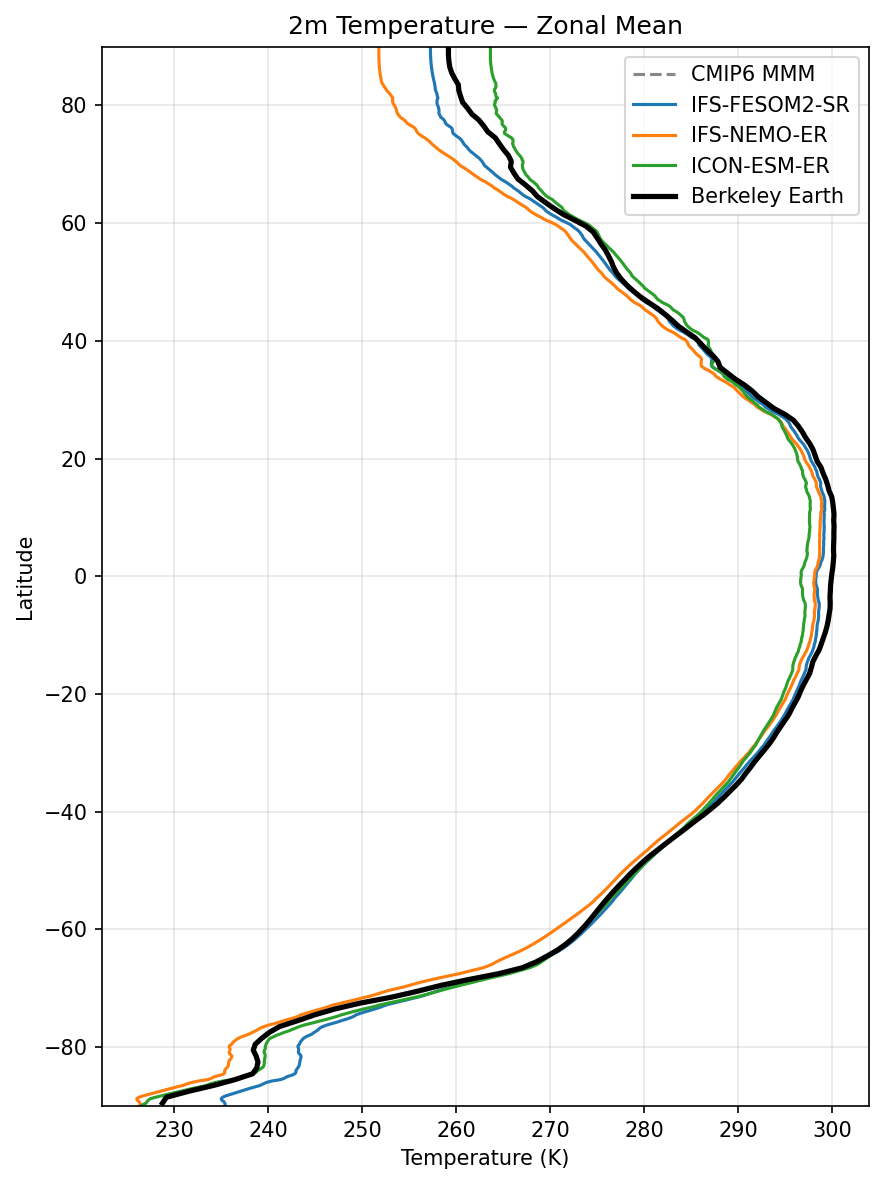
Summary high
This figure presents the zonal mean 2m temperature climatology (1980–2014) for three high-resolution coupled models compared to Berkeley Earth observations and the CMIP6 multi-model mean. While the global meridional gradient is generally captured, the models exhibit distinct systematic biases, most notably a divergence in the Arctic and a pervasive cold bias in the tropics.
Key Findings
- **Arctic Divergence (>60°N):** There is significant inter-model disagreement in the Arctic. ICON-ESM-ER exhibits a strong warm bias (approx. +5 to +8 K at 80°N), whereas IFS-NEMO-ER shows a substantial cold bias (approx. -5 to -8 K). IFS-FESOM2-SR tracks observations most closely in this region but remains slightly cold.
- **Tropical Cold Bias (30°S–30°N):** All three models underestimate tropical temperatures. ICON-ESM-ER has the most severe bias (~2–3 K cooler than observations at the equator), while the two IFS configurations are cooler by ~1 K.
- **Southern Hemisphere:** Biases are smaller but evident. IFS-NEMO-ER is warm-biased over the Southern Ocean (60°S–70°S), likely indicating reduced sea ice or warm SSTs. IFS-FESOM2-SR shows a localized warm bias over the Antarctic continent (~80°S).
- **NH Mid-latitude Separation:** North of 40°N, IFS-NEMO-ER separates from the other models, becoming systematically colder than observations, contributing to a steeper meridional gradient in the NH.
Spatial Patterns
The temperature profiles follow the expected decreasing trend from equator to poles. The inter-model spread is minimized in the southern mid-latitudes (30°S–50°S) and maximized in the Arctic (>70°N). The Northern Hemisphere exhibits larger model spread than the Southern Hemisphere.
Model Agreement
Agreement is poorest in the Arctic. In the tropics, models agree on the sign of the error (negative/cold) but differ in magnitude. IFS-FESOM2-SR generally provides the best match to Berkeley Earth across the widest latitude range, though it shares the tropical cold bias. The CMIP6 MMM (grey dashed) appears to track observations closely, suggesting these individual high-res runs may have larger biases than the ensemble mean.
Physical Interpretation
The Arctic warm bias in ICON-ESM-ER suggests issues with sea ice formation (insufficient ice extent/thickness) or cloud radiative feedbacks trapping heat. Conversely, the cold Arctic in IFS-NEMO-ER implies extensive sea ice or insufficient northward heat transport. The pervasive tropical cold bias is consistent with the common 'cold tongue bias' in coupled models or excessive low-level cloudiness reflecting shortwave radiation. The reduced equator-to-pole temperature gradient in ICON-ESM-ER (cold tropics, warm Arctic) could impact the strength of the mid-latitude jet streams.
Caveats
- Zonal averaging masks zonal asymmetries, such as land-ocean contrasts or specific regional biases (e.g., North Atlantic vs. North Pacific).
- The analysis is based on a climatological mean and does not evaluate seasonal variability or trends.