Ocean 3d Ocean Evaluation (EN4)
Synthesis
Related diagnostics
Salinity Depth-Layer Time Series
| Variables | thetao, so |
|---|---|
| Models | IFS-FESOM2-SR, IFS-NEMO-ER, ICON-ESM-ER, EN4 |
| Reference Dataset | EN4 v4.2.2 |
| Units | K |
| Period | 1980–2014 |
Summary high
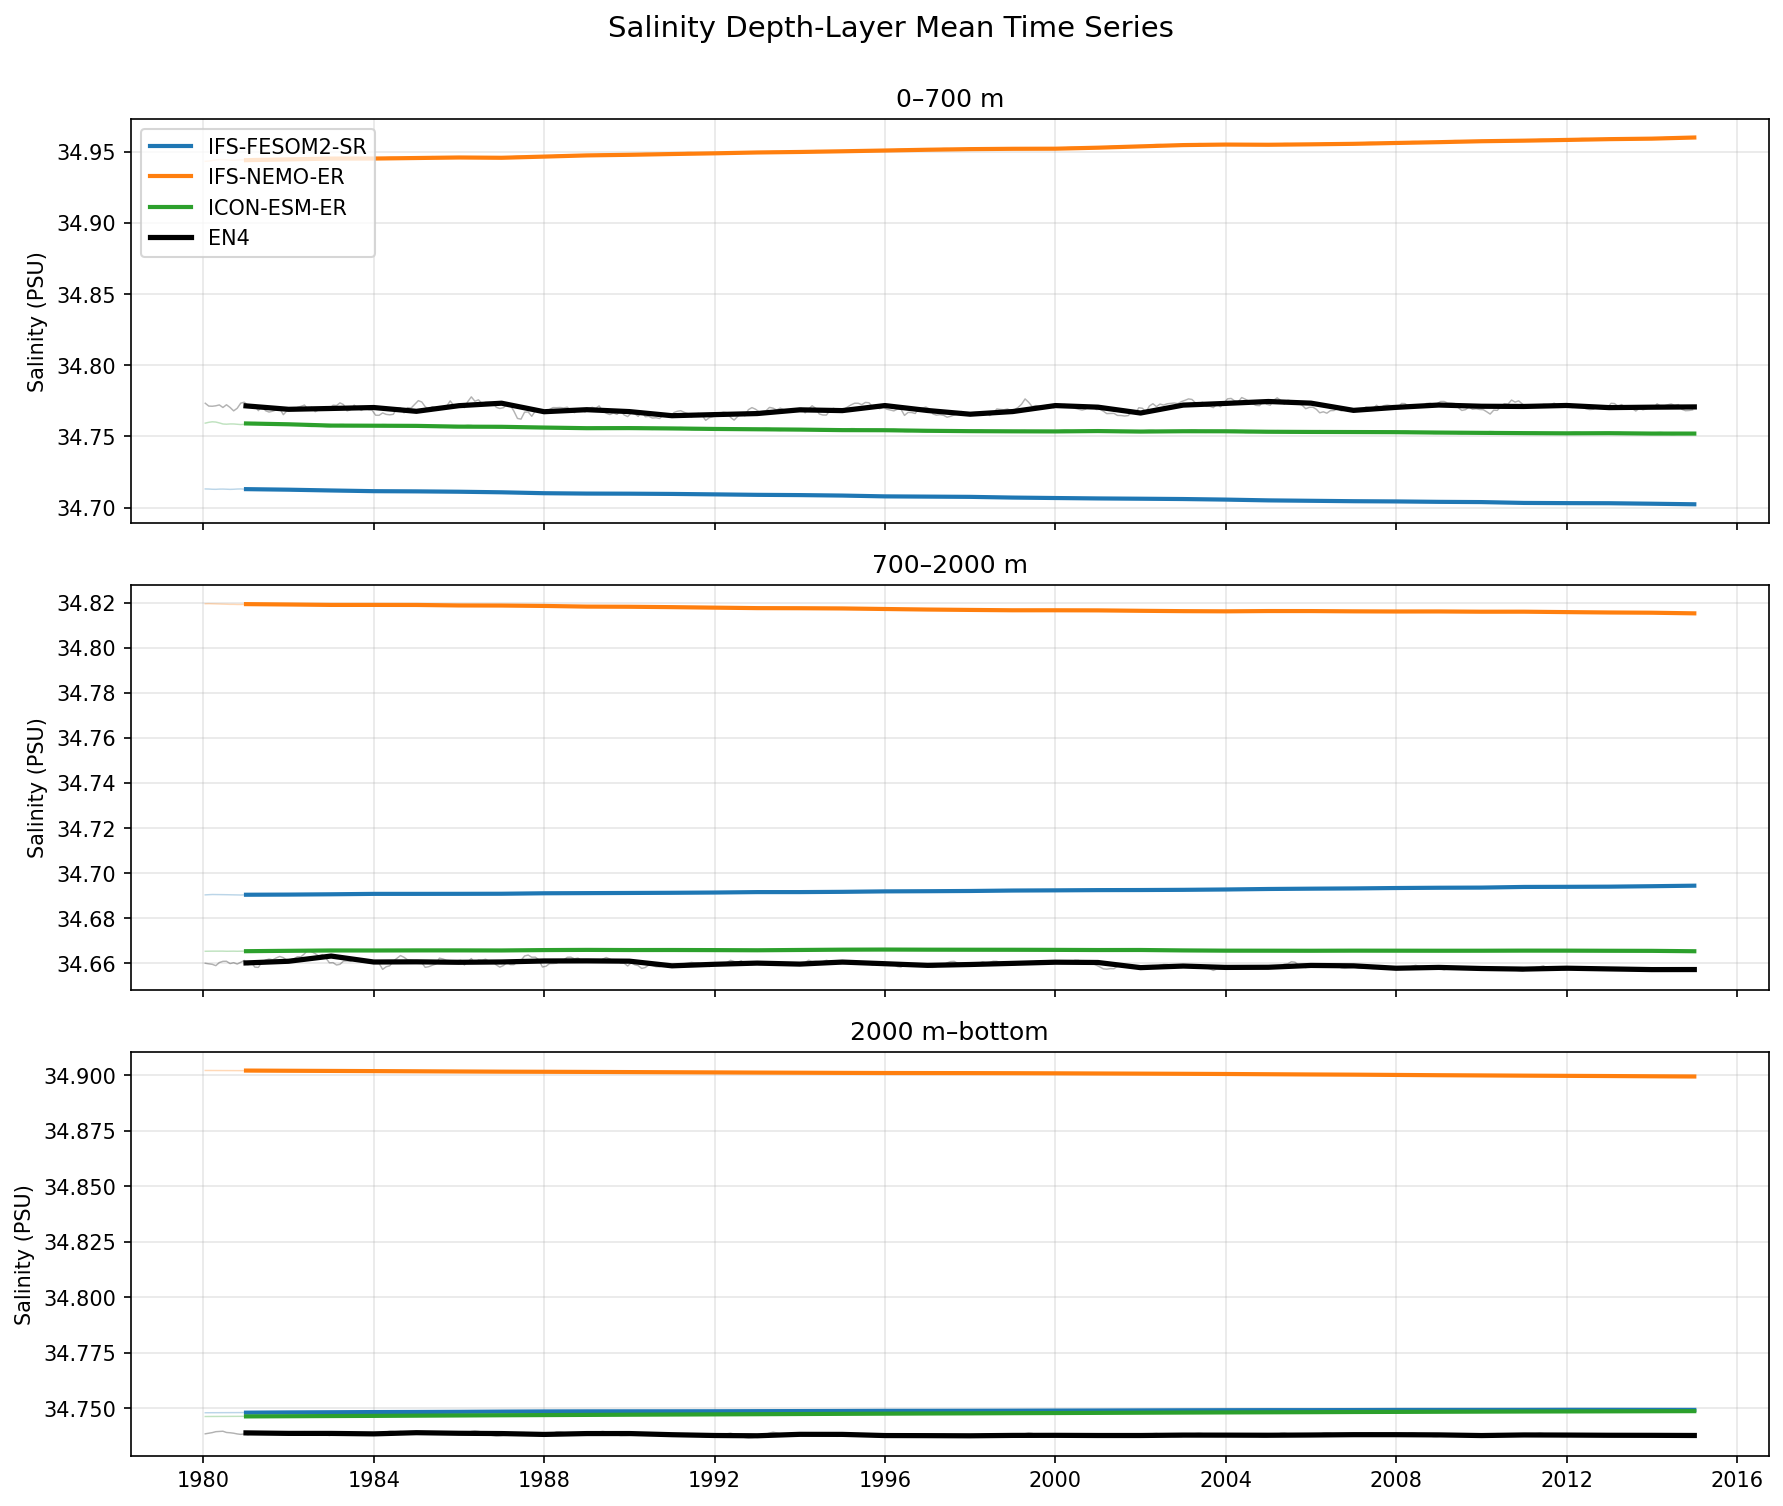
This figure presents time series of global volume-weighted mean salinity for three models (IFS-FESOM2-SR, IFS-NEMO-ER, ICON-ESM-ER) compared to EN4 v4.2.2 observations across three depth layers (0–700 m, 700–2000 m, 2000 m–bottom) from 1980 to 2015. The most striking feature is a large, systematic positive salinity bias in IFS-NEMO-ER across all depths, whereas ICON-ESM-ER demonstrates remarkable agreement with observations.
Key Findings
- IFS-NEMO-ER exhibits a substantial positive salinity bias (~0.15–0.18 PSU) throughout the entire water column relative to EN4, present from the start of the simulation.
- ICON-ESM-ER shows excellent agreement with observational mean salinity, particularly in the intermediate (700–2000 m) and deep (>2000 m) layers, where it is nearly indistinguishable from EN4 and exhibits minimal drift.
- IFS-FESOM2-SR displays a fresh bias (~-0.07 PSU) and a gradual freshening drift in the upper ocean (0–700 m), but converges well with observations and ICON in the deep ocean (>2000 m).
- Observational salinity in EN4 is relatively stable globally; IFS-NEMO-ER shows a slight salinifying drift in the upper ocean, exacerbating its initial bias.
Spatial Patterns
Vertically, IFS-NEMO-ER's positive bias is pervasive from surface to bottom. IFS-FESOM2-SR shows vertical structure in its bias: negative in the upper ocean, slightly positive in the intermediate layer, and neutral in the deep ocean. ICON-ESM-ER maintains high accuracy throughout the depth profile.
Model Agreement
There is significant disagreement in the global mean salinity state. IFS-NEMO-ER is a distinct outlier with high salinity. ICON-ESM-ER and IFS-FESOM2-SR are much closer to observations, with ICON showing superior stability and absolute accuracy.
Physical Interpretation
The large, time-invariant offset in IFS-NEMO-ER suggests an initialization mismatch (starting from a more saline climatology) or a fundamental unclosed freshwater budget issue. The freshening drift in the upper ocean of IFS-FESOM2-SR points to a surface freshwater flux imbalance (excess precipitation/runoff or ice melt). The stability of ICON-ESM-ER implies a well-balanced global freshwater budget (Evaporation minus Precipitation ≈ 0) and accurate initialization.
Caveats
- Global volume-weighted means can mask significant regional biases (e.g., compensating fresh/saline biases between Atlantic and Pacific basins).
- The large initial offsets at 1980 suggest differences in spin-up procedures or initial condition datasets rather than solely model drift.
- Deep ocean observational data (EN4) is sparse prior to the Argo era (~2005), increasing uncertainty in the reference line for the pre-2000 period.
Salinity Hovmoller (first-timestep anomaly)
| Variables | thetao, so |
|---|---|
| Models | IFS-FESOM2-SR, IFS-NEMO-ER, ICON-ESM-ER |
| Reference Dataset | EN4 v4.2.2 |
| Units | K |
| Period | 1980–2014 |
Summary high
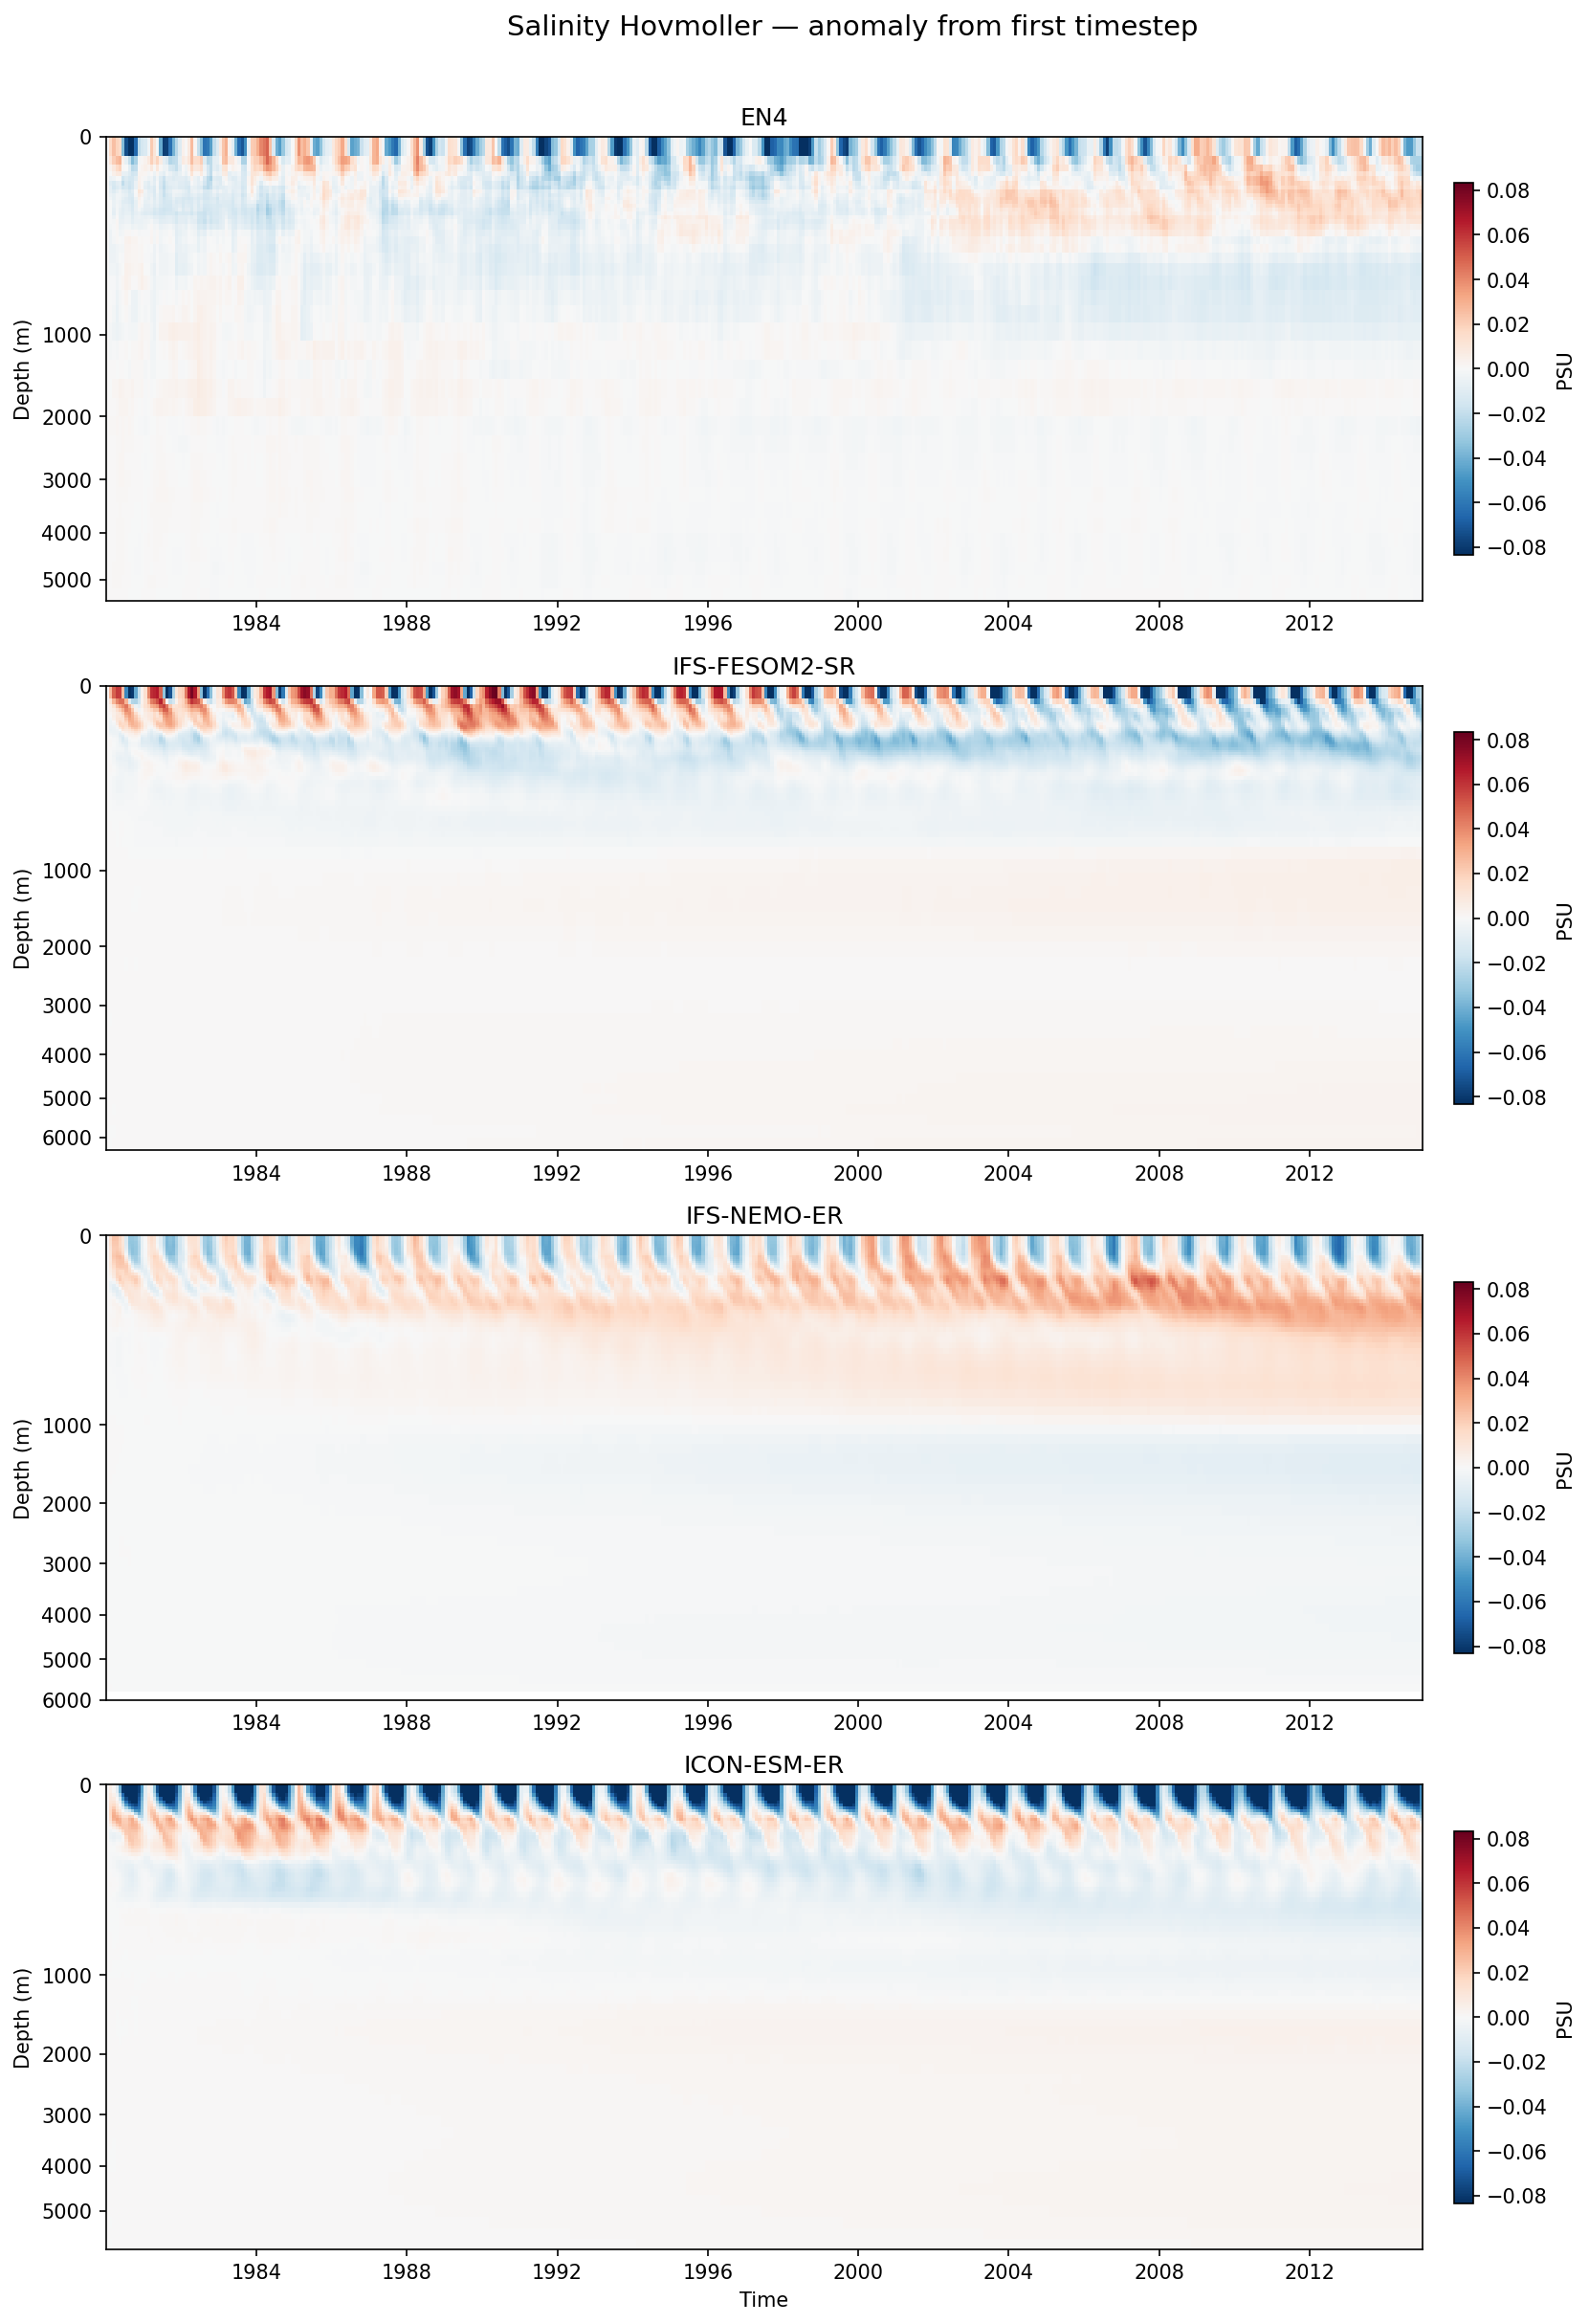
This figure presents time-depth Hovmoller diagrams of global mean salinity anomalies (relative to the first timestep) for three coupled climate models and EN4 observations, diagnosing the vertical structure of model drift over the 1980–2014 period.
Key Findings
- IFS-NEMO-ER exhibits a strong, widespread salinification drift in the upper 1000 m (reaching >+0.06 PSU), contrasting sharply with the other two models.
- ICON-ESM-ER and IFS-FESOM2-SR both show a freshening drift in the upper ocean, with ICON's signal being stronger and penetrating deeper (~1000 m) than IFS-FESOM2 (~500 m).
- Model drifts are significantly larger in magnitude than the internal variability observed in the EN4 dataset, indicating substantial adjustment from initial conditions.
Spatial Patterns
The observational baseline (EN4) is relatively stable but shows a period of enhanced salinity in the pycnocline (200–800 m) from ~2002–2012. IFS-NEMO-ER displays a vertical dipole: strong salinification above 1000 m and freshening in the intermediate depths (1000–3000 m). ICON-ESM-ER shows the inverse dipole: freshening above 1000 m and slight salinification in the abyssal ocean.
Model Agreement
There is poor inter-model agreement regarding the sign of the drift. IFS-NEMO-ER drifts positive (salty) in the upper ocean, while IFS-FESOM2-SR and ICON-ESM-ER drift negative (fresh). All models diverge from the observational evolution.
Physical Interpretation
The drifts reflect the models adjusting from the observed initial state to their own internal equilibria. The divergence in sign (salty vs. fresh surface) implies fundamental differences in the global freshwater budget (Precipitation - Evaporation) or vertical mixing processes. For instance, IFS-NEMO's salty upper/fresh deep pattern suggests a potential deficit in surface freshwater input or issues with vertical redistribution, whereas ICON's freshening suggests the opposite.
Caveats
- The figure shows global means, which may mask strong compensating regional biases (e.g., Atlantic vs. Pacific).
- Anomalies are relative to the first timestep, so this diagnostic shows temporal drift, not absolute bias against observations.
- Metadata units are listed as K (Kelvin) in the prompt, but the figure correctly displays PSU (Practical Salinity Units).
Salinity Hovmoller (EN4-ref anomaly)
| Variables | thetao, so |
|---|---|
| Models | IFS-FESOM2-SR, IFS-NEMO-ER, ICON-ESM-ER |
| Reference Dataset | EN4 v4.2.2 |
| Units | K |
| Period | 1980–2014 |
Summary high
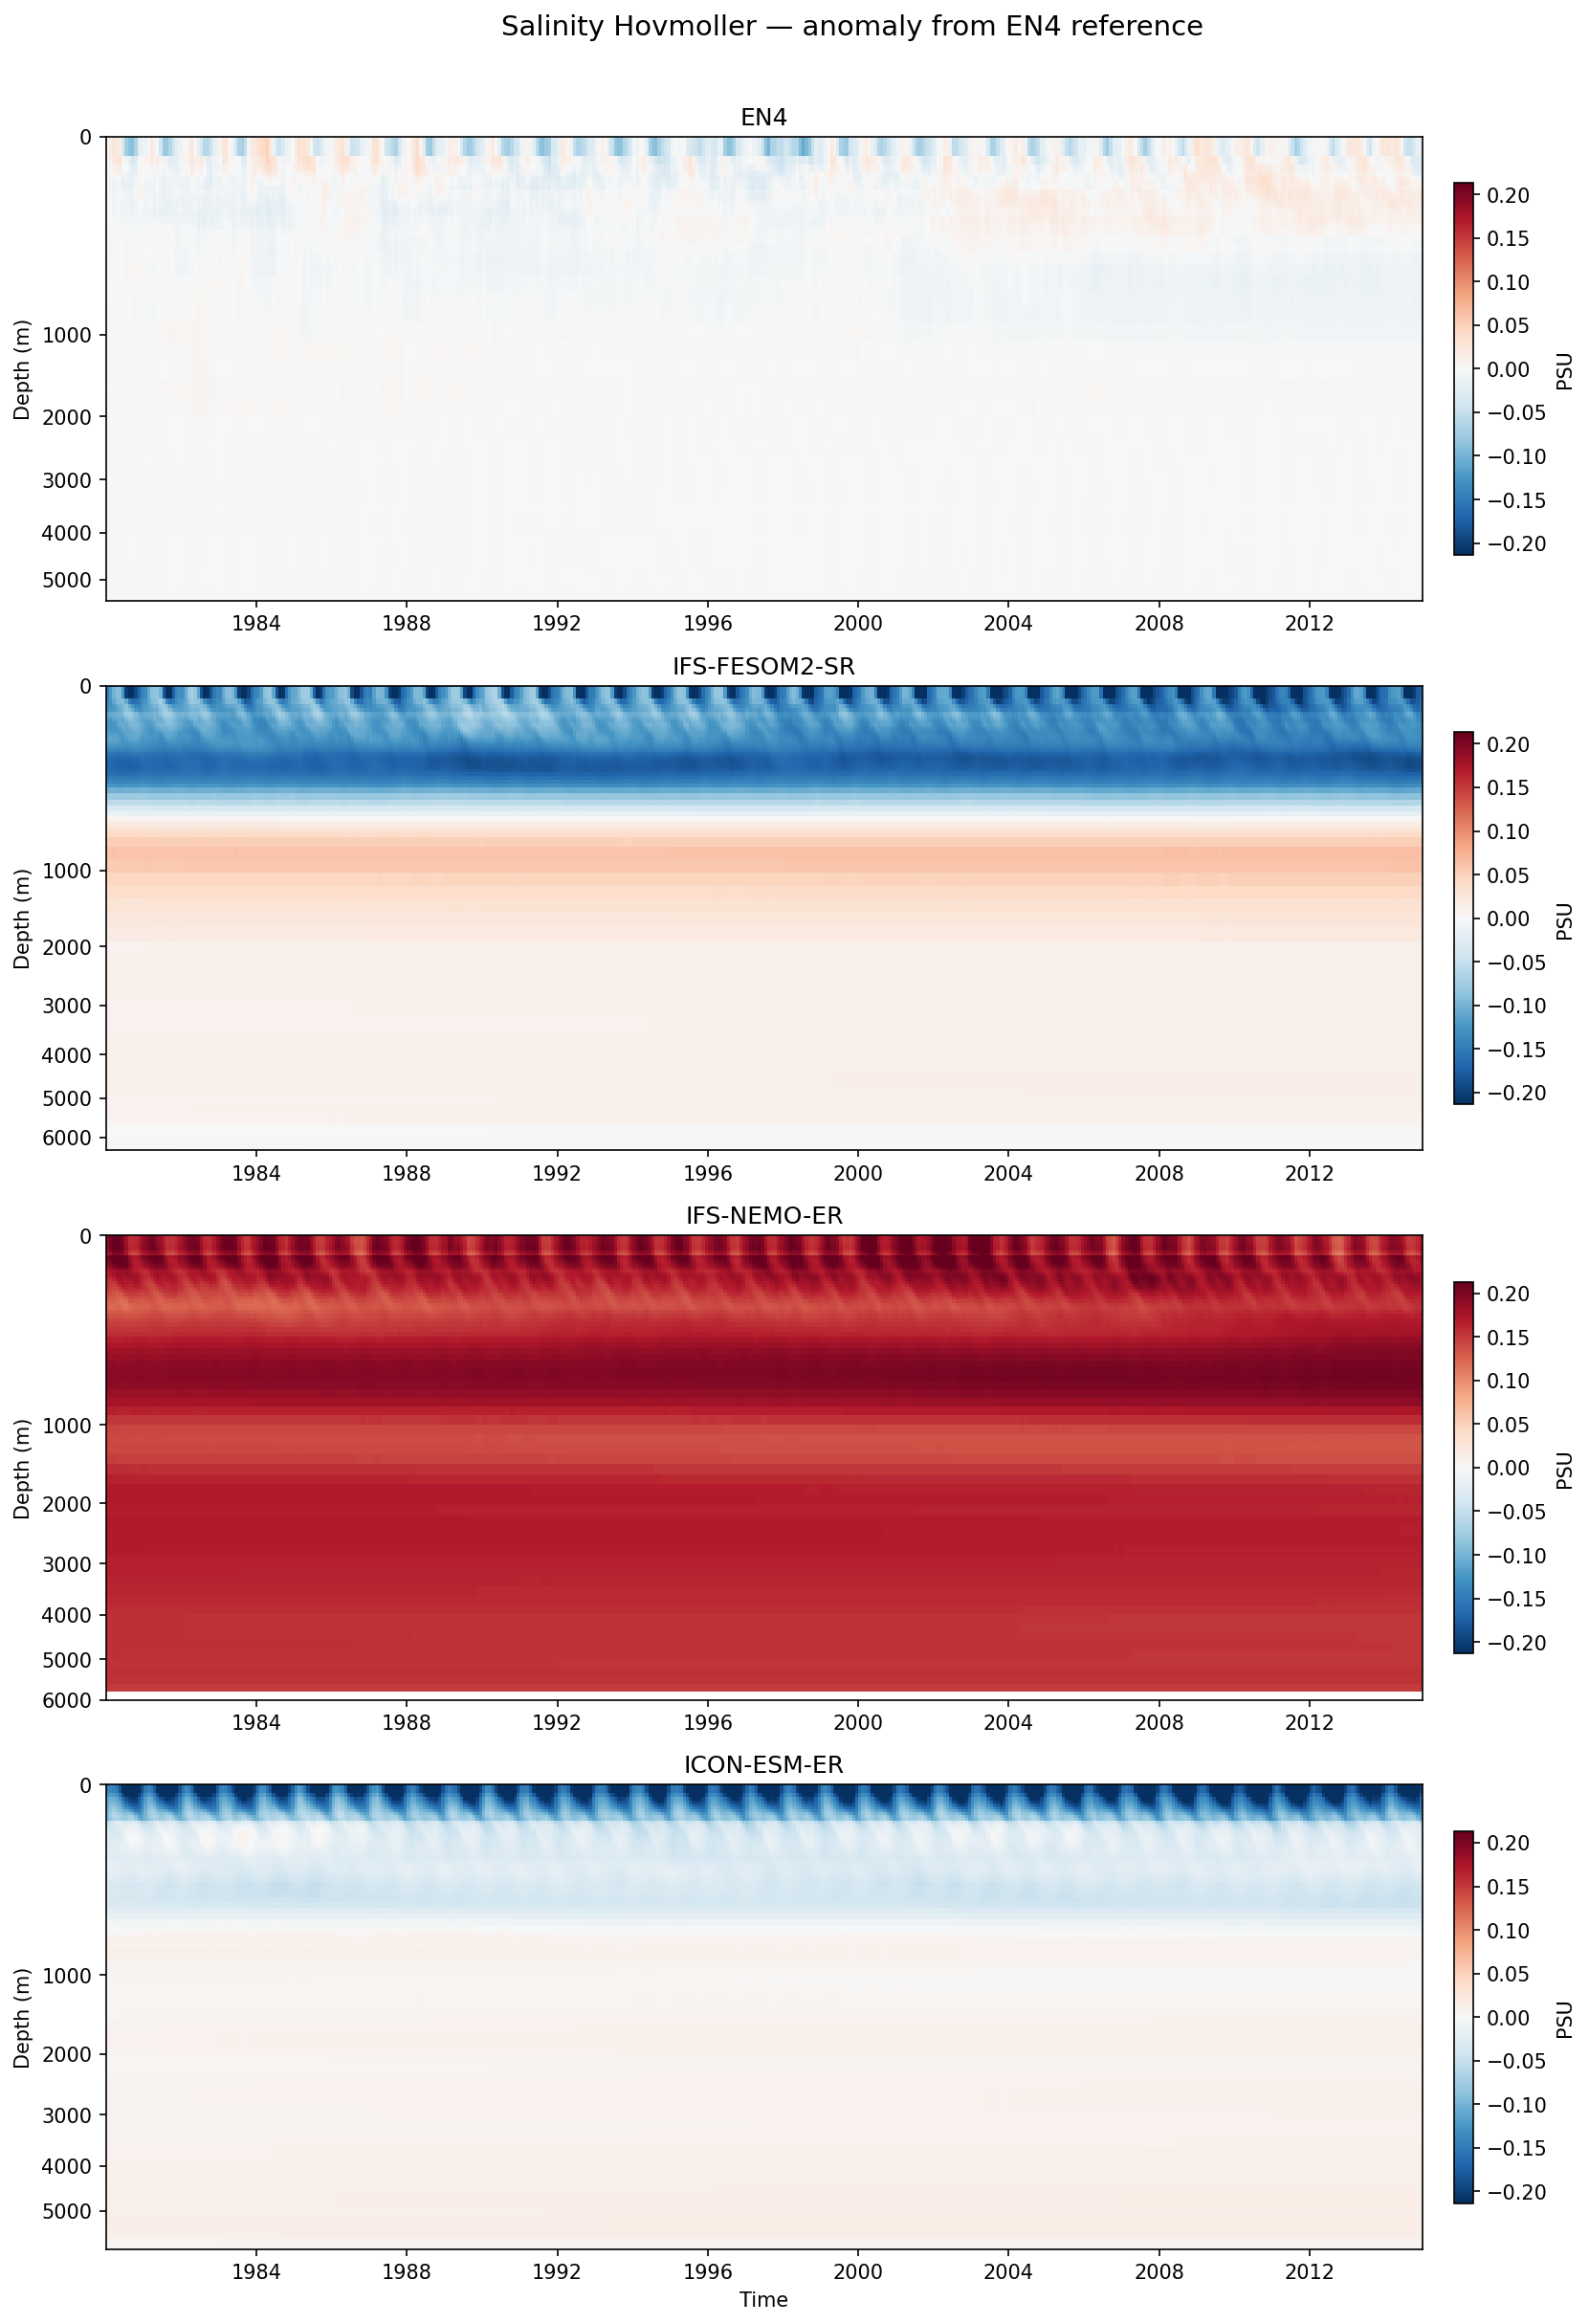
Global-mean salinity Hovmoller diagrams reveal significant and divergent drifts across the three coupled models relative to EN4 observations over the 1980–2014 period.
Key Findings
- IFS-NEMO-ER exhibits a severe, full-depth positive salinity drift (salinification), with anomalies exceeding +0.20 PSU throughout most of the water column by the end of the simulation.
- IFS-FESOM2-SR shows a distinct vertical dipole bias: strong freshening in the upper 800m (<-0.20 PSU) contrasted with mild salinification in the deep ocean.
- ICON-ESM-ER displays surface freshening (0–500m) similar to IFS-FESOM but maintains a more stable deep ocean salinity structure compared to the other models.
- EN4 observations show minimal anomalies relative to the reference profile, confirming that the strong signals in the models represent model drift rather than observational trends.
Spatial Patterns
The observation panel (EN4) is largely neutral. IFS-NEMO-ER shows uniform salinification from surface to abyss. IFS-FESOM2-SR and ICON-ESM-ER show strong stratification of the bias, with negative anomalies confined to the upper ocean (surface to ~800m for FESOM, surface to ~500m for ICON) and weak or positive anomalies below.
Model Agreement
There is very poor inter-model agreement. IFS-NEMO-ER drifts towards higher salinity, while the other two models drift towards a fresher surface. Magnitudes of drift are substantial in all cases compared to observational variability.
Physical Interpretation
IFS-NEMO-ER's pervasive salinification strongly suggests an unclosed global freshwater budget (Net Evaporation > Precipitation + Runoff) or a mass conservation issue leading to volume loss and concentration of salt. The 'fresh-surface/salty-deep' dipole in IFS-FESOM2-SR implies issues with vertical mixing processes (insufficient upward salt transport) or surface freshwater forcing (excessive precipitation/runoff or ice melt). ICON's pattern suggests similar surface flux or stratification issues but better deep-ocean stability.
Caveats
- Metadata units indicate 'K' and variable 'thetao', but the plot clearly shows Salinity in PSU; analysis proceeds based on visual evidence.
- Global averaging obscures regional compensations (e.g., Atlantic vs. Pacific basin differences).
- The reference profile definition (first timestep vs. climatology) affects the interpretation of the initial state, though the trends (drift) are unambiguous.
Salinity Surface Annual Mean Bias

| Variables | thetao, so |
|---|---|
| Models | IFS-FESOM2-SR, IFS-NEMO-ER, ICON-ESM-ER |
| Reference Dataset | EN4 v4.2.2 |
| Units | K |
| Period | 1980–2014 |
| IFS-FESOM2-SR | Global Mean Bias: -0.18 · Rmse: 0.69 |
| IFS-NEMO-ER | Global Mean Bias: 0.16 · Rmse: 0.72 |
| ICON-ESM-ER | Global Mean Bias: -0.19 · Rmse: 1.19 |
Summary high
This figure evaluates Annual Mean Surface Salinity (SSS) biases relative to EN4 v4.2.2 observational climatology. All models exhibit significant biases in the Arctic, but diverge considerably in the tropics and sub-polar North Atlantic, with ICON-ESM-ER showing the largest RMSE due to extreme regional biases.
Key Findings
- Common Arctic Saline Bias: All three models show a strong positive (saline) bias in the Arctic Ocean, most pronounced and widespread in IFS-NEMO-ER and ICON-ESM-ER (> 3 PSU in central Arctic), suggesting a systemic deficiency in maintaining the Arctic freshwater halocline or errors in river/ice freshwater budgets.
- North Atlantic Fresh Bias: IFS-FESOM2-SR and ICON-ESM-ER display a notable fresh bias in the subpolar North Atlantic and Gulf Stream extension region. IFS-NEMO-ER performs better here, showing smaller, mixed biases.
- ICON-ESM-ER Regional Extremes: ICON is an outlier with the highest RMSE (1.19 PSU), driven by a massive fresh bias in the Northern Indian Ocean (Bay of Bengal/Arabian Sea) and strong saline biases in semi-enclosed seas (Mediterranean, Red Sea, Hudson Bay).
- Global Mean Offset: IFS-NEMO-ER tends towards a global saline bias (+0.16 PSU) and is generally too salty in the tropical Pacific and Atlantic. Conversely, IFS-FESOM2-SR and ICON-ESM-ER have global fresh biases (~-0.19 PSU).
Spatial Patterns
The Arctic is uniformly too salty across models. In the tropics, IFS-NEMO-ER shows a broad, diffuse saline bias across the Pacific and Atlantic basins, while IFS-FESOM2-SR is largely neutral to slightly fresh. ICON-ESM-ER exhibits sharp contrasts: intense freshening in the Indo-Pacific warm pool and Bay of Bengal, paired with intense salinification in the Mediterranean and Arctic. Coastal river plumes (e.g., Amazon) show sharp local biases in all models, indicating sensitivity to runoff parameterization.
Model Agreement
Models agree on the sign of the error in the Arctic (too salty) but disagree on magnitude and spatial extent. There is significant disagreement in the tropical oceans: IFS-NEMO-ER is salty, while ICON-ESM-ER is fresh. IFS-FESOM2-SR generally has the lowest RMSE (0.69 PSU) and fewest extreme regional anomalies compared to the other two.
Physical Interpretation
The pervasive Arctic saline bias likely results from excessive vertical mixing or insufficient freshwater storage (e.g., in the Beaufort Gyre) and potentially issues with sea ice meltwater distribution. The fresh bias in the North Atlantic for FESOM and ICON is a common high-resolution model feature, often linked to the path of the North Atlantic Current or excessive export of Arctic freshwater. ICON's extreme fresh bias in the Indian Ocean suggests excessive precipitation or trapped freshwater runoff in the Bay of Bengal that is not being advected correctly.
Caveats
- Observational data (EN4) is sparse in the ice-covered Arctic and Southern Oceans, which increases uncertainty in the bias validation for polar regions.
- Strong coastal biases near major river mouths (Amazon, Congo) suggest sensitivity to the specific implementation of river runoff (points vs. spread).
Salinity Surface DJF Bias
| Variables | thetao, so |
|---|---|
| Models | IFS-FESOM2-SR, IFS-NEMO-ER, ICON-ESM-ER |
| Reference Dataset | EN4 v4.2.2 |
| Units | K |
| Period | 1980–2014 |
| IFS-FESOM2-SR | Global Mean Bias: -0.18 · Rmse: 0.77 |
| IFS-NEMO-ER | Global Mean Bias: 0.15 · Rmse: 0.73 |
| ICON-ESM-ER | Global Mean Bias: -0.18 · Rmse: 1.19 |
Summary high
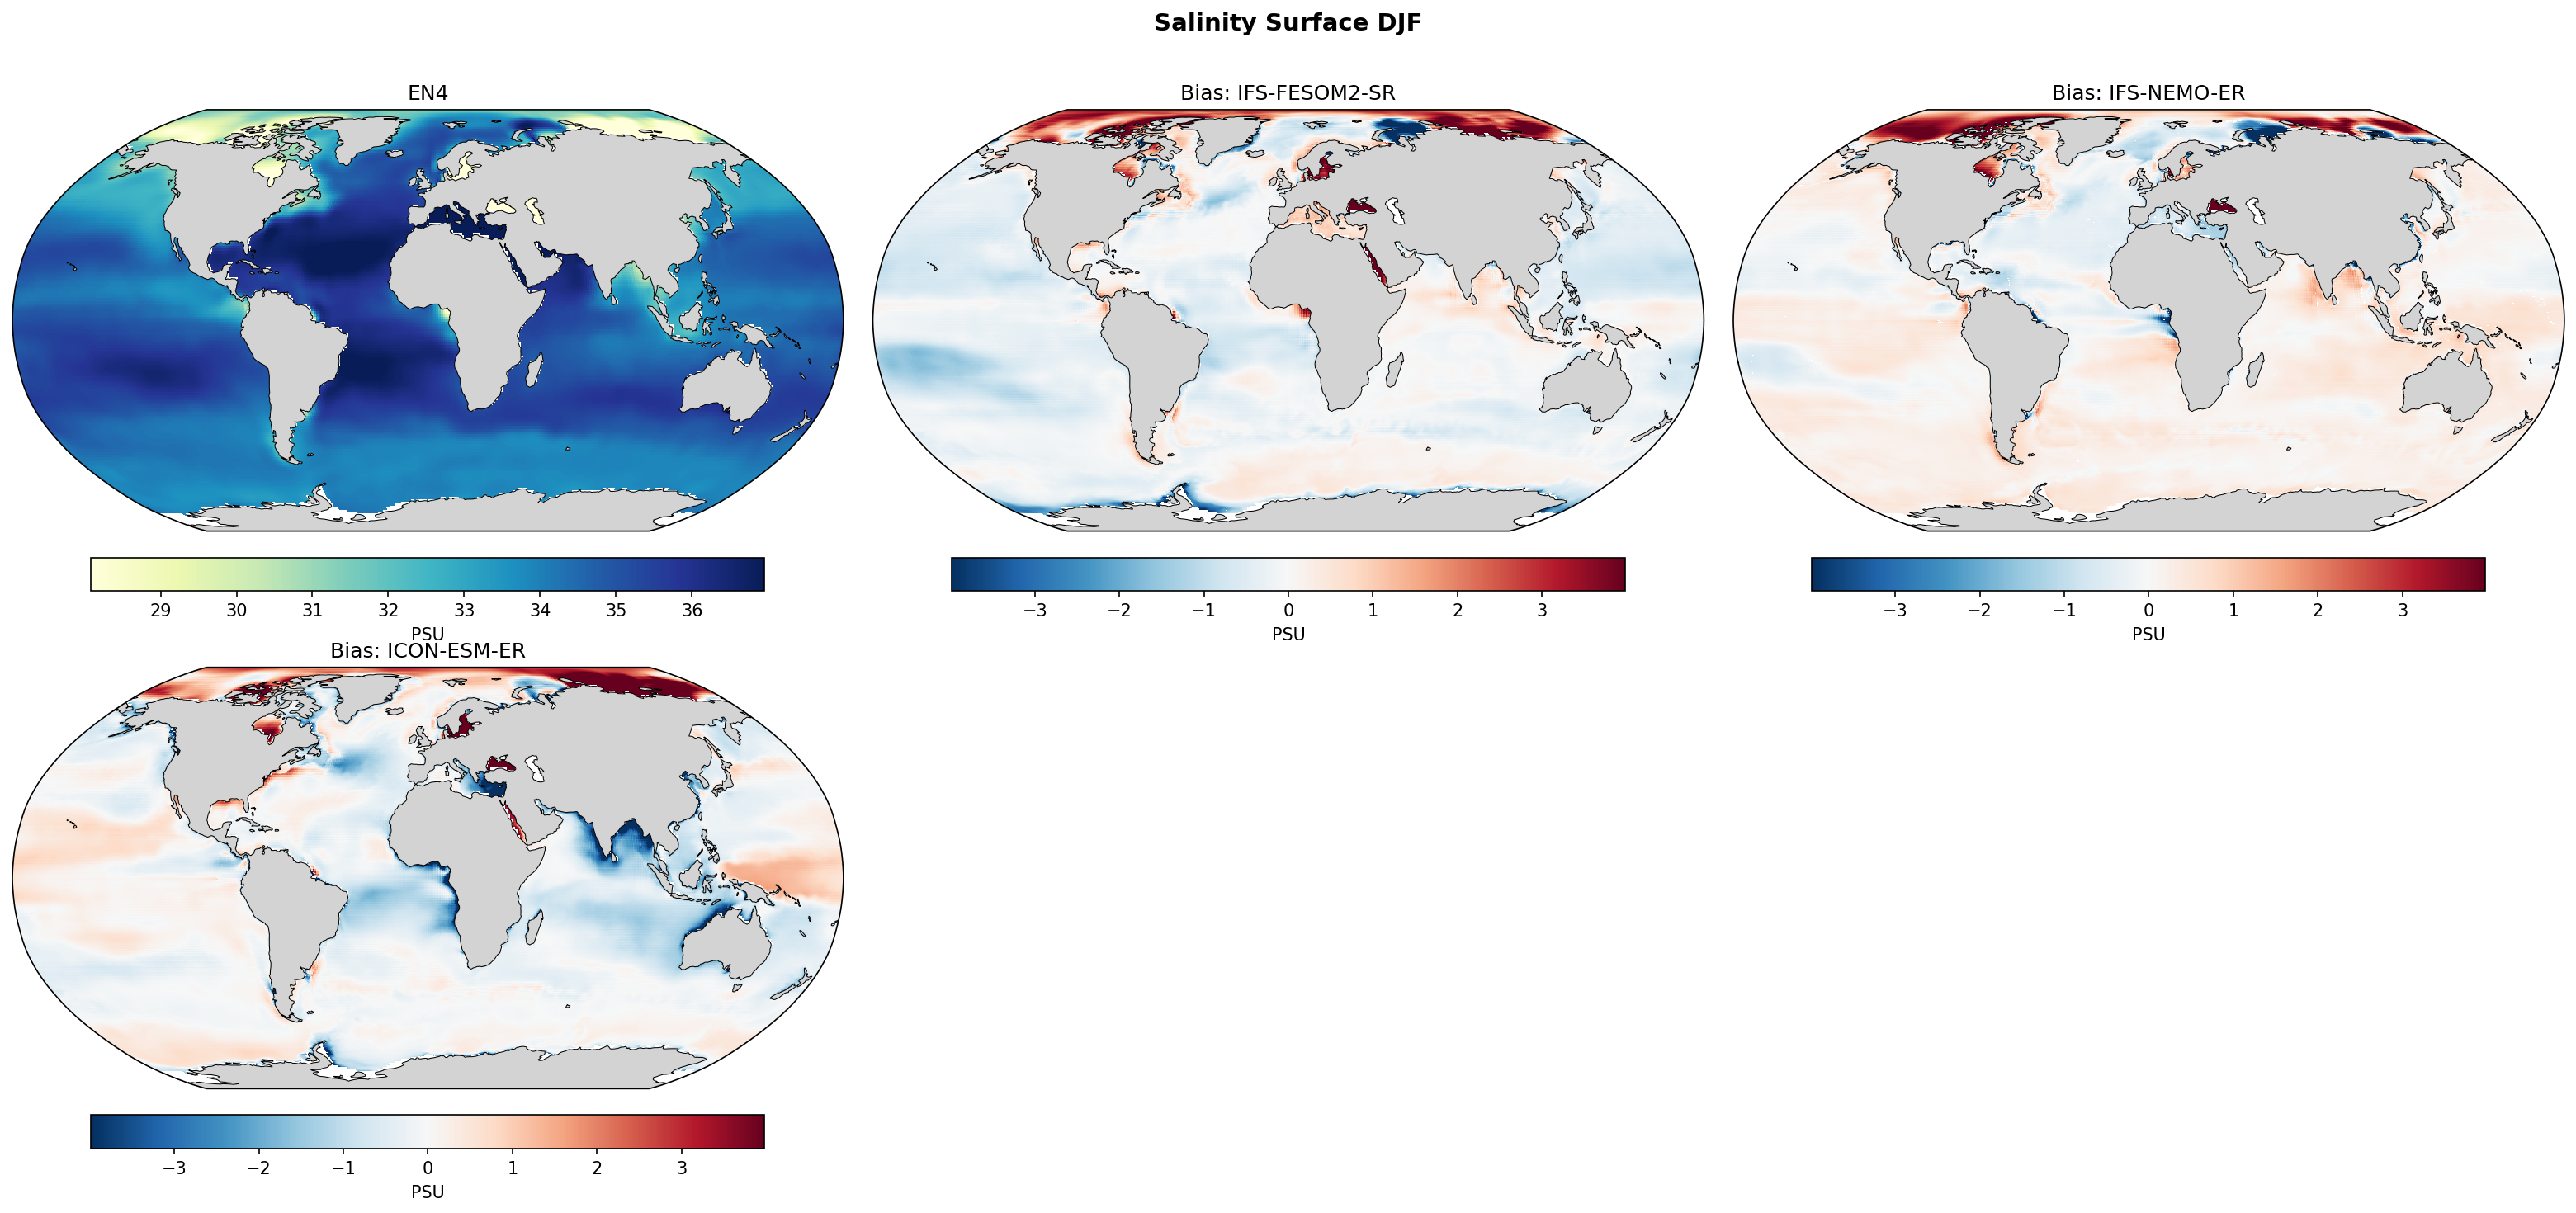
Diagnostic maps of DJF sea surface salinity biases relative to EN4 v4.2.2 reveal that IFS-NEMO-ER has the lowest global error (RMSE ~0.73 PSU) with a general salty bias, whereas IFS-FESOM2-SR and ICON-ESM-ER exhibit global fresh biases and larger regional errors.
Key Findings
- All three models exhibit strong positive salinity biases in the Arctic Ocean and marginal seas (Mediterranean, Red Sea, Baltic), likely due to resolution-limited exchange or sea-ice brine parameterization.
- A clear divergence in the Tropical Pacific: IFS-NEMO-ER shows a broad salty bias, while IFS-FESOM2-SR and ICON-ESM-ER show widespread fresh biases.
- ICON-ESM-ER displays a prominent, strong fresh bias in the North Atlantic Current extension region and the highest global RMSE (1.19 PSU) among the evaluated models.
Spatial Patterns
High-latitude regions (Arctic, Barents Sea) consistently show positive (salty) biases >2 PSU in all models. The North Atlantic features a fresh bias in IFS-FESOM2-SR and ICON-ESM-ER, contrasting with a mixed/salty signal in IFS-NEMO-ER. In the tropics, IFS-FESOM2-SR shows fresh biases aligned with the ITCZ and SPCZ, suggesting precipitation dominance, while IFS-NEMO-ER is generally too saline. Marginal seas (Red Sea, Persian Gulf, Mediterranean) show extreme positive biases.
Model Agreement
Models agree on positive biases in the Arctic and marginal seas but diverge significantly in the open ocean, particularly the Pacific and North Atlantic. IFS-NEMO-ER stands apart with a global positive mean bias (+0.15 PSU), while the other two have negative mean biases (~ -0.18 PSU).
Physical Interpretation
The widespread Arctic salty bias suggests issues with vertical mixing, river runoff distribution, or sea ice brine rejection processes. Extreme biases in semi-enclosed seas (Mediterranean, Red Sea) indicate that even at eddy-rich resolutions, straits (Gibraltar, Bab el-Mandeb) may act as chokepoints, restricting fresh water exchange. The fresh biases in the Tropical Pacific for IFS-FESOM and ICON likely couple to excessive precipitation (ITCZ biases), while the North Atlantic fresh bias in ICON suggests a misplaced North Atlantic Current or insufficient northward salt transport.
Caveats
- Surface salinity biases are strongly coupled to atmospheric E-P (Evaporation minus Precipitation) errors; distinguishing ocean model dynamics from atmospheric forcing errors requires precipitation validation.
- The metadata lists units as 'K', which is incorrect for salinity; analysis assumes PSU based on color bars.
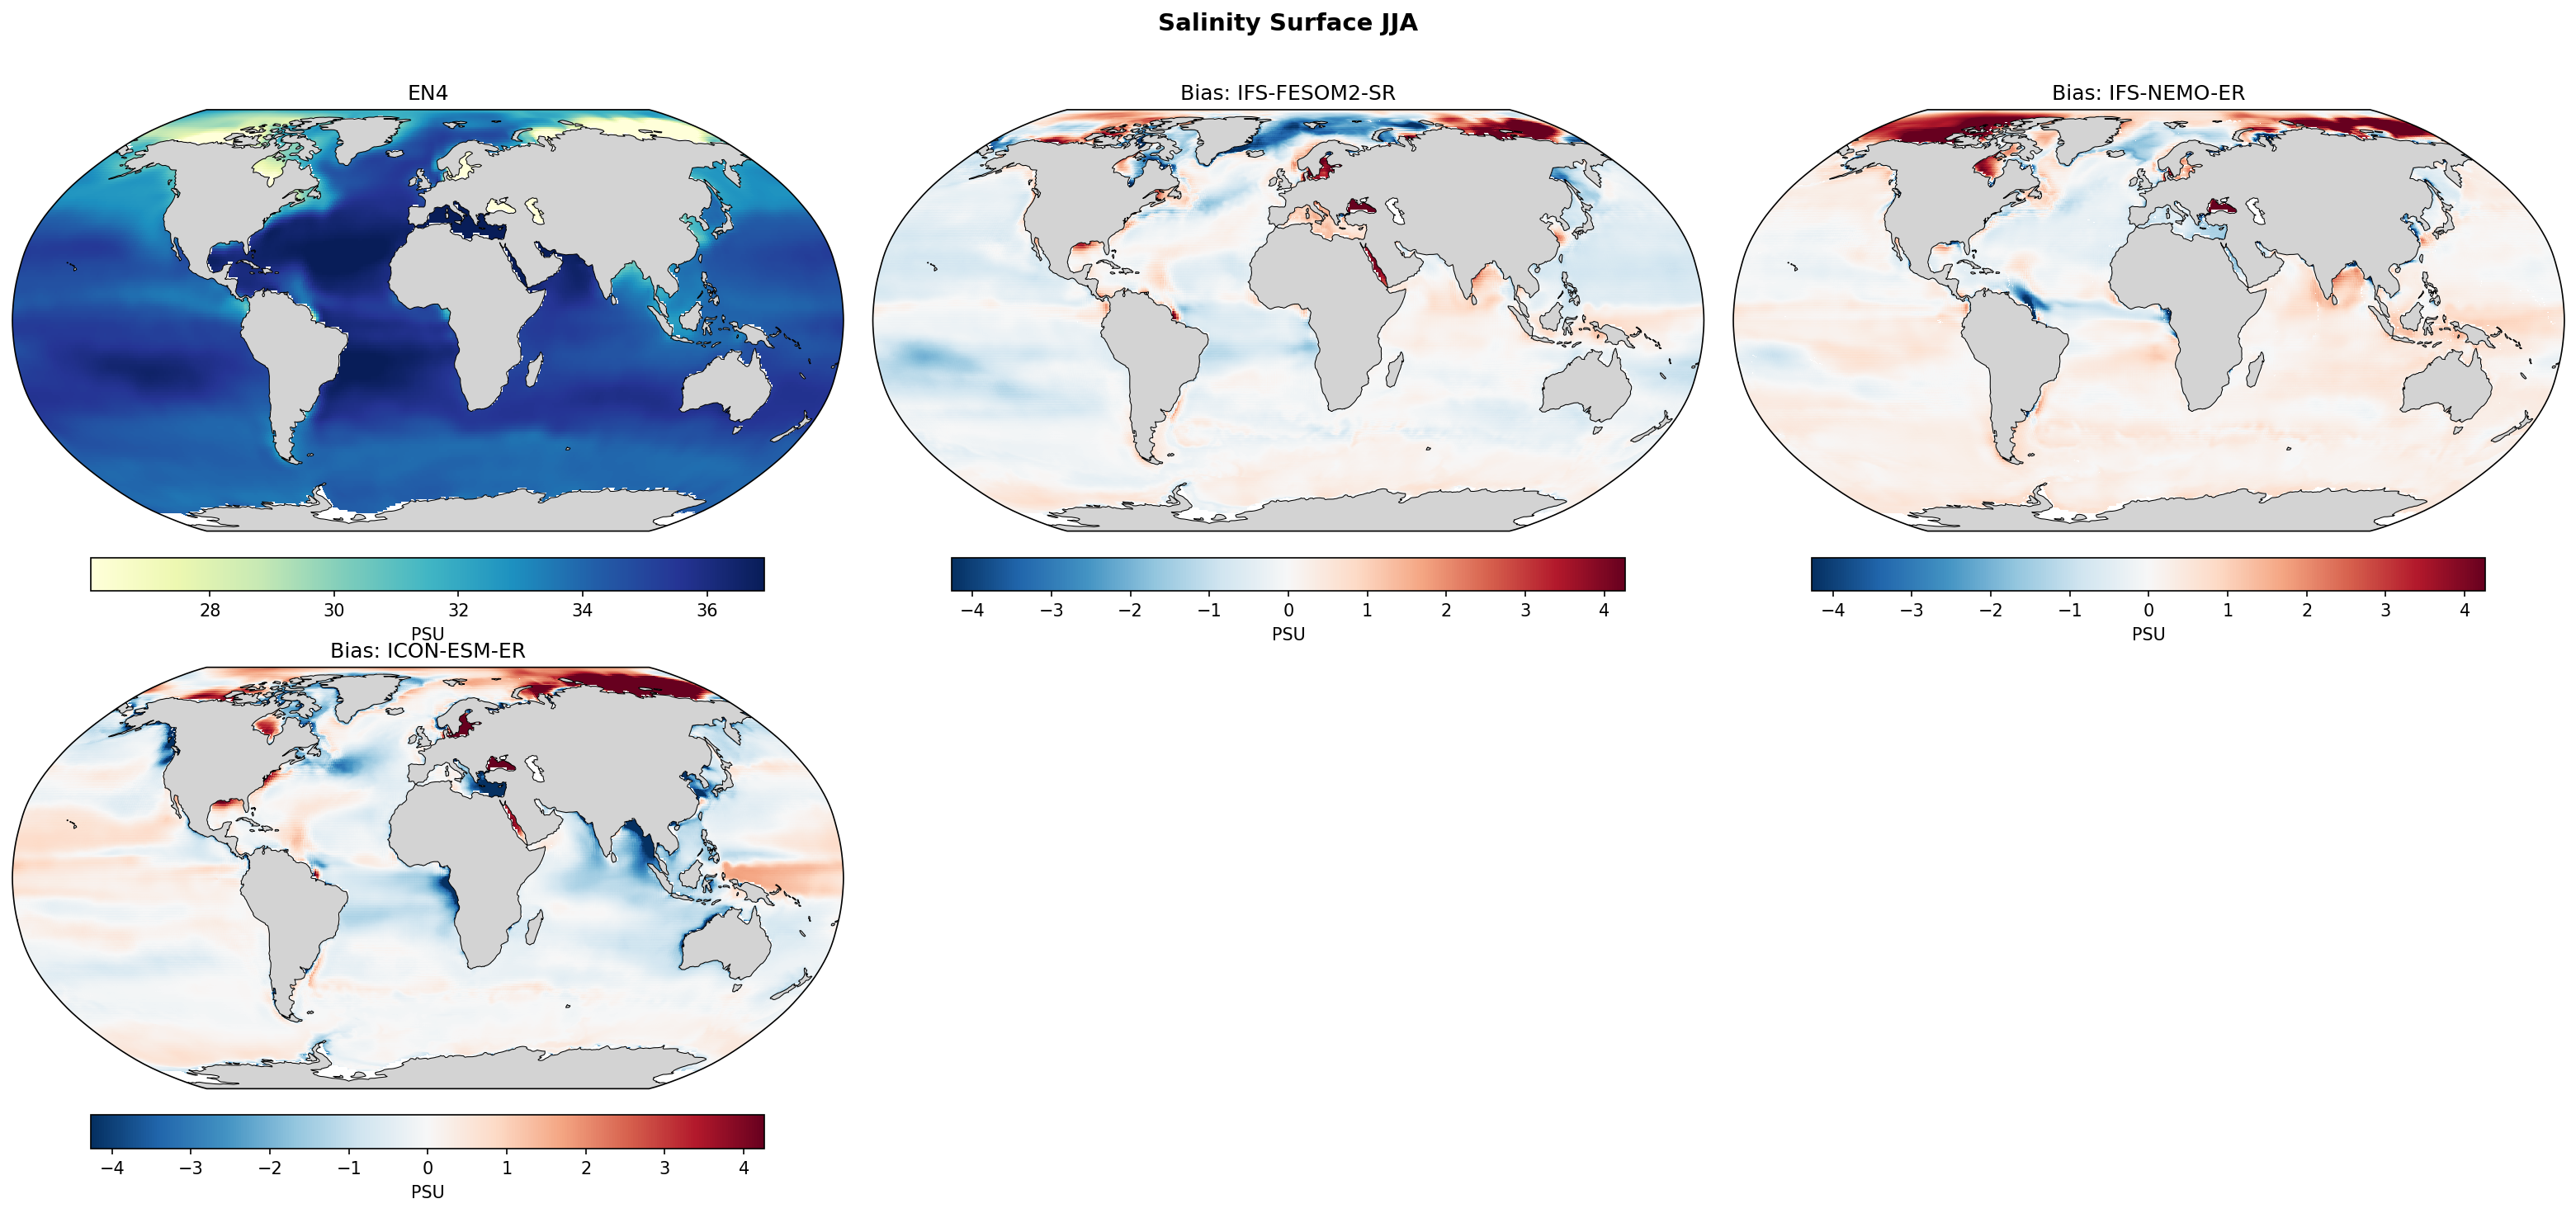
Salinity Surface JJA Bias
| Variables | thetao, so |
|---|---|
| Models | IFS-FESOM2-SR, IFS-NEMO-ER, ICON-ESM-ER |
| Reference Dataset | EN4 v4.2.2 |
| Units | K |
| Period | 1980–2014 |
| IFS-FESOM2-SR | Global Mean Bias: -0.19 · Rmse: 0.77 |
| IFS-NEMO-ER | Global Mean Bias: 0.18 · Rmse: 0.84 |
| ICON-ESM-ER | Global Mean Bias: -0.20 · Rmse: 1.29 |
Summary high
This diagnostic compares JJA sea surface salinity (SSS) climatologies from three high-resolution coupled models against EN4 observations. While IFS-NEMO-ER exhibits a global positive (salty) mean bias, both IFS-FESOM2-SR and ICON-ESM-ER show global negative (fresh) mean biases, with all models struggling significantly in the Arctic.
Key Findings
- All three models exhibit strong positive salinity biases (> 2-4 PSU) in the Arctic Ocean, particularly along the Siberian shelf, suggesting systemic issues with river runoff distribution or sea ice freshwater budgets.
- IFS-NEMO-ER generally overestimates salinity in the subtropical gyres of the Pacific and Atlantic, whereas IFS-FESOM2-SR and ICON-ESM-ER tend to underestimate salinity in these broad regions.
- ICON-ESM-ER displays the highest RMSE (1.29 PSU) and a distinct zonal bias pattern in the tropical Pacific: too fresh in the Western Warm Pool and too salty in the Eastern Pacific.
- IFS-NEMO-ER shows a prominent fresh bias tongue extending from the Amazon/Orinoco region, contrasting with local salty biases in IFS-FESOM2-SR, implying differences in river plume advection or magnitude.
Spatial Patterns
The Arctic is consistently too salty across all simulations. In the tropics, biases trace precipitation zones: ICON-ESM-ER shows strong freshening in the Indo-Pacific warm pool (likely excessive precip). The Atlantic exhibits a dipole in IFS-NEMO-ER (fresh ITCZ/Amazon vs. salty subtropics), while IFS-FESOM2-SR is fresher across the subpolar and subtropical North Atlantic.
Model Agreement
Models disagree on the sign of the global mean bias (NEMO positive vs. FESOM/ICON negative). However, they agree on the sign of the error in the Arctic (positive) and generally in the semi-enclosed Red Sea/Mediterranean (positive/salty bias).
Physical Interpretation
The pervasive Arctic salty bias suggests underestimates of river runoff input or insufficient retention of sea-ice meltwater at the surface. The fresh bias in the Western Pacific for ICON-ESM-ER is likely linked to the 'double ITCZ' or excessive precipitation bias common in ESMs. The contrast between IFS-NEMO and IFS-FESOM (same atmosphere, different ocean) in the subtropical gyres points to differences in ocean mixing schemes or E-P handling at the surface interface.
Caveats
- Metadata incorrectly lists units as 'K'; values are clearly Salinity (PSU).
- Extreme biases in semi-enclosed seas (Red Sea, Mediterranean, Baltic) may be artifacts of resolution limiting exchange through narrow straits.
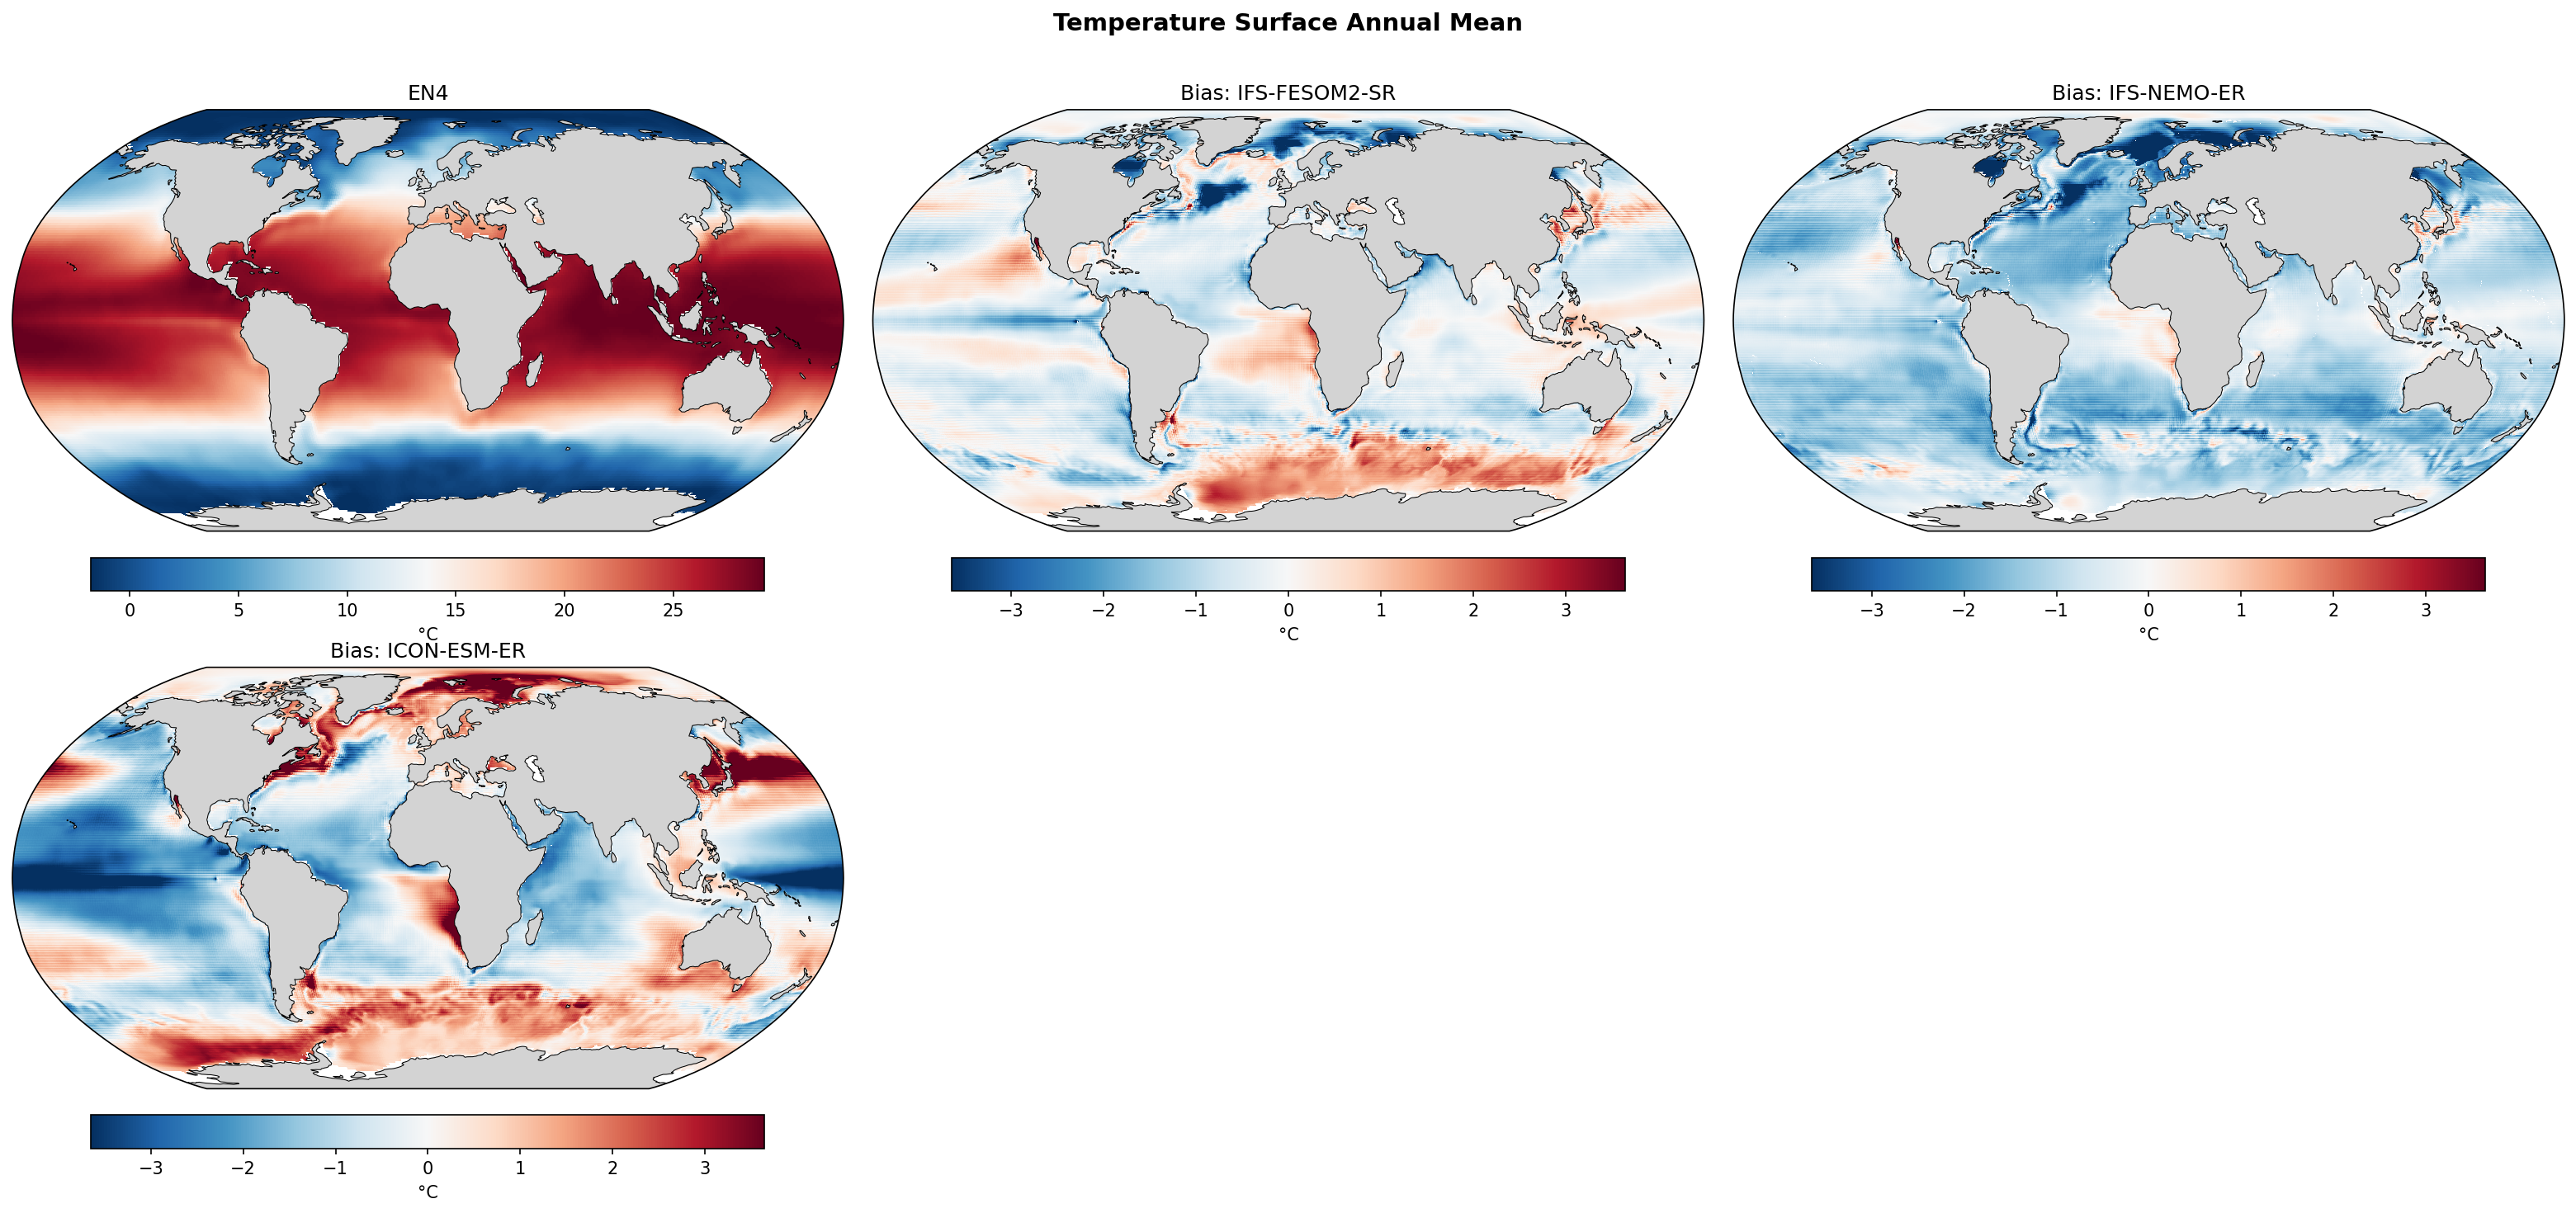
Temperature Surface Annual Mean Bias
| Variables | thetao, so |
|---|---|
| Models | IFS-FESOM2-SR, IFS-NEMO-ER, ICON-ESM-ER |
| Reference Dataset | EN4 v4.2.2 |
| Units | K |
| Period | 1980–2014 |
| IFS-FESOM2-SR | Global Mean Bias: -0.19 · Rmse: 0.91 |
| IFS-NEMO-ER | Global Mean Bias: -1.05 · Rmse: 1.29 |
| ICON-ESM-ER | Global Mean Bias: -0.36 · Rmse: 1.70 |
Summary high
This diagnostic compares annual mean Sea Surface Temperature (SST) biases of three high-resolution coupled models against EN4 observations (1980–2014). The models exhibit strikingly different error characteristics: IFS-FESOM2-SR is the most accurate globally, IFS-NEMO-ER suffers from a systemic cold bias, and ICON-ESM-ER shows large-magnitude regional errors particularly in upwelling zones and the North Atlantic.
Key Findings
- IFS-FESOM2-SR demonstrates the best performance with the lowest global mean bias (-0.19°C) and RMSE (0.91°C), though it exhibits a notable warm bias in the Southern Ocean and a dipole error in the Gulf Stream extension.
- IFS-NEMO-ER is characterized by a pervasive global cold bias (mean -1.05°C), cooling significantly in the Atlantic and Tropical Pacific, distinct from the other models.
- ICON-ESM-ER has the highest spatial variance (RMSE 1.70°C), driven by severe warm biases (>3°C) in eastern boundary upwelling systems (Humboldt, Benguela, California currents) and a strong warm bias in the North Atlantic subpolar gyre.
Spatial Patterns
In the North Atlantic, the models diverge completely: ICON is far too warm, IFS-NEMO is too cold, and IFS-FESOM shows a cold subpolar gyre contrasting with a warm Gulf Stream extension. In the Southern Ocean, both ICON and IFS-FESOM show zonal bands of warm bias, whereas IFS-NEMO remains cold. The classic 'warm bias' problem in eastern boundary upwelling regions is severe in ICON but absent or reversed in the IFS models.
Model Agreement
There is low inter-model agreement. While IFS-FESOM and ICON share some Southern Ocean features, their treatment of the Atlantic and upwelling zones is opposite. IFS-NEMO stands out as an outlier due to its uniform cooling drift.
Physical Interpretation
ICON's severe warm biases in upwelling regions suggest deficiencies in resolving coastal upwelling dynamics or, more likely, a lack of stratocumulus cloud decks leading to excessive solar heating. The strong warm bias in the North Atlantic for ICON may indicate an overly strong AMOC or northward heat transport. IFS-NEMO's global cooling points to a negative radiative imbalance or initialization shock/drift. The Gulf Stream dipoles in IFS-FESOM and ICON suggest challenges in correctly simulating the latitude of the current separation and extension, even at eddy-permitting resolutions.
Caveats
- Biases are evaluated against EN4; high-gradient regions (e.g., Gulf Stream) are sensitive to the observational product's effective resolution.
- The 'Surface' temperature generally refers to the top model layer, which may differ slightly from skin temperature seen by satellites.
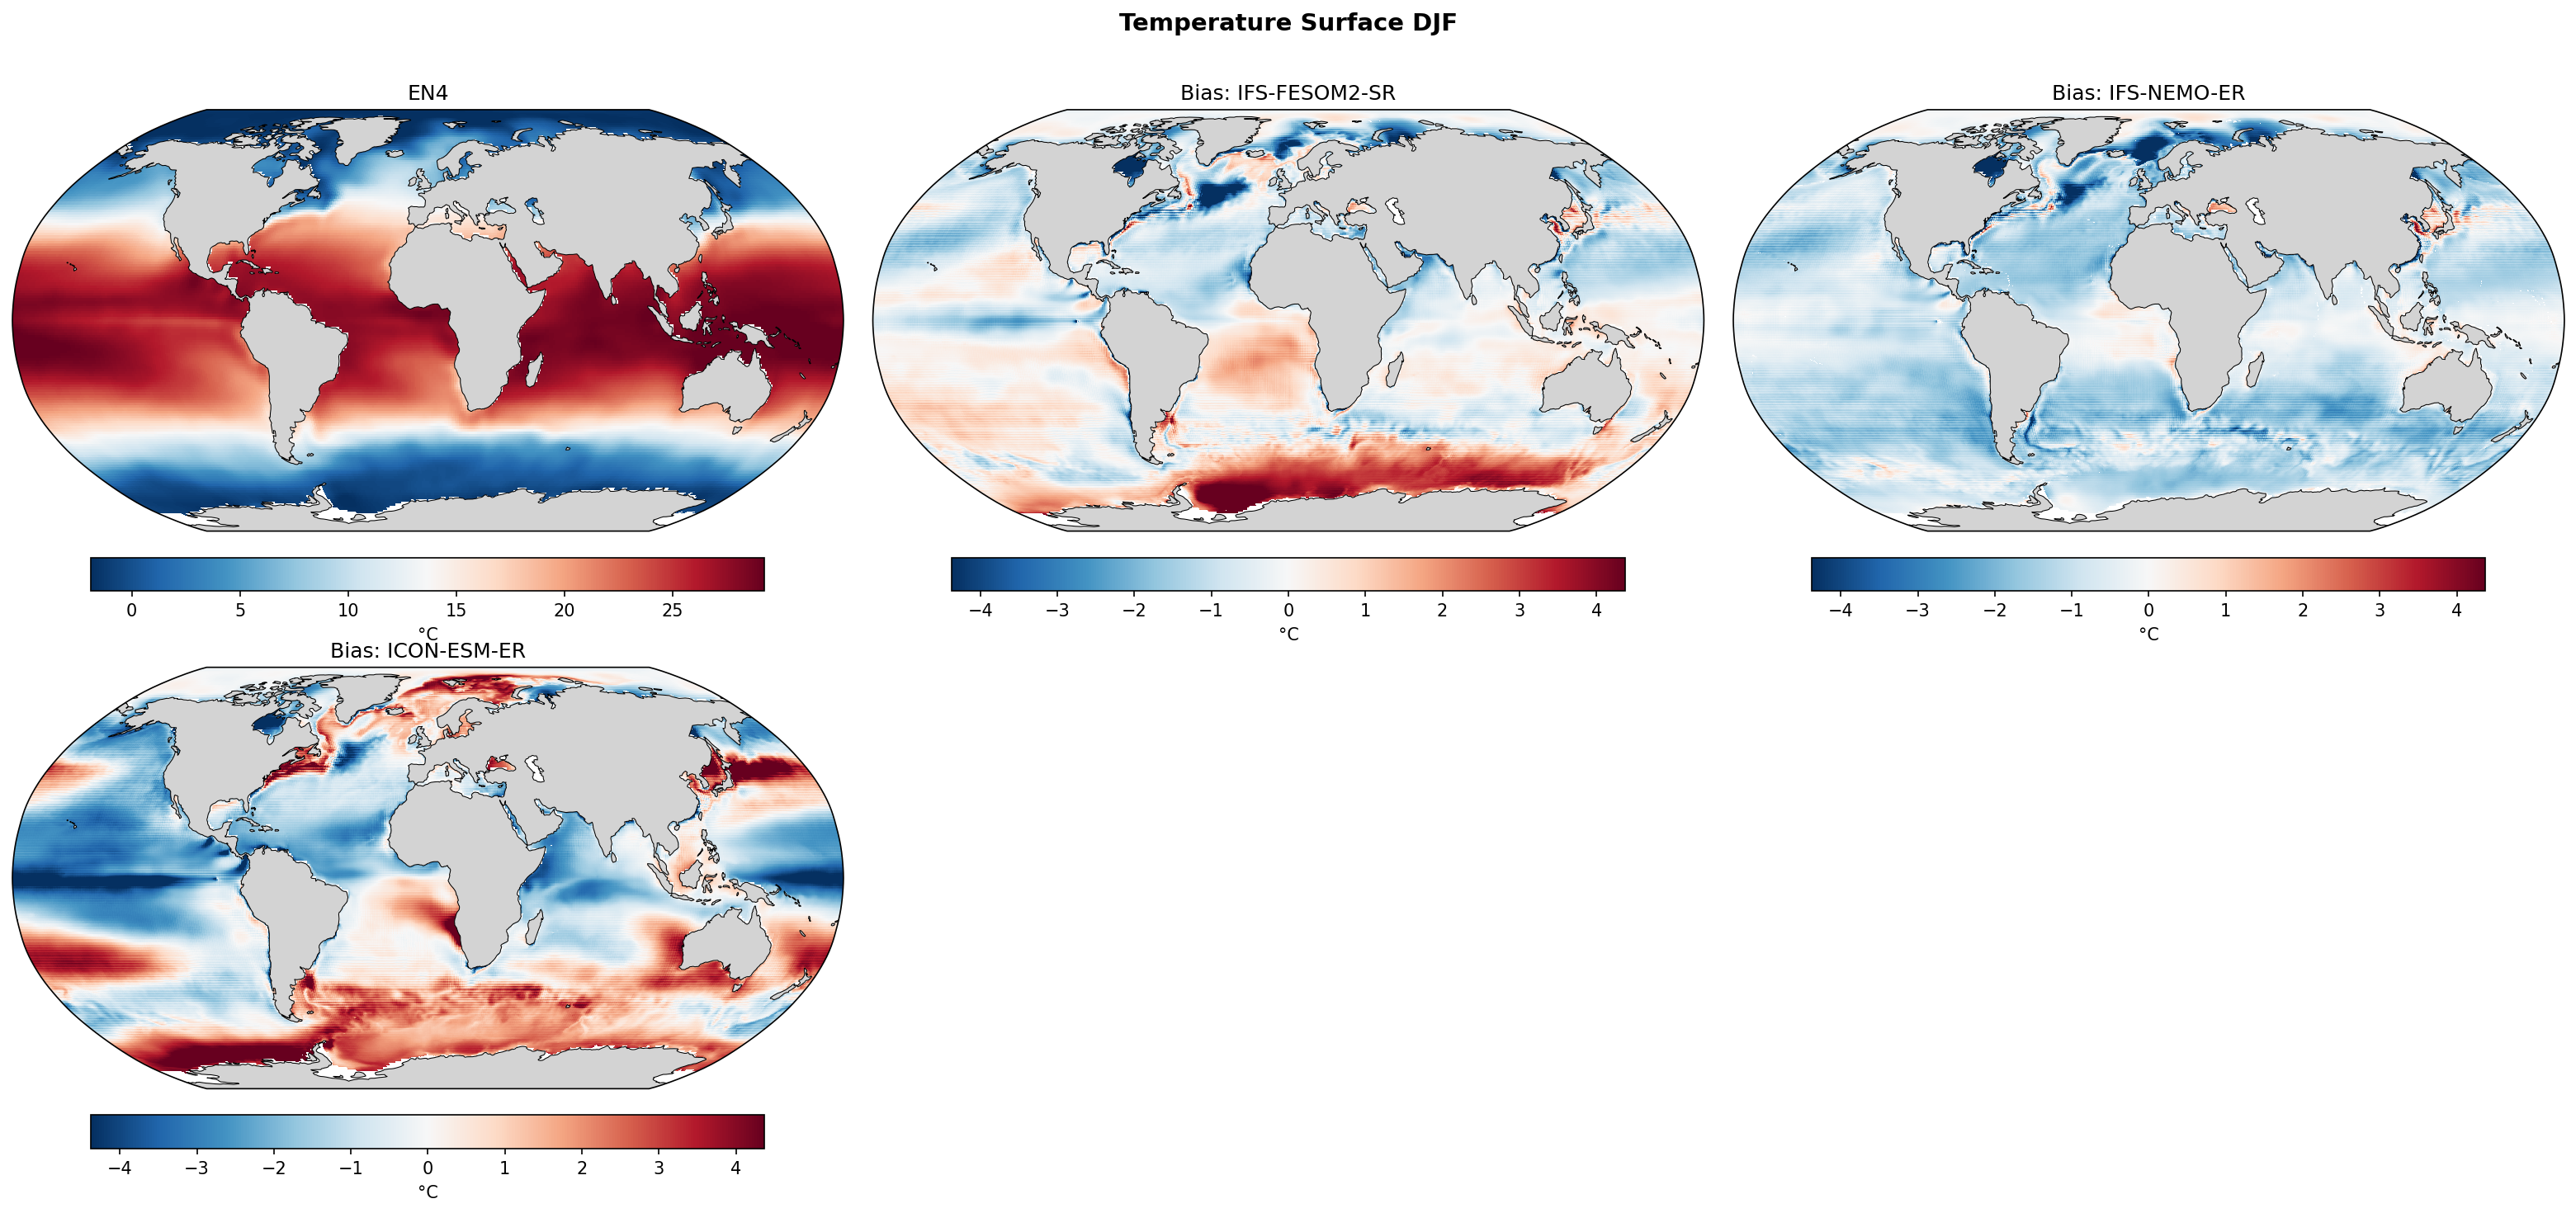
Temperature Surface DJF Bias
| Variables | thetao, so |
|---|---|
| Models | IFS-FESOM2-SR, IFS-NEMO-ER, ICON-ESM-ER |
| Reference Dataset | EN4 v4.2.2 |
| Units | K |
| Period | 1980–2014 |
| IFS-FESOM2-SR | Global Mean Bias: -0.05 · Rmse: 1.29 |
| IFS-NEMO-ER | Global Mean Bias: -1.04 · Rmse: 1.32 |
| ICON-ESM-ER | Global Mean Bias: -0.30 · Rmse: 2.09 |
Summary high
This figure evaluates DJF sea surface temperature (SST) biases in three high-resolution coupled models (IFS-FESOM2-SR, IFS-NEMO-ER, ICON-ESM-ER) relative to EN4 observations. While IFS-FESOM2-SR achieves the lowest global mean bias, significant structural differences appear in the North Atlantic and Southern Ocean across the ensemble.
Key Findings
- IFS-NEMO-ER exhibits a pervasive, systematic cold bias across the global ocean (global mean -1.04 K), contrasting with the more regionally compensated biases in the other models.
- ICON-ESM-ER shows the largest regional errors (RMSE ~2.09 K), characterized by a unique, intense warm bias in the subpolar North Atlantic and Labrador Sea, and strong warm biases in the Southern Ocean.
- IFS-FESOM2-SR performs best in terms of global mean bias (-0.05 K) and RMSE (1.29 K) but displays classic warm biases in Eastern Boundary Upwelling Systems (e.g., Benguela, Peru/Chile).
Spatial Patterns
All models show dipolar bias structures in Western Boundary Current regions (Gulf Stream, Kuroshio), indicative of separation latitude errors common even at eddy-permitting resolutions. The Southern Ocean exhibits divergent behavior: a strong warm bias band in ICON-ESM-ER and IFS-FESOM2-SR, versus a cold bias in IFS-NEMO-ER. In the North Atlantic, the 'cold blob' (subpolar cooling) is prominent in both IFS-based models, whereas ICON-ESM-ER shows strong warming there.
Model Agreement
Inter-model agreement is low regarding the sign of biases in key dynamic regions like the Southern Ocean and North Atlantic subpolar gyre. However, there is some agreement on the location of Western Boundary Current separation errors.
Physical Interpretation
The North Atlantic cold bias in IFS models likely reflects a weak Atlantic Meridional Overturning Circulation (AMOC) or excessive surface heat loss, whereas ICON's warm bias there suggests vigorous convective mixing or a displaced North Atlantic Current. The Southern Ocean warm biases in FESOM/ICON are often linked to cloud radiative feedback errors (insufficient reflection of shortwave radiation) or vertical mixing deficiencies. The systematic cold bias in IFS-NEMO-ER suggests a global energy imbalance or initialization drift.
Caveats
- The strong global mean cold bias in IFS-NEMO-ER may mask regional dynamical biases.
- Analysis is restricted to DJF; seasonal compensation in JJA is not visible.
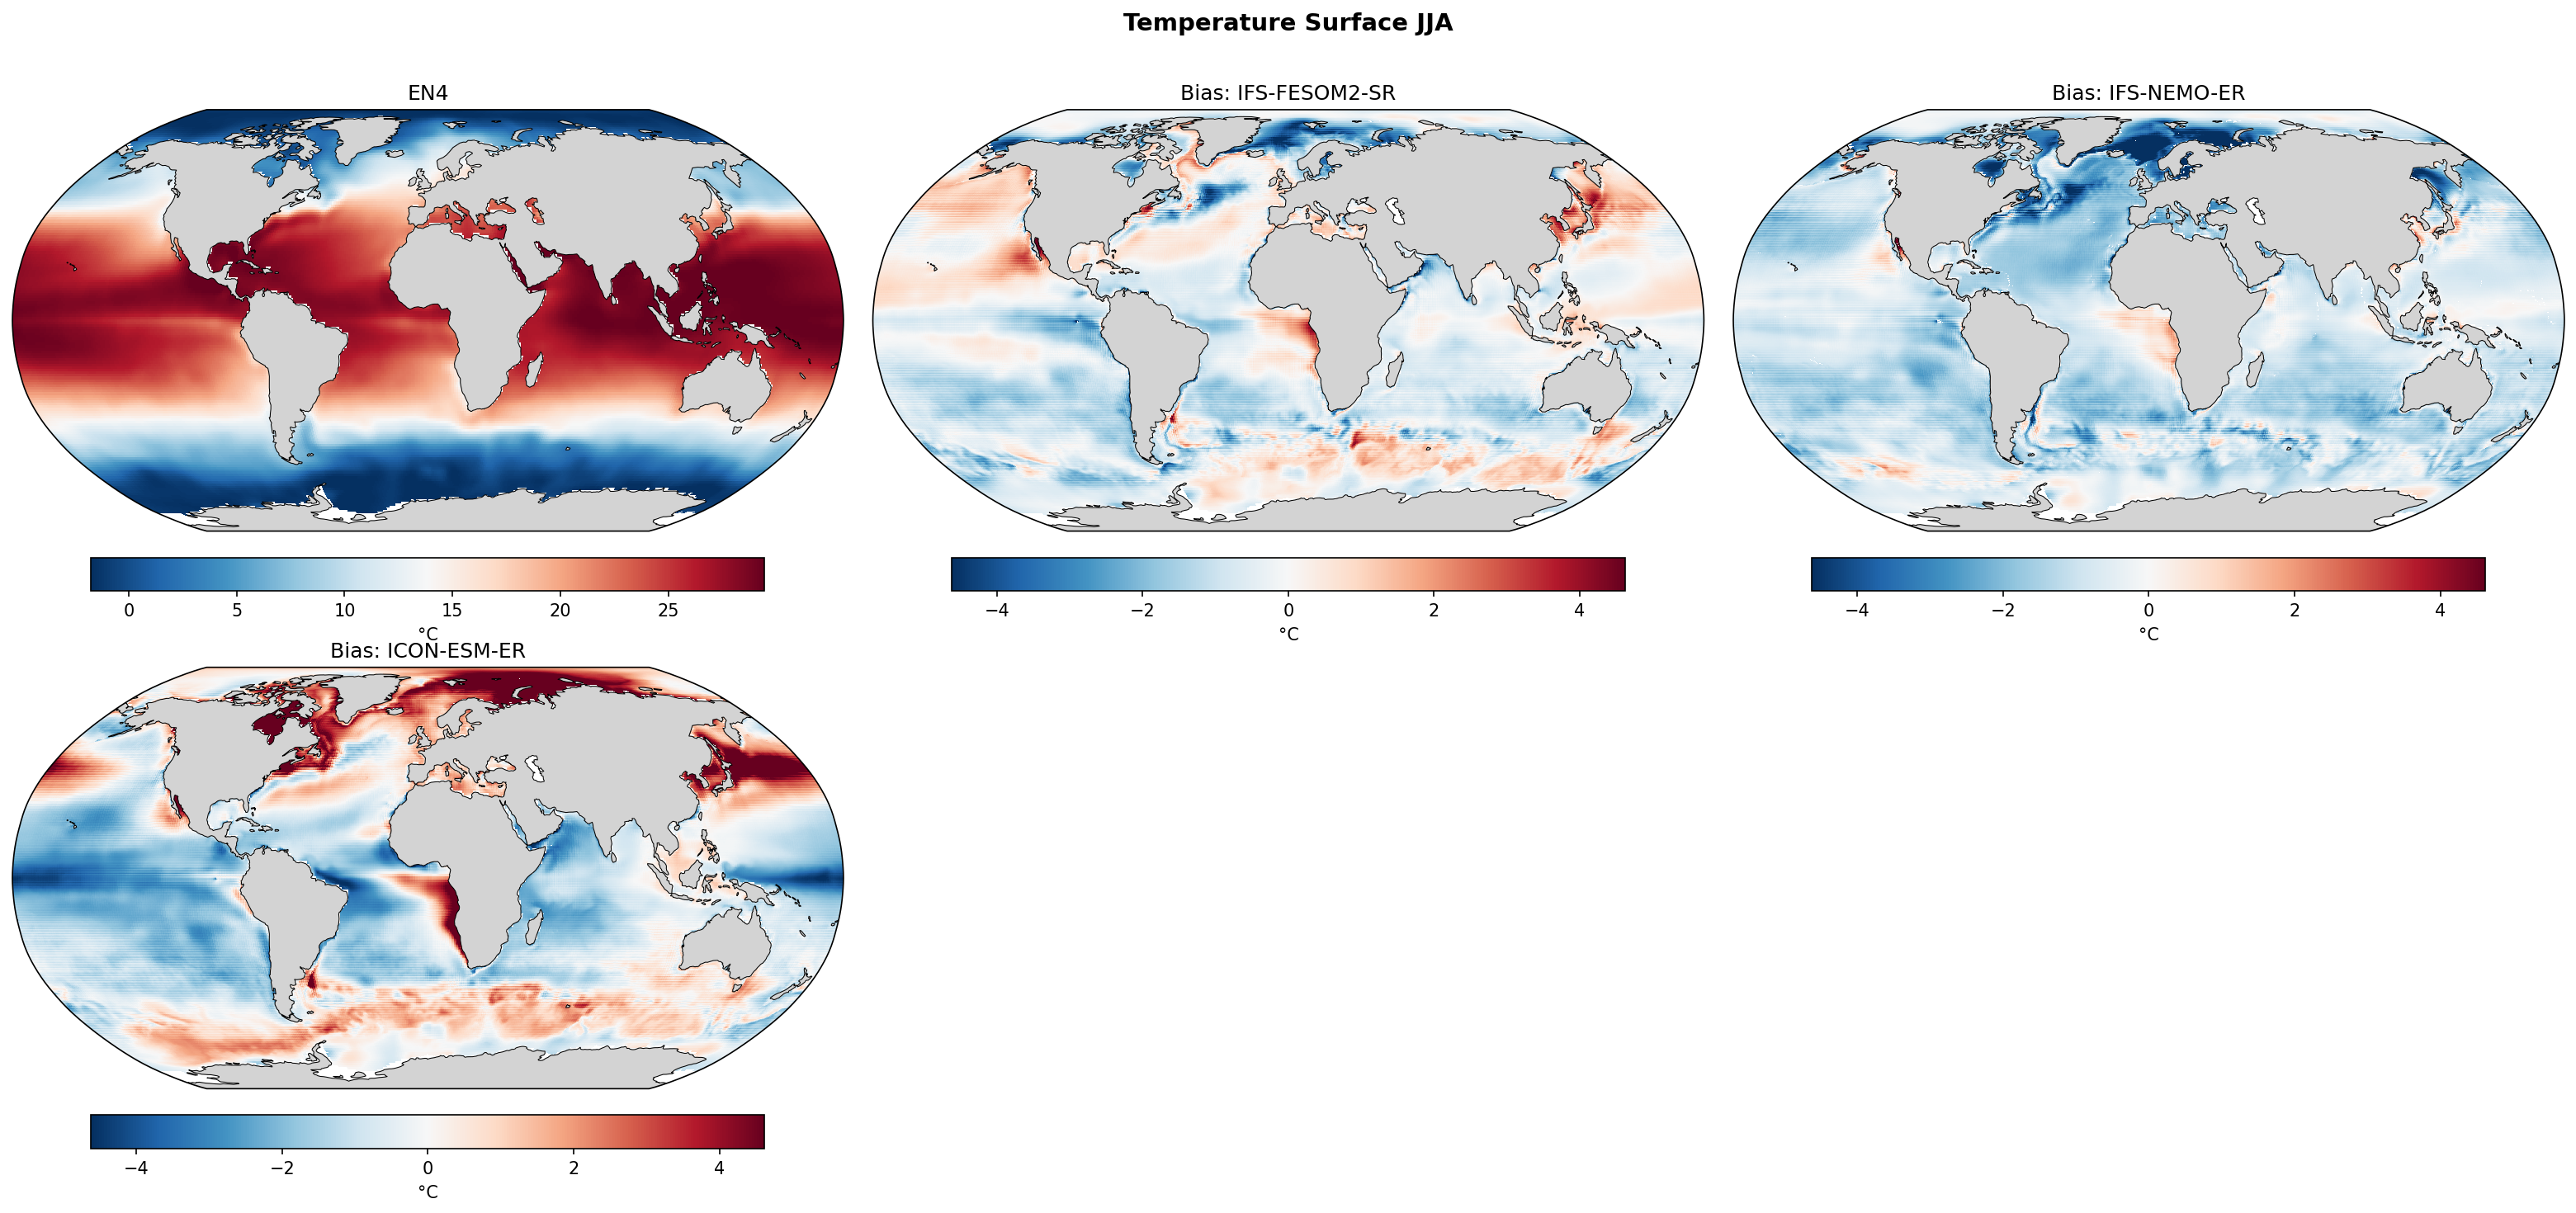
Temperature Surface JJA Bias
| Variables | thetao, so |
|---|---|
| Models | IFS-FESOM2-SR, IFS-NEMO-ER, ICON-ESM-ER |
| Reference Dataset | EN4 v4.2.2 |
| Units | K |
| Period | 1980–2014 |
| IFS-FESOM2-SR | Global Mean Bias: -0.31 · Rmse: 1.07 |
| IFS-NEMO-ER | Global Mean Bias: -1.06 · Rmse: 1.39 |
| ICON-ESM-ER | Global Mean Bias: -0.41 · Rmse: 1.92 |
Summary high
This diagnostic displays JJA surface temperature biases relative to EN4 climatology for three high-resolution coupled models. IFS-FESOM2-SR demonstrates the best overall performance (lowest RMSE), while IFS-NEMO-ER shows a systematic global cold bias and ICON-ESM-ER exhibits severe regional warm biases in upwelling zones and western boundary currents.
Key Findings
- IFS-NEMO-ER is dominated by a widespread, systematic cold bias (global mean -1.06 K), affecting nearly all ocean basins except for localized boundary current regions.
- ICON-ESM-ER has the highest RMSE (1.92 K) driven by intense warm biases (>4 K) in eastern boundary upwelling regions (Benguela, Peru-Chile) and Western Boundary Current extensions (Gulf Stream, Kuroshio).
- IFS-FESOM2-SR performs best statistically (RMSE 1.07 K, mean bias -0.31 K), showing reduced bias magnitudes compared to the other models, though it shares the warm bias in Western Boundary Current extensions found in ICON.
Spatial Patterns
All models show a cold bias in the subpolar North Atlantic (south of Greenland). ICON-ESM-ER shows a striking dipole in the North Atlantic with this cold patch contrasted against a vast warm bias in the Gulf Stream extension. ICON also exhibits characteristic 'double ITCZ' or eastern boundary warm biases in the South Atlantic and South Pacific, features less prominent in the IFS-based models. The Southern Ocean is predominantly warm in ICON but cold in IFS-NEMO.
Model Agreement
Inter-model agreement is low regarding the sign of the bias. IFS-NEMO is systematically cold, while ICON and IFS-FESOM2 show mixed regional patterns with significant warm structures. All models agree on cooling in the subpolar North Atlantic gyre.
Physical Interpretation
The severe warm biases in ICON's eastern boundary currents suggest unresolved upwelling dynamics or deficiencies in stratocumulus cloud parameterization (allowing excessive solar heating). The warm biases in the Gulf Stream and Kuroshio extensions in ICON and IFS-FESOM2 likely indicate issues with the separation latitude and eastward propagation of these currents (overshooting). IFS-NEMO's global cold bias points to a fundamental Earth energy imbalance or mixing parameterization issue rather than a specific regional dynamical failure.
Caveats
- Analysis is restricted to JJA (Northern Hemisphere summer/Southern Hemisphere winter); seasonal biases may differ in DJF.
- Surface temperature biases do not reveal subsurface error structures which might compensate for surface features.
Temperature Depth-Layer Time Series
| Variables | thetao, so |
|---|---|
| Models | IFS-FESOM2-SR, IFS-NEMO-ER, ICON-ESM-ER, EN4 |
| Reference Dataset | EN4 v4.2.2 |
| Units | K |
| Period | 1980–2014 |
Summary high
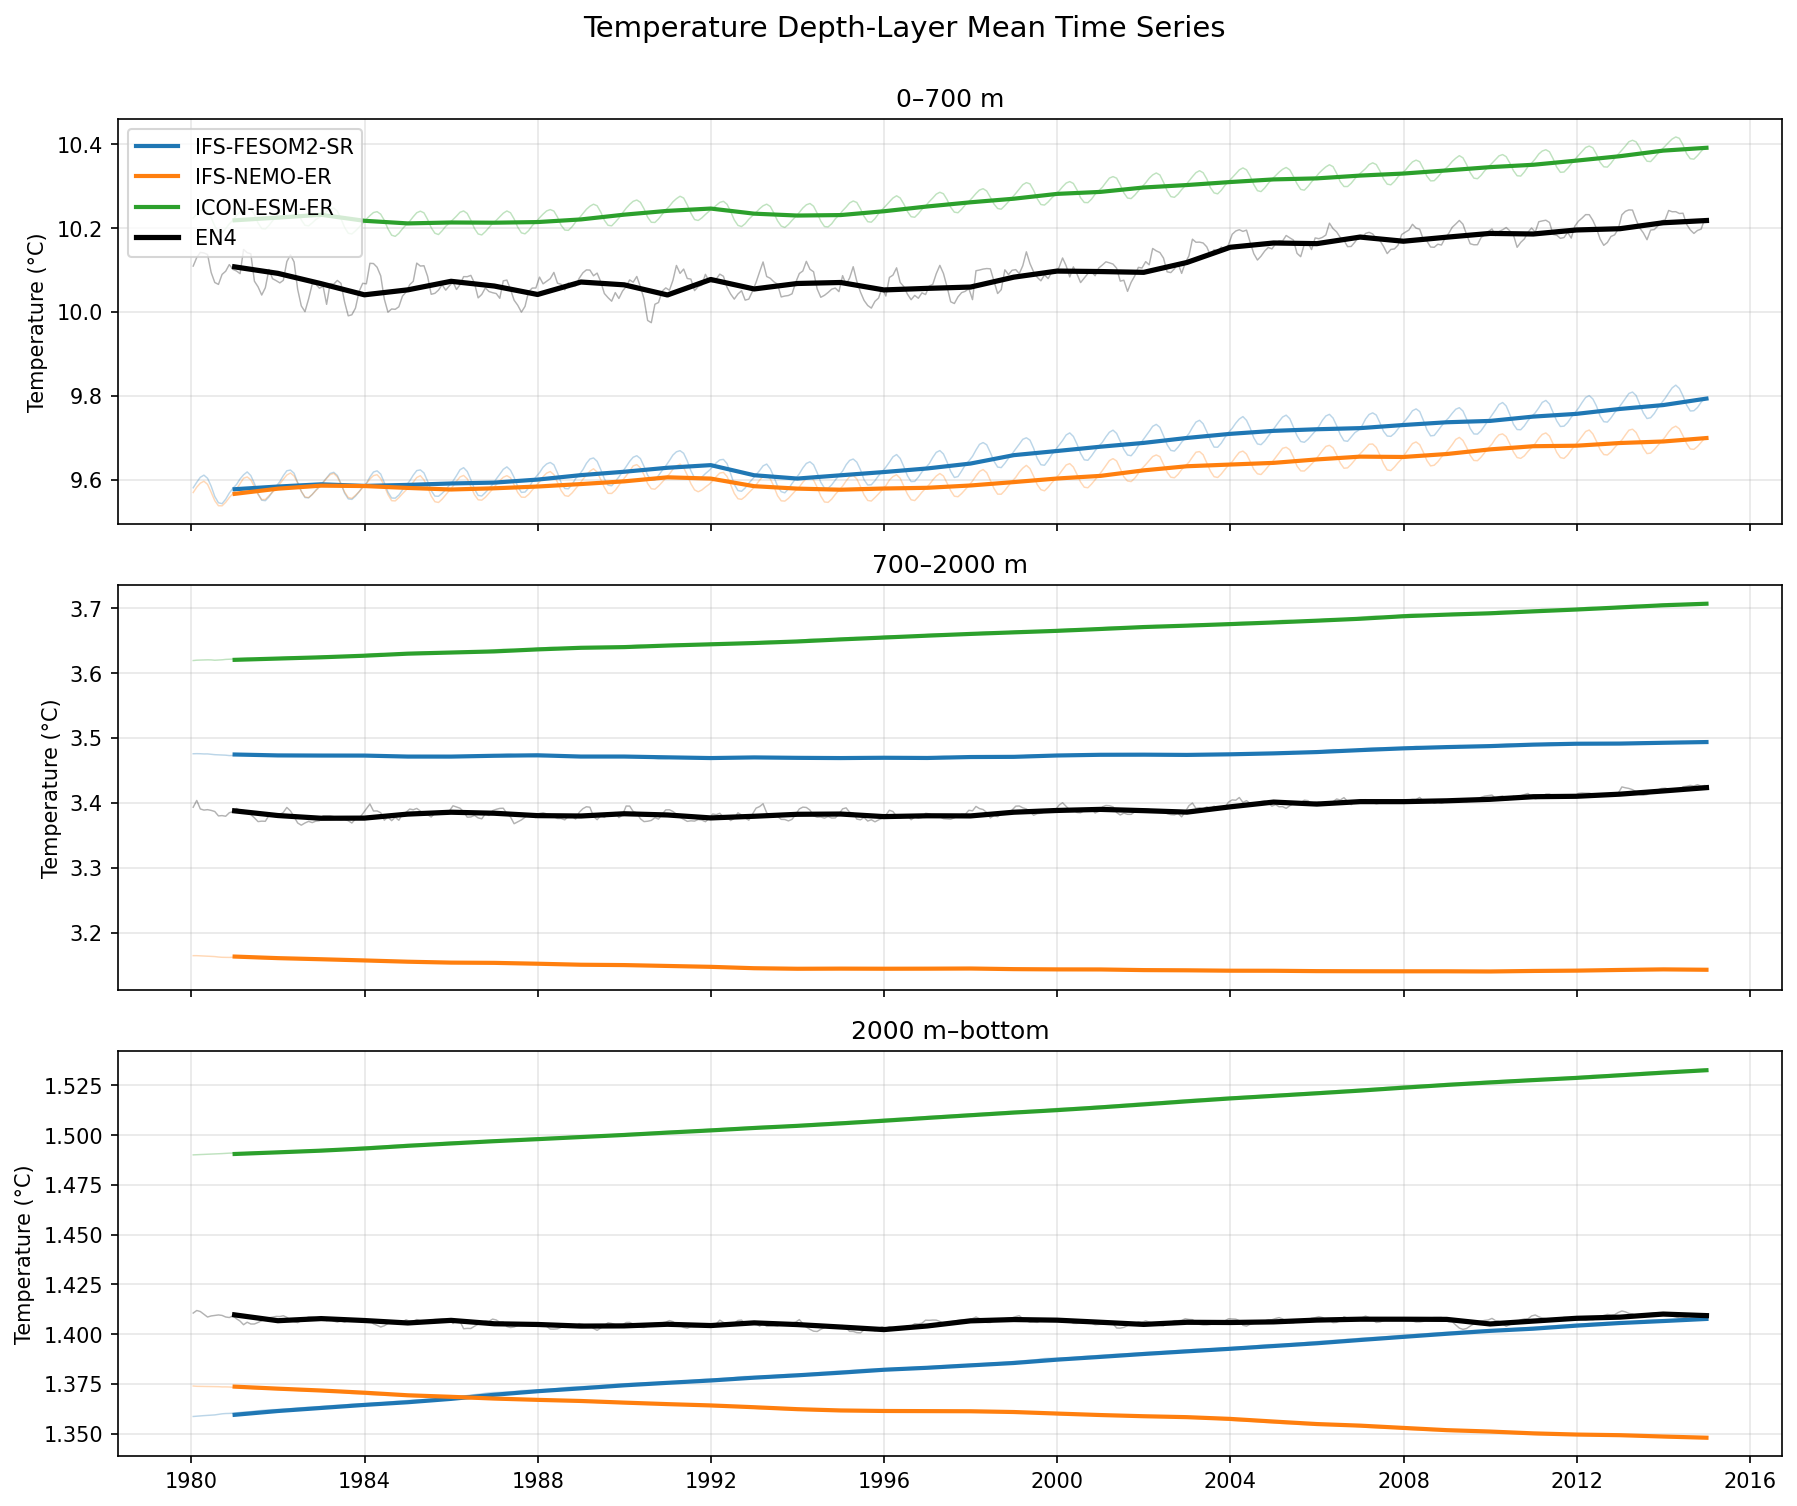
This figure presents time series (1980–2014) of global volume-weighted mean ocean potential temperature in three depth layers (0–700 m, 700–2000 m, and >2000 m) for three high-resolution coupled models compared to EN4 observations.
Key Findings
- ICON-ESM-ER exhibits a consistent warm bias across all depth layers, with a particularly strong warming drift in the upper (0–700 m) and deep (>2000 m) ocean relative to observations.
- Both IFS-based models (IFS-FESOM2-SR and IFS-NEMO-ER) show a distinct cold bias of ~0.5°C in the upper ocean (0–700 m) but capture the interannual variability better than ICON.
- Deep ocean (>2000 m) trends diverge significantly: ICON warms linearly, IFS-FESOM2-SR warms rapidly (crossing observations around 2012), while IFS-NEMO-ER exhibits a gradual cooling drift.
- In the intermediate layer (700–2000 m), model biases are static but stratified: ICON is ~0.25°C too warm, IFS-FESOM2 is ~0.1°C too warm, and IFS-NEMO is ~0.2°C too cold.
Spatial Patterns
Vertically, biases flip or persist depending on the model. ICON is consistently warm throughout the column. IFS-NEMO is cold in the upper and intermediate ocean, and cooling in the deep ocean. IFS-FESOM2 transitions from a cold bias in the upper ocean to a warm bias in the intermediate/deep ocean.
Model Agreement
There is poor inter-model agreement on absolute temperature values (spreads of ~0.5°C in upper ocean). However, the two IFS models agree closely on upper-ocean magnitude (both cold), suggesting the atmospheric component drives the surface bias, while their deep ocean trends diverge, pointing to differences in ocean model numerics (FESOM vs. NEMO).
Physical Interpretation
ICON-ESM-ER appears to have a positive top-of-atmosphere radiative imbalance leading to excessive heat uptake, which is efficiently mixed into the deep ocean. The shared upper-ocean cold bias in IFS-FESOM2 and IFS-NEMO suggests an atmospheric driver common to the IFS configuration (e.g., surface flux errors or cloud radiative effects). The divergence in deep ocean drifts between FESOM2 (warming) and NEMO (cooling) likely reflects differences in vertical mixing parameterizations, grid discretization, and initialization adjustment timescales.
Caveats
- Deep ocean observational data (EN4) prior to the Argo era (pre-2000s) has higher uncertainty due to sparse sampling.
- The linear drifts in the deep ocean suggest the models have not reached equilibrium and are still adjusting to initial conditions or persistent radiative imbalances.
Temperature Hovmoller (first-timestep anomaly)
| Variables | thetao, so |
|---|---|
| Models | IFS-FESOM2-SR, IFS-NEMO-ER, ICON-ESM-ER |
| Reference Dataset | EN4 v4.2.2 |
| Units | K |
| Period | 1980–2014 |
Summary high
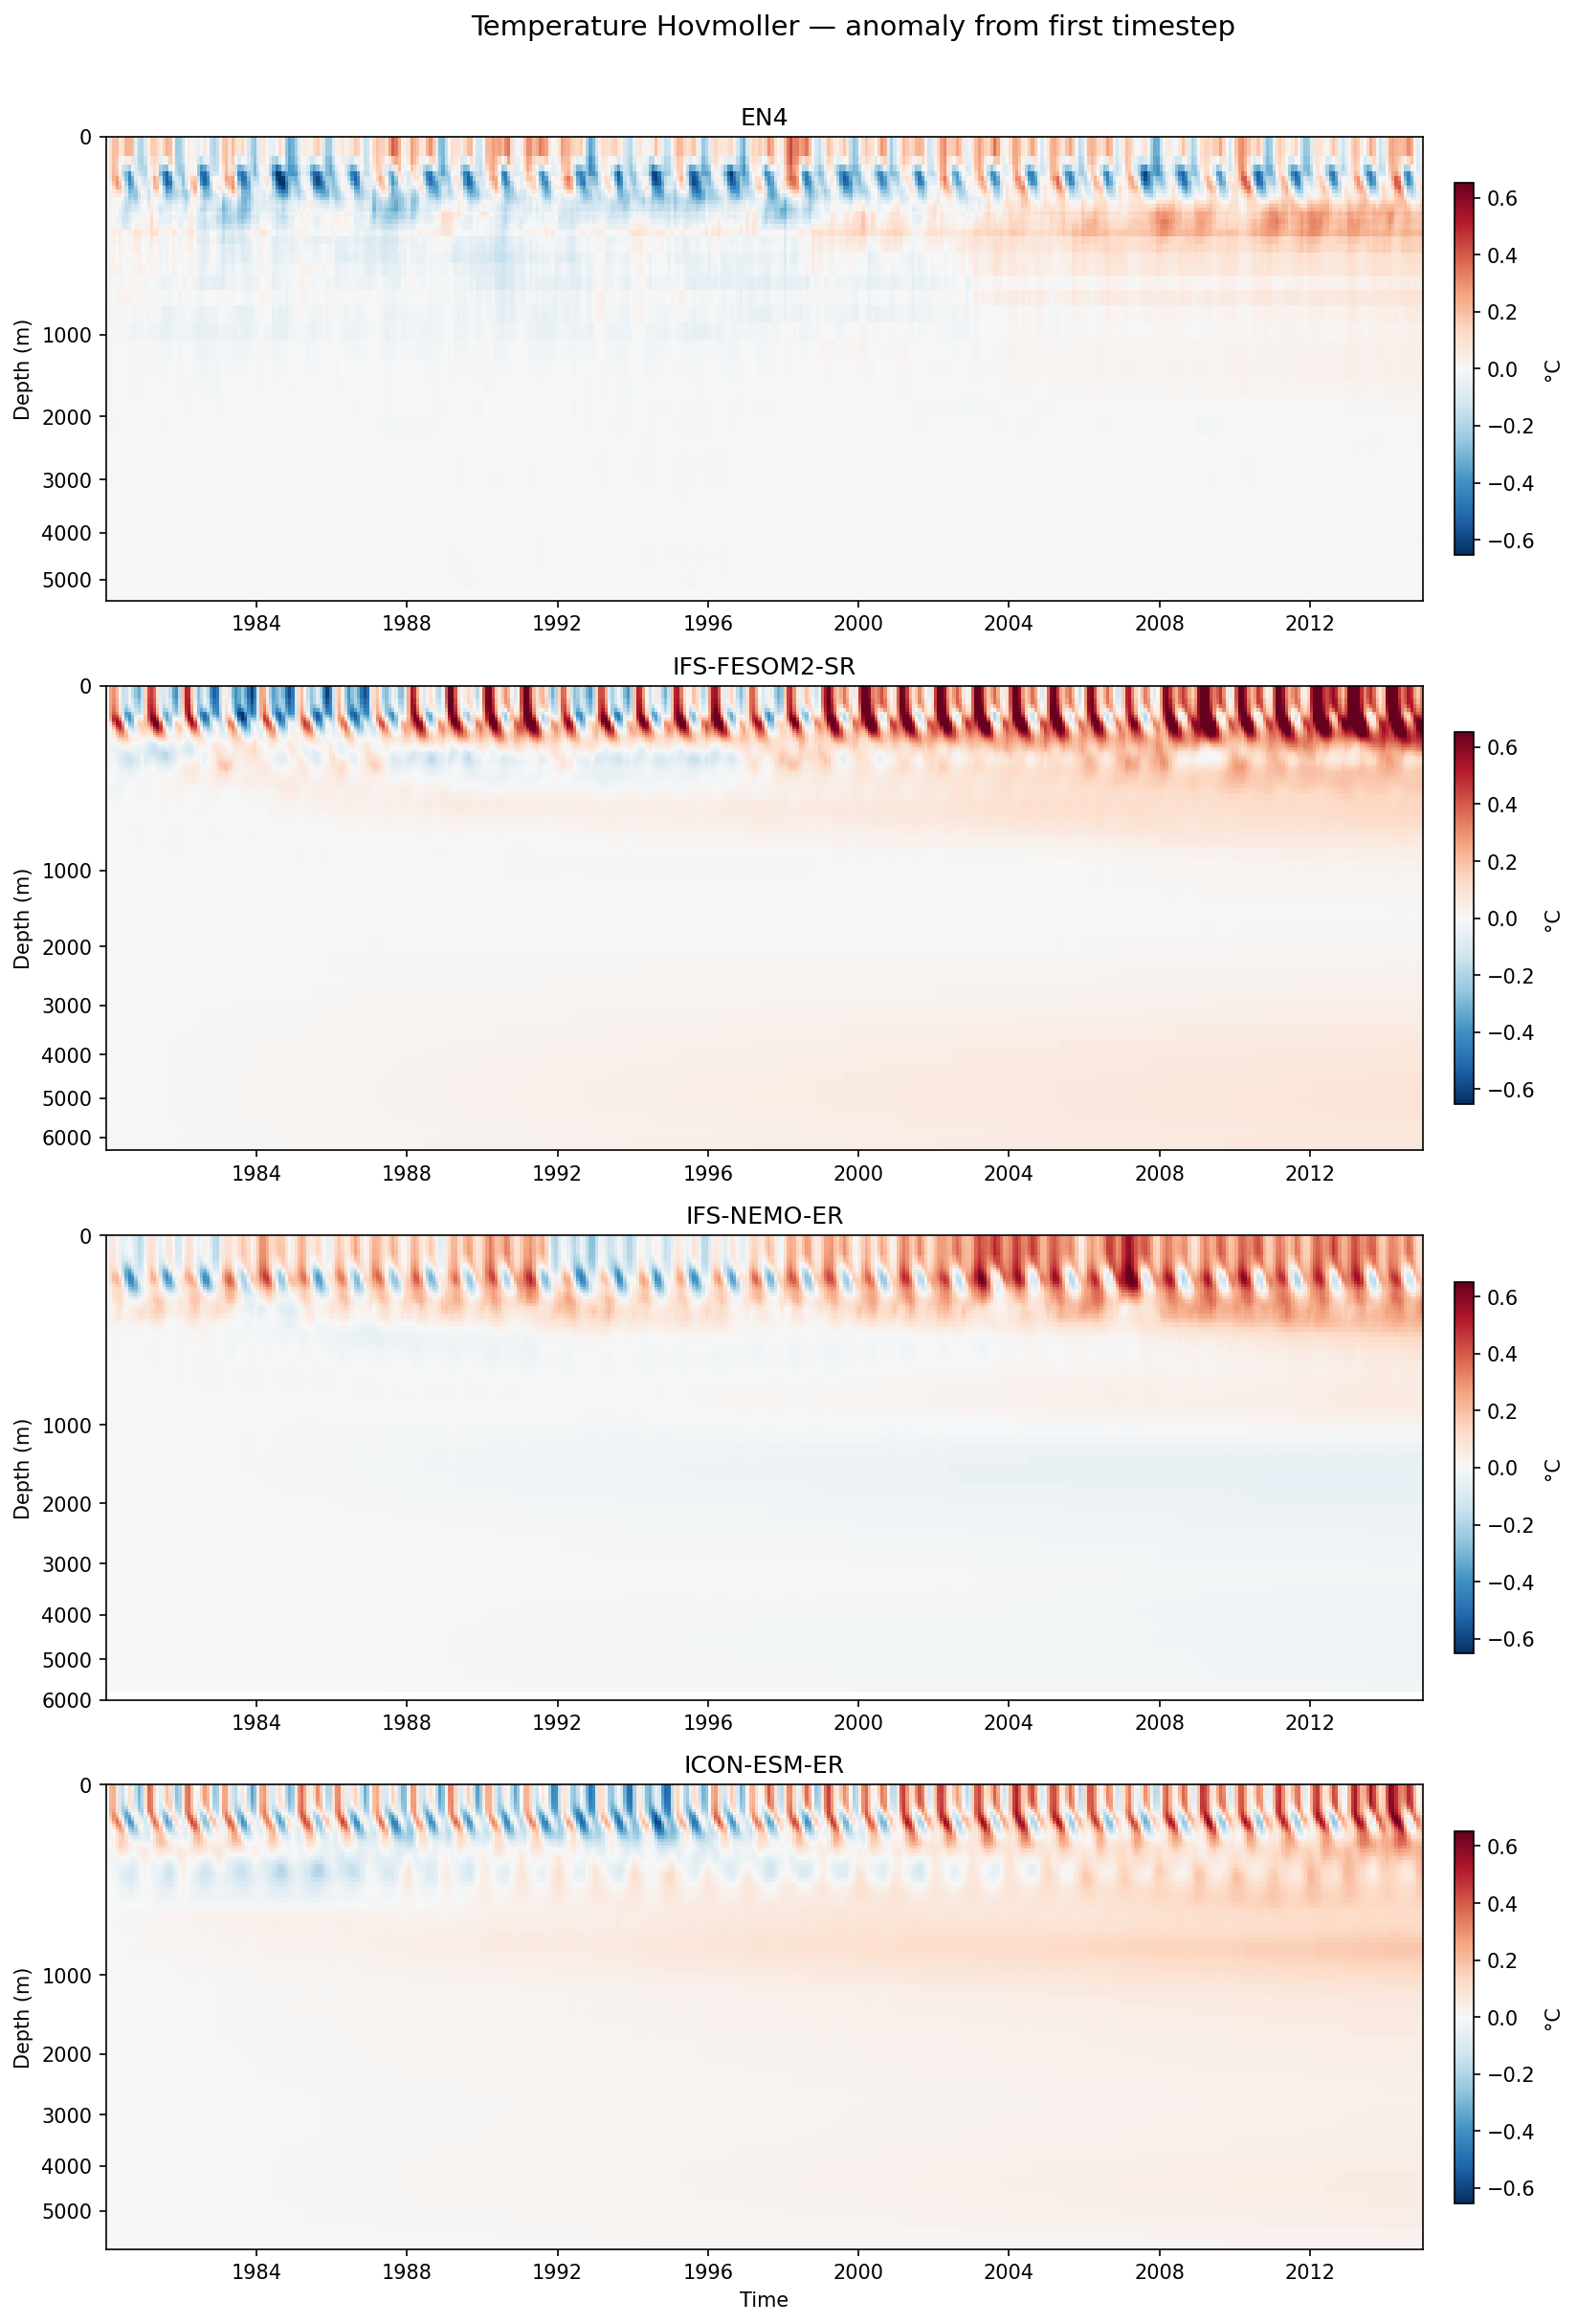
Time-depth Hovmoller diagrams of global ocean temperature anomalies (relative to the first timestep) reveal that while all models capture surface seasonality and recent upper-ocean warming, they exhibit significant differences in subsurface stability and deep-ocean drift compared to EN4 observations.
Key Findings
- EN4 observations show distinct warming confined largely to the upper 1000 m, with a notable acceleration after the late 1990s and a stable deep ocean.
- ICON-ESM-ER exhibits the most severe drift, with strong, continuous warming penetrating the entire water column (down to 5000+ m) significantly exceeding observed rates.
- IFS-FESOM2-SR shows strong warming similar to ICON but slightly less pervasive in the abyss; it notably overestimates heat penetration depth compared to EN4.
- IFS-NEMO-ER displays a different behavior with an initial subsurface cooling (200–1000 m) lasting until ~2000, followed by warming; its deep ocean (>2000 m) remains the most stable and closest to observations.
Spatial Patterns
Heat penetration signals propagate downward over time. In EN4, warming is concentrated in the 0–1000 m layer. In contrast, ICON and FESOM show warming signals reaching the bottom. High-frequency vertical striping in the top ~200 m reflects the seasonal cycle, which is consistently captured across models.
Model Agreement
Models diverge significantly in the deep ocean (>1000 m). IFS-NEMO-ER agrees best with EN4 regarding deep ocean stability, whereas ICON-ESM-ER and IFS-FESOM2-SR show substantial warming biases (drift). In the upper ocean, all models show warming trends, though the magnitude and onset vary.
Physical Interpretation
The pervasive warming in ICON-ESM-ER and IFS-FESOM2-SR suggests a substantial positive top-of-atmosphere energy imbalance that is being sequestered into the deep ocean, or a model initialization shock leading to diffusive warming drift. The initial subsurface cooling in IFS-NEMO-ER likely reflects a dynamic adjustment of the thermocline or overturning circulation from the initial state.
Caveats
- Anomalies relative to the first timestep conflate the forced climate change signal with intrinsic model drift.
- Global averaging obscures regional patterns of heat uptake (e.g., North Atlantic vs. Southern Ocean).
Temperature Hovmoller (EN4-ref anomaly)
| Variables | thetao, so |
|---|---|
| Models | IFS-FESOM2-SR, IFS-NEMO-ER, ICON-ESM-ER |
| Reference Dataset | EN4 v4.2.2 |
| Units | K |
| Period | 1980–2014 |
Summary high
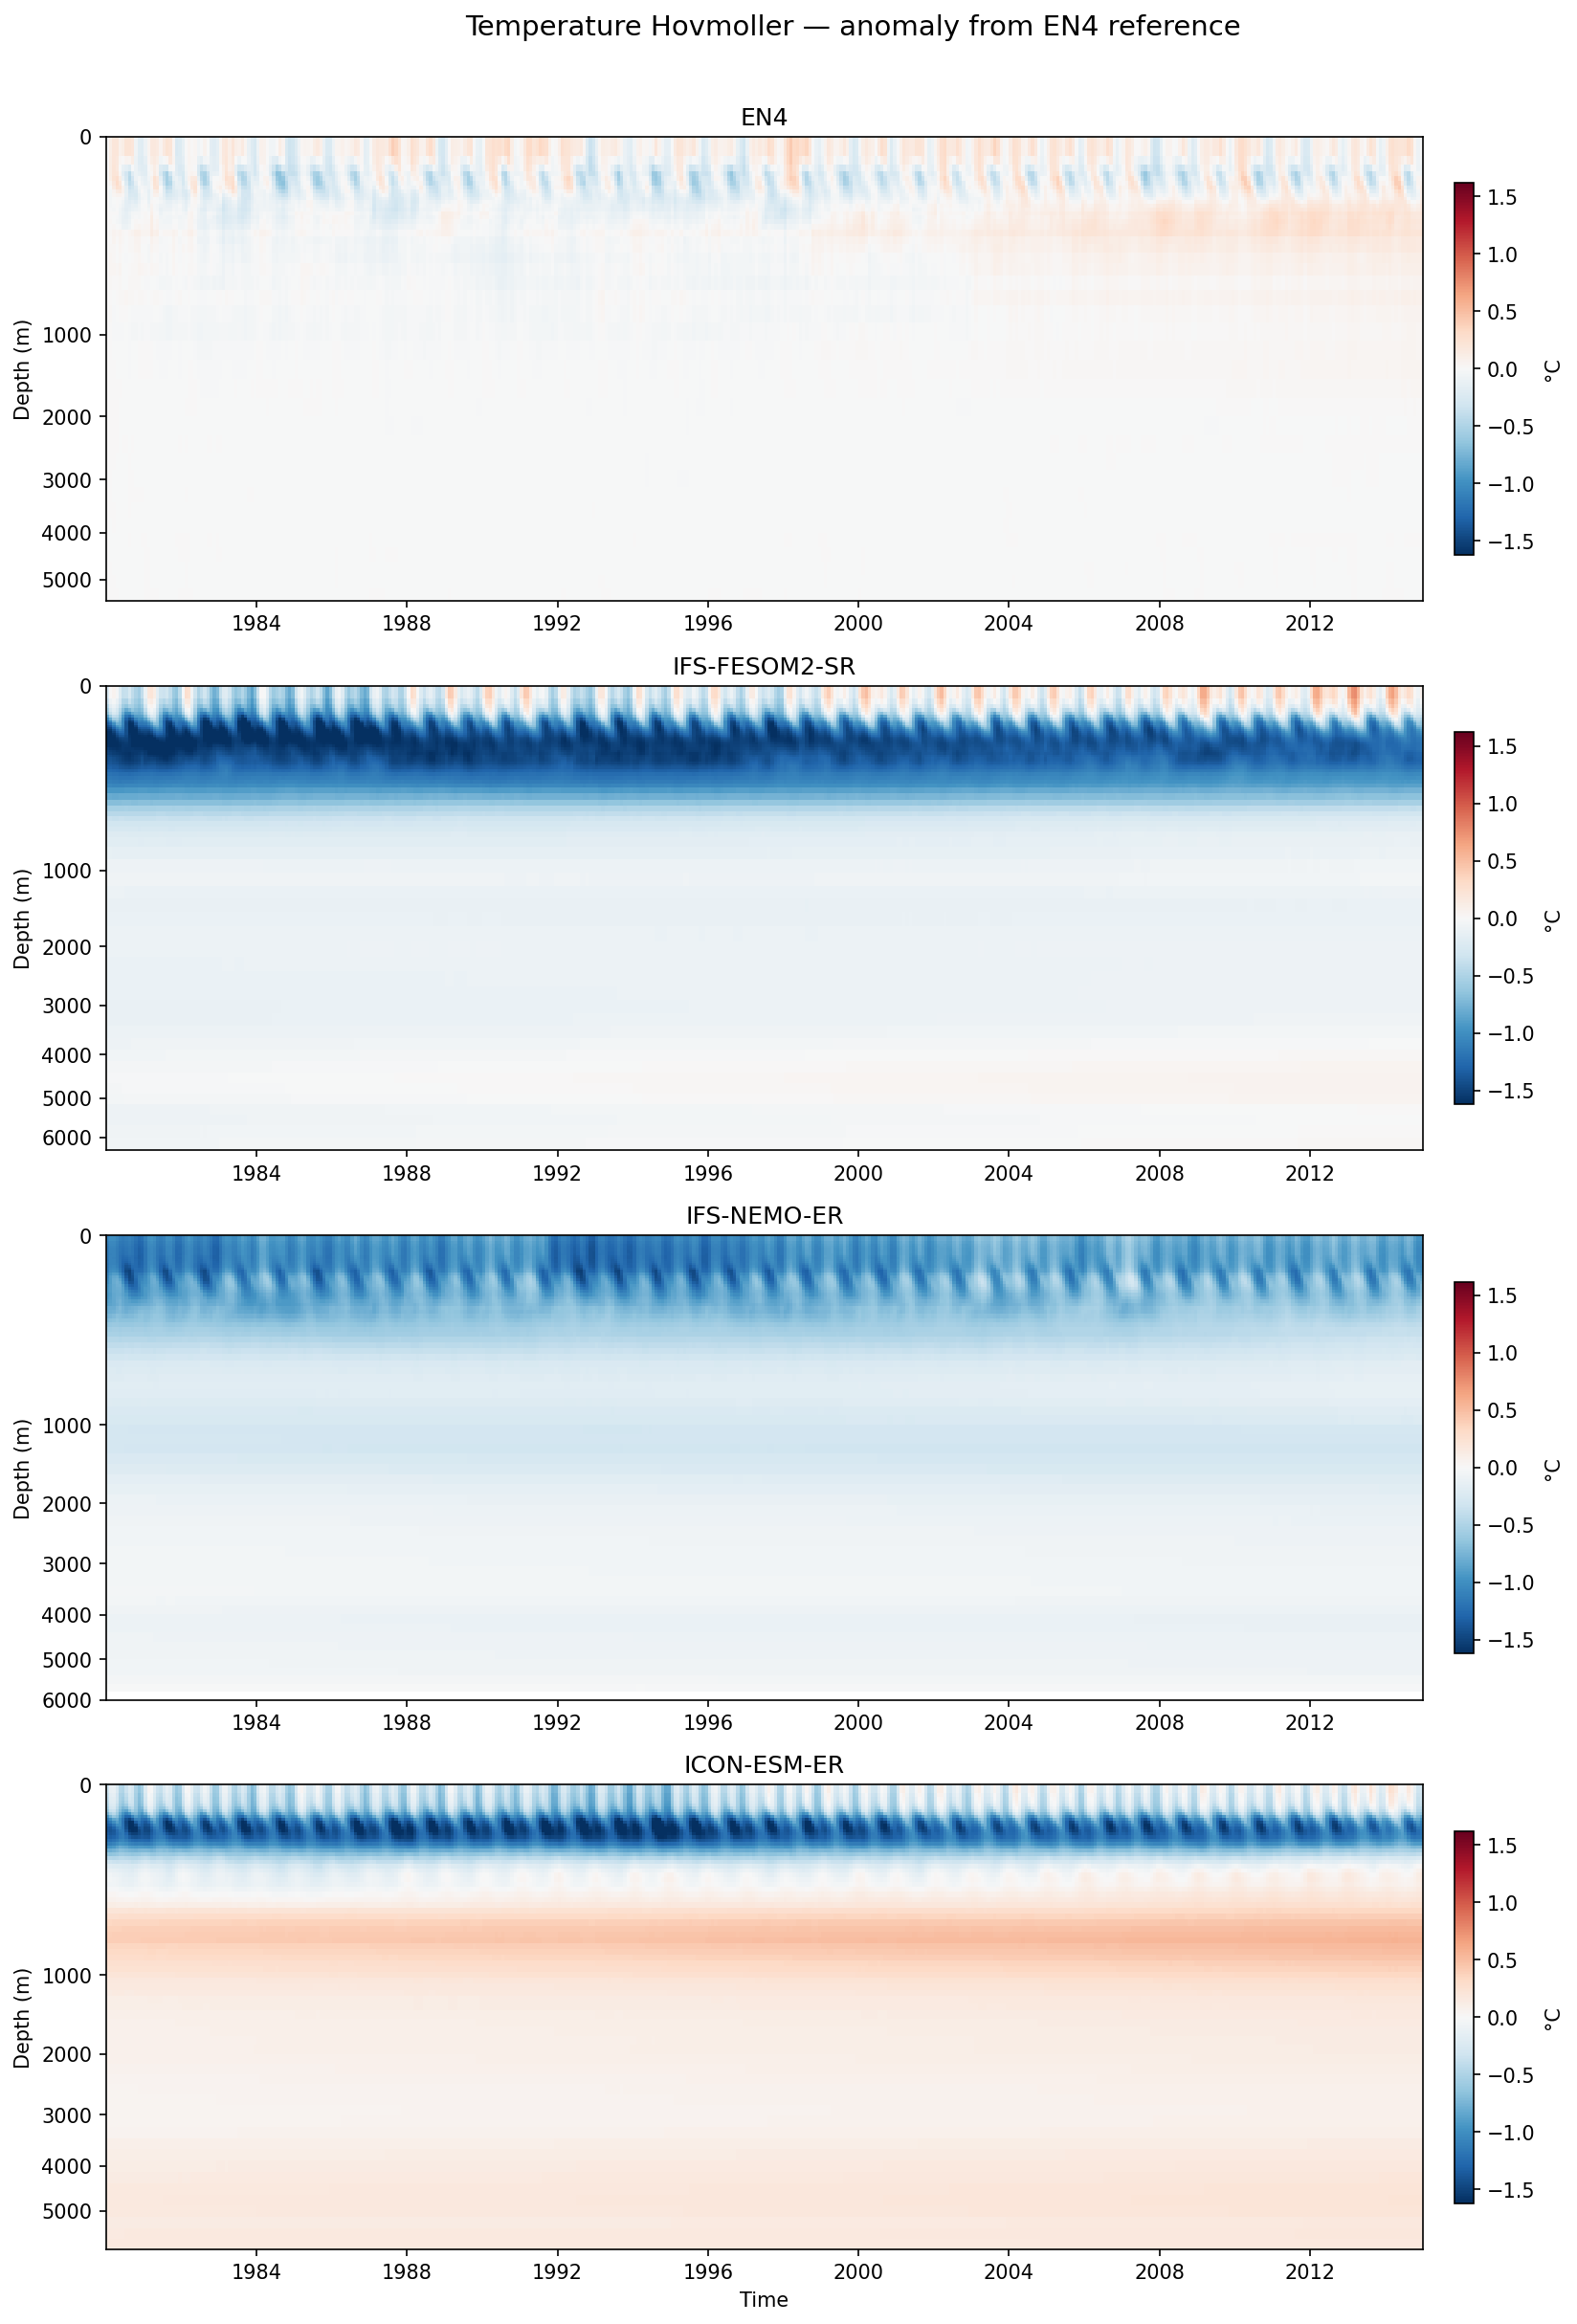
Time-depth Hovmoller diagrams showing the evolution of global mean ocean temperature anomalies (relative to the EN4 initial reference profile) for three high-resolution coupled models compared to EN4 observations.
Key Findings
- All three models exhibit a rapid and persistent cold drift in the upper ocean (0–500 m) relative to the EN4 reference, with magnitudes (<-1.5°C) significantly exceeding the observed climate warming signal.
- ICON-ESM-ER displays a unique vertical dipole bias structure: a strong cold anomaly in the upper 500 m contrasted by a prominent warm anomaly band between 500 m and 2000 m.
- IFS-FESOM2-SR shows the most intense near-surface cold bias, sharply confined to the upper ~500 m, while IFS-NEMO-ER exhibits a more diffuse cold bias extending down to ~1500 m.
- The observational panel (EN4) confirms a slight upper-ocean warming trend over the 1980–2014 period, which is completely overwhelmed by the strong cold drift in the model simulations.
Spatial Patterns
The primary patterns are vertical. IFS simulations show a monotonic decay of the cold bias with depth, stabilizing below 2000 m. ICON shows a complex structure with a cold surface layer, a warm intermediate layer (500-2000 m), and slight abyssal warming (>4000 m). Strong vertical striping in the upper ocean of the model panels indicates a seasonal cycle in the bias (or a seasonal cycle in the model not present in the static reference).
Model Agreement
Models agree on the sign of the surface drift (cooling), indicating a common systematic error in the surface energy budget or upper-ocean mixing at this resolution. They disagree significantly on subsurface behavior, particularly the intermediate-depth warming seen only in ICON.
Physical Interpretation
The pervasive surface cold bias suggests a negative net surface energy imbalance, potentially driven by excessive low cloud reflection or insufficient solar absorption, which is a common tuning challenge in high-resolution coupled models. The rapid onset implies an initialization shock. ICON's intermediate warming suggests excessive downward heat transport or issues with the formation and ventilation of intermediate water masses (e.g., anomalies in overflow parameterizations).
Caveats
- Global averaging obscures regional bias patterns (e.g., North Atlantic vs. Tropical Pacific).
- Anomalies are relative to the first timestep, conflating model drift with actual interannual variability and climate trends.