Evaluation Global Linear Trends CMIP6
CMIP6 Multi-Model Mean Context
Comparison with CMIP6 ensemble mean from 11 members.
Contributing models: ACCESS-ESM1-5, AWI-CM-1-1-MR, CNRM-CM6-1, CNRM-ESM2-1, EC-Earth3, FGOALS-g3, GISS-E2-1-G, INM-CM5-0, IPSL-CM6A-LR, MPI-ESM1-2-LR, MRI-ESM2-0
Synthesis
Related diagnostics
Total Cloud Cover Annual Linear Trend
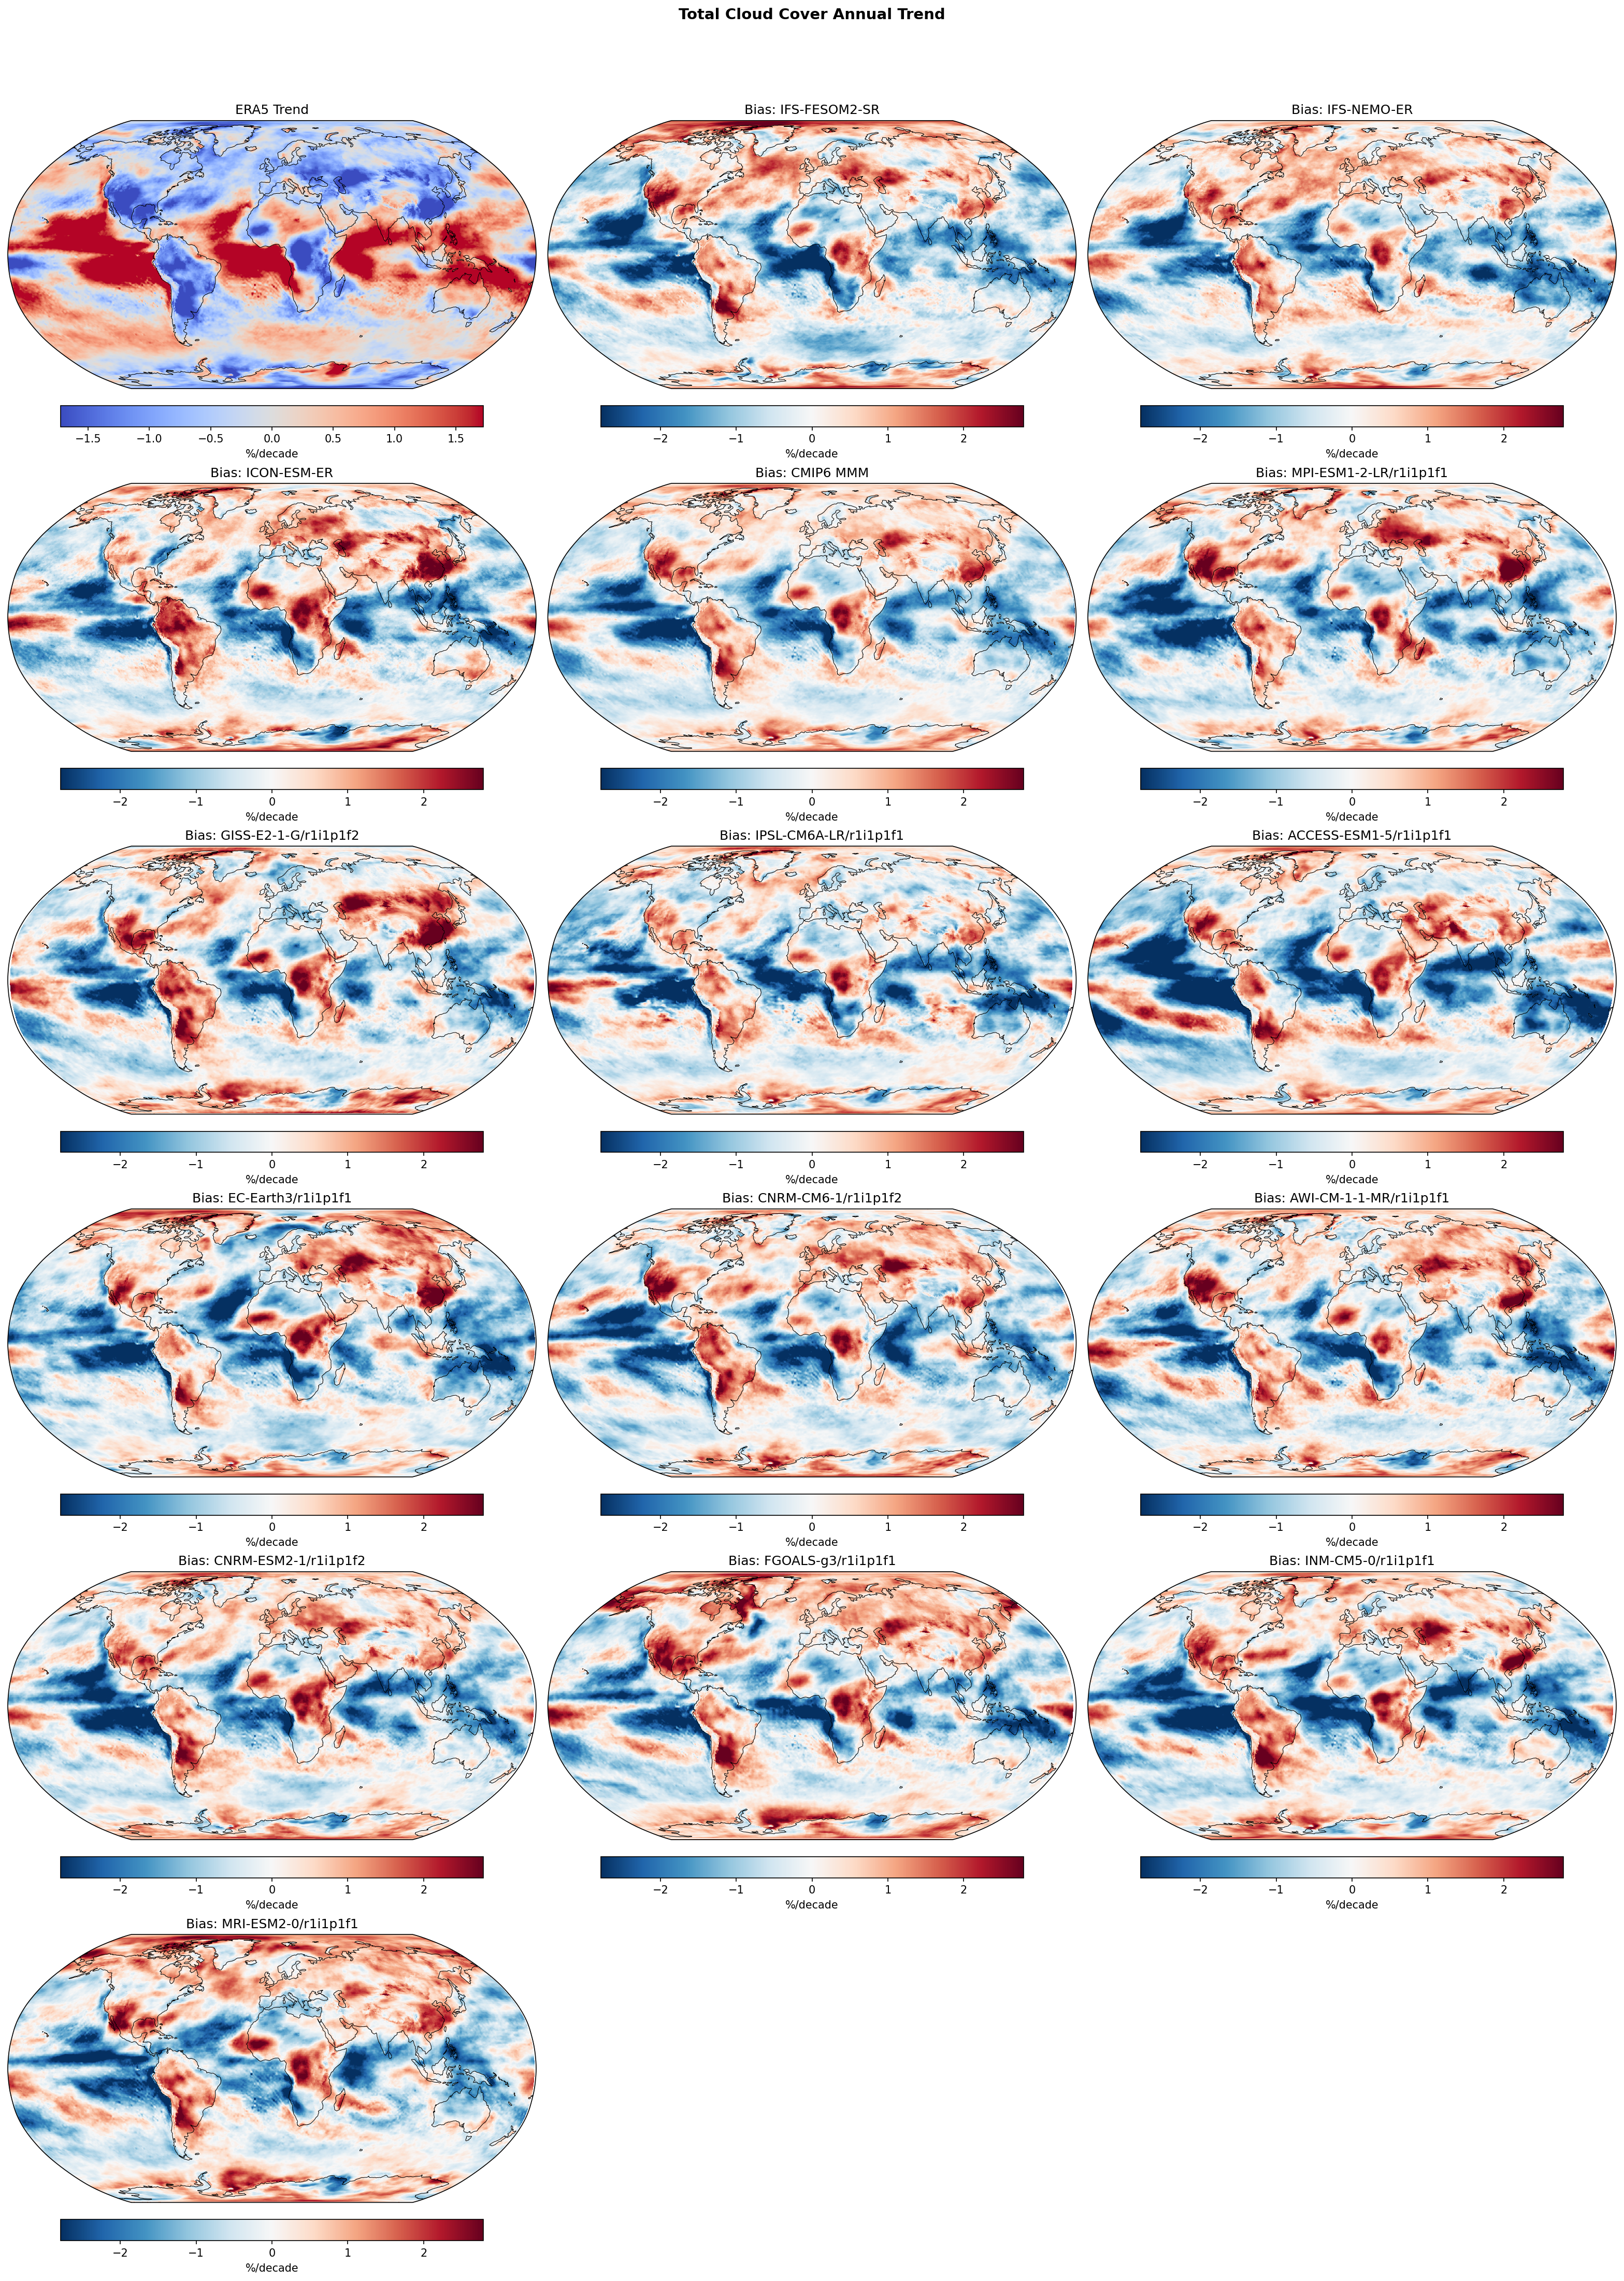
| Variables | clt |
|---|---|
| Models | IFS-FESOM2-SR, IFS-NEMO-ER, ICON-ESM-ER, CMIP6 MMM, MPI-ESM1-2-LR/r1i1p1f1, GISS-E2-1-G/r1i1p1f2, IPSL-CM6A-LR/r1i1p1f1, ACCESS-ESM1-5/r1i1p1f1, EC-Earth3/r1i1p1f1, CNRM-CM6-1/r1i1p1f2, AWI-CM-1-1-MR/r1i1p1f1, CNRM-ESM2-1/r1i1p1f2, FGOALS-g3/r1i1p1f1, INM-CM5-0/r1i1p1f1, MRI-ESM2-0/r1i1p1f1 |
| Reference Dataset | ERA5 |
| Units | %/decade |
| Period | 1980–2014 |
| IFS-FESOM2-SR | Global Mean Trend: -0.09 · Global Mean Trend Diff: -0.29 · Trend Rmse: 1.14 |
| IFS-NEMO-ER | Global Mean Trend: 0.02 · Global Mean Trend Diff: -0.18 · Trend Rmse: 1.05 |
| ICON-ESM-ER | Global Mean Trend: 0.04 · Global Mean Trend Diff: -0.15 · Trend Rmse: 1.15 |
| CMIP6 MMM | Global Mean Trend Diff: -0.24 · Trend Rmse: 1.06 |
| MPI-ESM1-2-LR/r1i1p1f1 | Global Mean Trend Diff: -0.27 · Trend Rmse: 1.16 |
| GISS-E2-1-G/r1i1p1f2 | Global Mean Trend Diff: -0.10 · Trend Rmse: 1.13 |
| IPSL-CM6A-LR/r1i1p1f1 | Global Mean Trend Diff: -0.32 · Trend Rmse: 1.12 |
| ACCESS-ESM1-5/r1i1p1f1 | Global Mean Trend Diff: -0.44 · Trend Rmse: 1.39 |
| EC-Earth3/r1i1p1f1 | Global Mean Trend Diff: -0.32 · Trend Rmse: 1.19 |
| CNRM-CM6-1/r1i1p1f2 | Global Mean Trend Diff: -0.25 · Trend Rmse: 1.14 |
| AWI-CM-1-1-MR/r1i1p1f1 | Global Mean Trend Diff: -0.20 · Trend Rmse: 1.14 |
| CNRM-ESM2-1/r1i1p1f2 | Global Mean Trend Diff: -0.21 · Trend Rmse: 1.12 |
| FGOALS-g3/r1i1p1f1 | Global Mean Trend Diff: -0.10 · Trend Rmse: 1.16 |
| INM-CM5-0/r1i1p1f1 | Global Mean Trend Diff: -0.30 · Trend Rmse: 1.25 |
| MRI-ESM2-0/r1i1p1f1 | Global Mean Trend Diff: -0.15 · Trend Rmse: 1.13 |
Summary high
This figure compares the linear trend in total cloud cover (1980–2014) from ERA5 reanalysis against high-resolution EERIE models and the CMIP6 ensemble, revealing systematic discrepancies in the tropical Pacific.
Key Findings
- Models systematically fail to capture the observed 'La Niña-like' trend pattern in the Pacific (cloud loss in the East, gain in the West), resulting in a strong dipole bias (positive bias in the East, negative in the West).
- High-resolution models (IFS-FESOM2-SR, IFS-NEMO-ER, ICON-ESM-ER) exhibit the same large-scale bias patterns as the standard-resolution CMIP6 ensemble, indicating that horizontal resolution does not resolve this decadal trend discrepancy.
- Globally, models tend to simulate a more negative cloud cover trend (cloud loss) than observed in ERA5, with global mean trend differences ranging from -0.10 to -0.44 %/decade.
Spatial Patterns
ERA5 shows a distinct strengthening of the zonal cloud gradient in the Pacific (blue/drying trend in the East, red/moistening trend in the West). The bias maps for all models show the inverse pattern: red (overestimated trend) in the Eastern Pacific and blue (underestimated trend) in the Western Pacific/Maritime Continent. Similar positive biases appear over the North Atlantic.
Model Agreement
There is high agreement among all models (both high-resolution and CMIP6) regarding the spatial structure of the error. No single model successfully captures the magnitude of the observed trends in the tropical Pacific or North Atlantic, suggesting a common forcing-response or variability mismatch.
Physical Interpretation
The discrepancy likely reflects the 'pattern effect' or internal variability mismatch: during 1980–2014, the real world experienced a strengthening Walker circulation (cooling East Pacific, warming West Pacific), while coupled models generally simulate a weakening circulation or uniform warming in response to GHGs. Consequently, models miss the associated cloud trends (stratocumulus clearing in the East, deep convection increase in the West).
Caveats
- ERA5 cloud trends are subject to inhomogeneities due to changes in the satellite observing system over the period.
- Coupled models are not expected to phase-match internal decadal variability (e.g., IPO/PDO); the mismatch may represent internal variability differences rather than physics errors.
Total Cloud Cover DJF Linear Trend
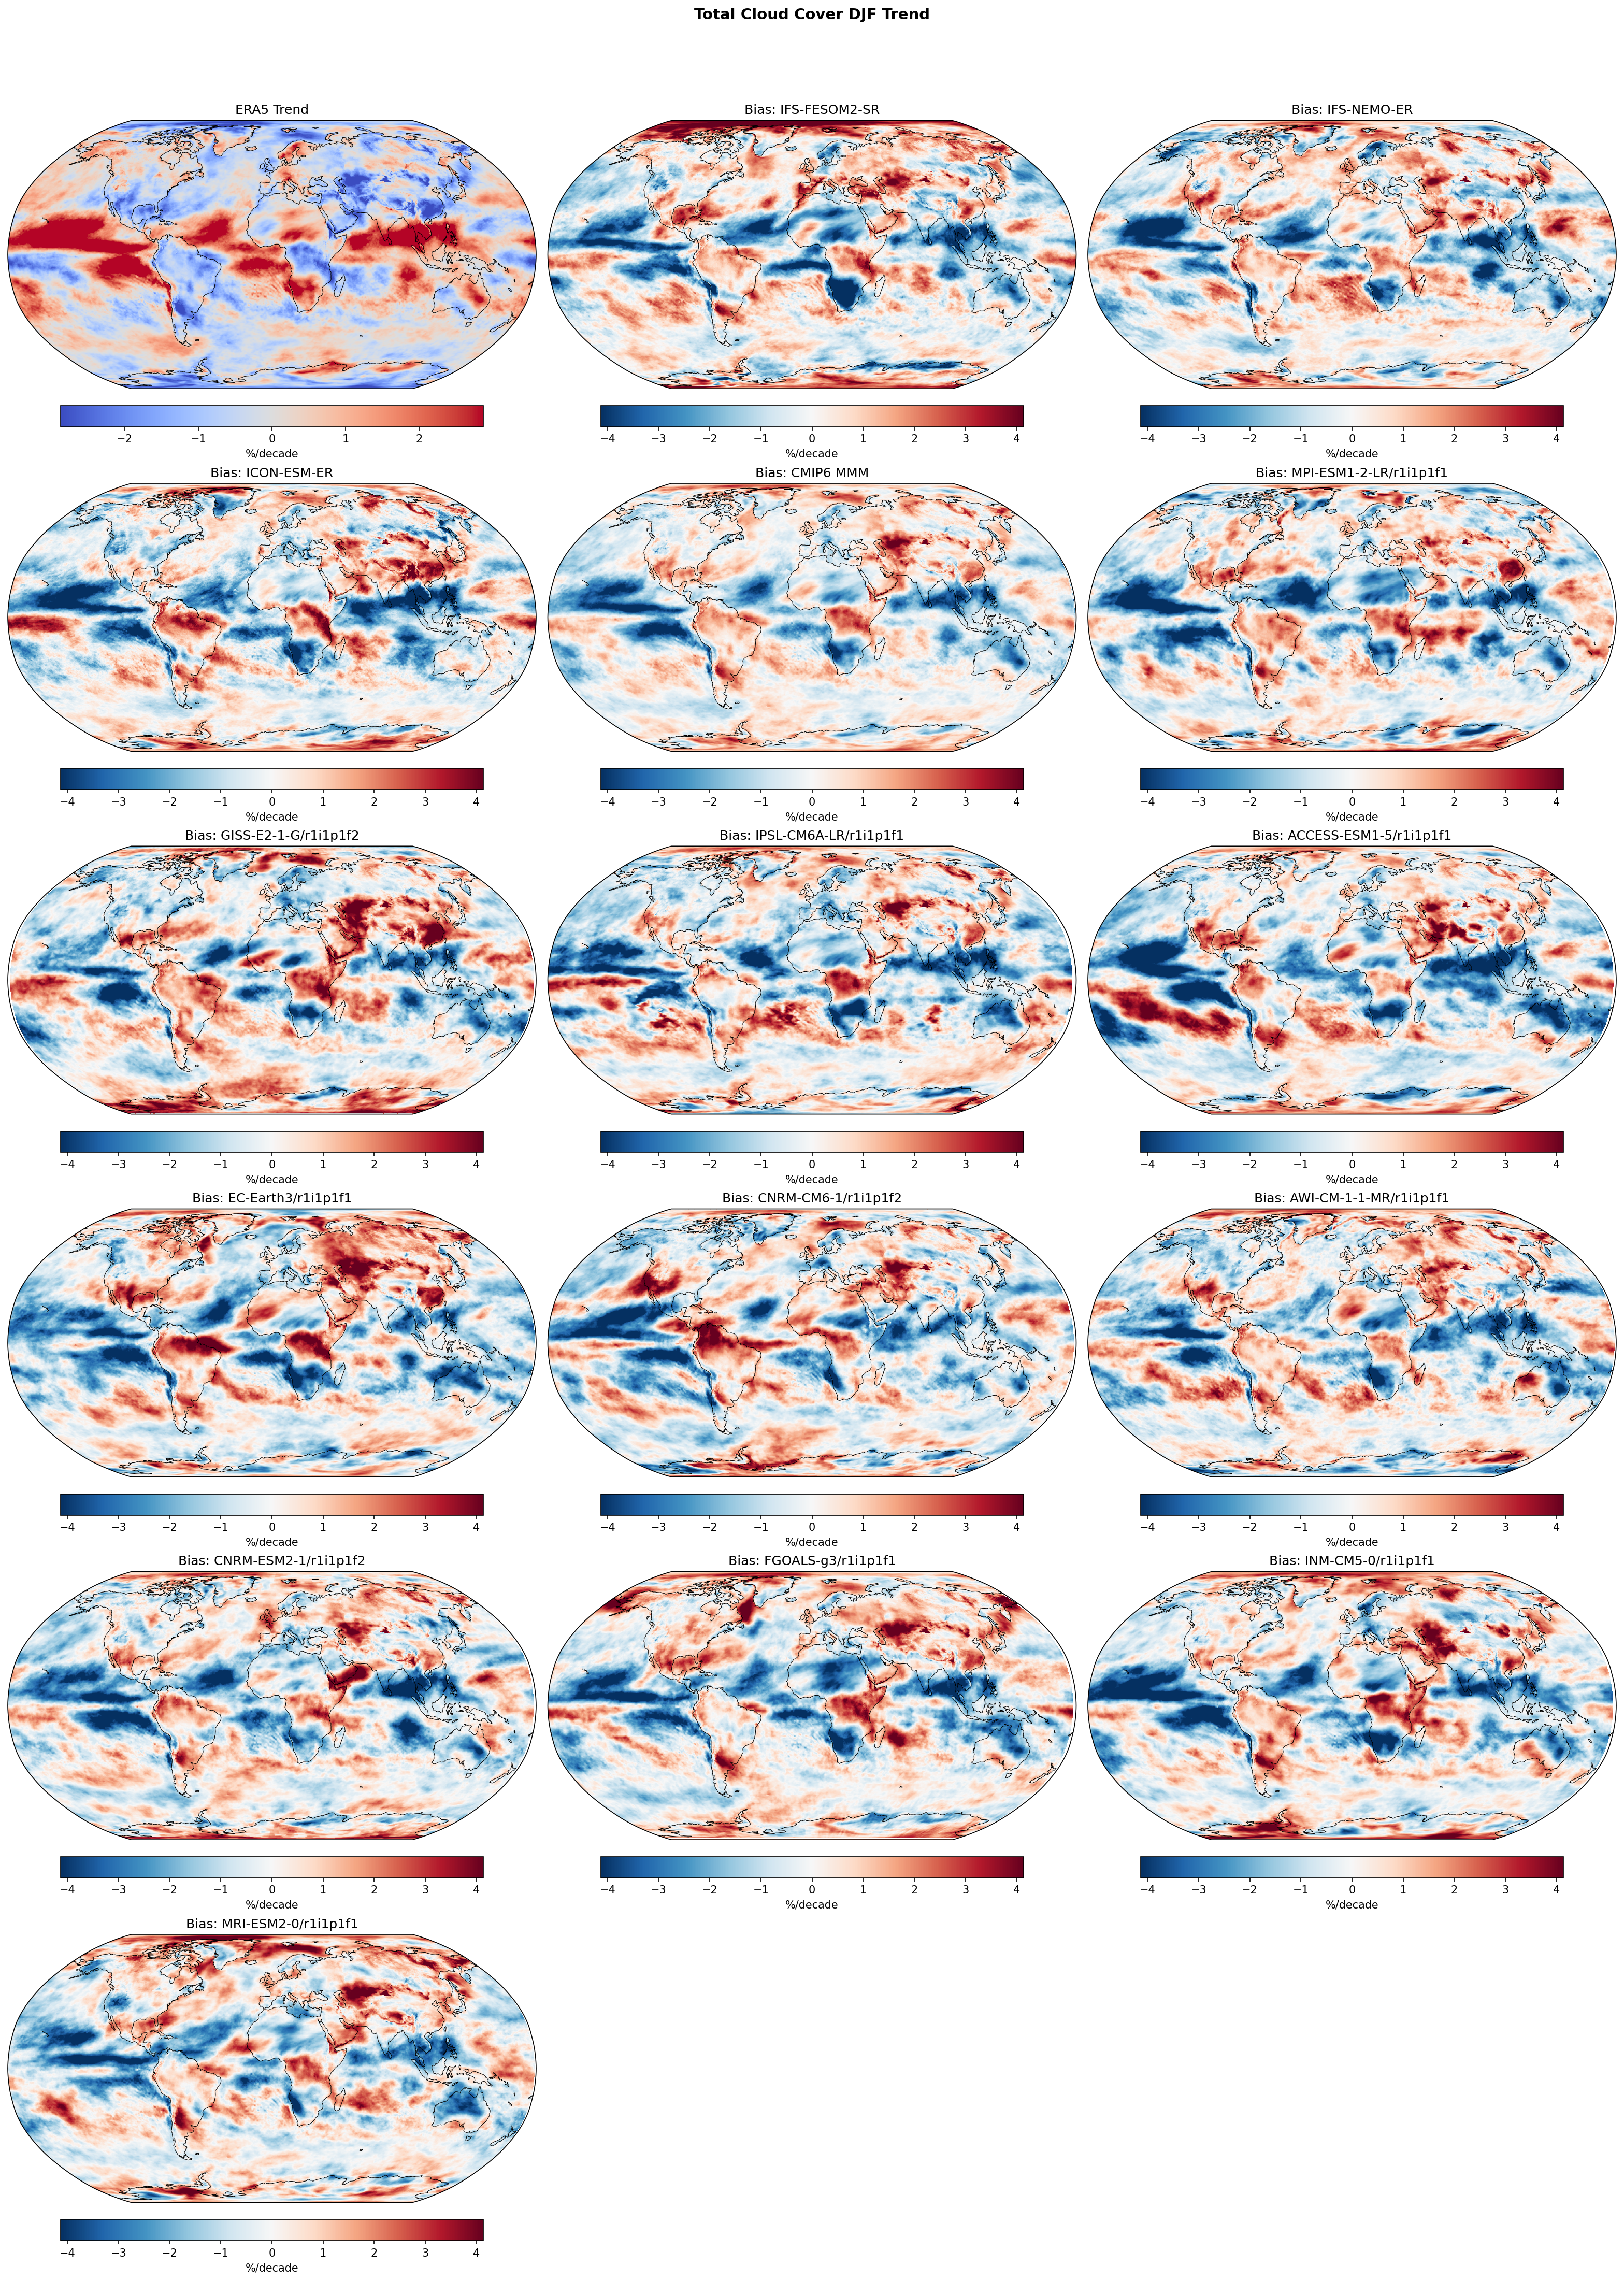
| Variables | clt |
|---|---|
| Models | IFS-FESOM2-SR, IFS-NEMO-ER, ICON-ESM-ER, CMIP6 MMM, MPI-ESM1-2-LR/r1i1p1f1, GISS-E2-1-G/r1i1p1f2, IPSL-CM6A-LR/r1i1p1f1, ACCESS-ESM1-5/r1i1p1f1, EC-Earth3/r1i1p1f1, CNRM-CM6-1/r1i1p1f2, AWI-CM-1-1-MR/r1i1p1f1, CNRM-ESM2-1/r1i1p1f2, FGOALS-g3/r1i1p1f1, INM-CM5-0/r1i1p1f1, MRI-ESM2-0/r1i1p1f1 |
| Reference Dataset | ERA5 |
| Units | %/decade |
| Period | 1980–2014 |
| CMIP6 MMM | Global Mean Trend Diff: -0.24 · Trend Rmse: None |
| MPI-ESM1-2-LR/r1i1p1f1 | Global Mean Trend Diff: -0.33 · Trend Rmse: None |
| GISS-E2-1-G/r1i1p1f2 | Global Mean Trend Diff: -0.01 · Trend Rmse: None |
| IPSL-CM6A-LR/r1i1p1f1 | Global Mean Trend Diff: -0.25 · Trend Rmse: None |
| ACCESS-ESM1-5/r1i1p1f1 | Global Mean Trend Diff: -0.38 · Trend Rmse: None |
| EC-Earth3/r1i1p1f1 | Global Mean Trend Diff: -0.24 · Trend Rmse: None |
| CNRM-CM6-1/r1i1p1f2 | Global Mean Trend Diff: -0.23 · Trend Rmse: None |
| AWI-CM-1-1-MR/r1i1p1f1 | Global Mean Trend Diff: -0.23 · Trend Rmse: None |
| CNRM-ESM2-1/r1i1p1f2 | Global Mean Trend Diff: -0.31 · Trend Rmse: None |
| FGOALS-g3/r1i1p1f1 | Global Mean Trend Diff: -0.22 · Trend Rmse: None |
| INM-CM5-0/r1i1p1f1 | Global Mean Trend Diff: -0.31 · Trend Rmse: None |
| MRI-ESM2-0/r1i1p1f1 | Global Mean Trend Diff: -0.14 · Trend Rmse: None |
Summary high
This figure evaluates linear trends in DJF Total Cloud Cover (1980–2014) by comparing ERA5 observations against high-resolution EERIE models and the CMIP6 ensemble. The analysis reveals a systematic, model-wide discrepancy in the tropical Pacific, where models fail to capture the observed zonal gradient in cloud cover trends.
Key Findings
- Systematic Pacific Bias: Nearly all models (EERIE and CMIP6) exhibit a 'dipole' error pattern in the tropical Pacific, characterized by a strong negative trend bias (blue) in the central/eastern Pacific and a positive trend bias (red) in the western Pacific, opposing the ERA5 observed trend.
- No Resolution Benefit: The high-resolution IFS and ICON models display the same Pacific trend biases as the standard-resolution CMIP6 models, indicating that km-scale resolution does not inherently correct this discrepancy.
- ICON Specifics: ICON-ESM-ER shows distinct positive trend biases (overestimation of cloud increase) over the Indian Ocean and Northern Hemisphere continents (Eurasia, North America) compared to the IFS models.
- High-Latitude Overestimation: Most models show positive trend biases over the Arctic and Southern Ocean, implying they simulate a stronger increase in polar cloud cover than observed in ERA5.
Spatial Patterns
The observational panel (ERA5) shows a notable increase in cloud cover (red) in the eastern tropical Pacific and decrease (blue) in the west. The model bias panels consistently show the inverse (blue in the east, red in the west), indicating the models predict a strengthening Walker-like cloud trend (or La Niña-like trend) that contrasts with the ERA5 dataset for this specific period.
Model Agreement
There is strong inter-model agreement regarding the sign of the error in the tropical Pacific. Differences arise in magnitude and regional specifics, such as ICON-ESM-ER showing stronger positive biases over land compared to IFS-NEMO-ER.
Physical Interpretation
The 1980–2014 period is relatively short and subject to strong internal decadal variability (e.g., IPO/PDO). Free-running coupled models generate their own internal variability phases which are not synchronized with the real world. The consistent mismatch suggests the observed trend was heavily influenced by a specific realization of internal variability (e.g., El Niño/La Niña frequency or IPO phase) that the models, averaging towards a forced response or different internal phase, do not reproduce.
Caveats
- Internal Variability: Comparing 35-year trends from free-running coupled models to observations is confounded by unforced internal variability; mismatches may be due to random phase differences rather than model physics errors.
- Reanalysis Stability: ERA5 cloud trends may contain artifacts from changes in the satellite observing system over the 1980–2014 period.
Total Cloud Cover JJA Linear Trend
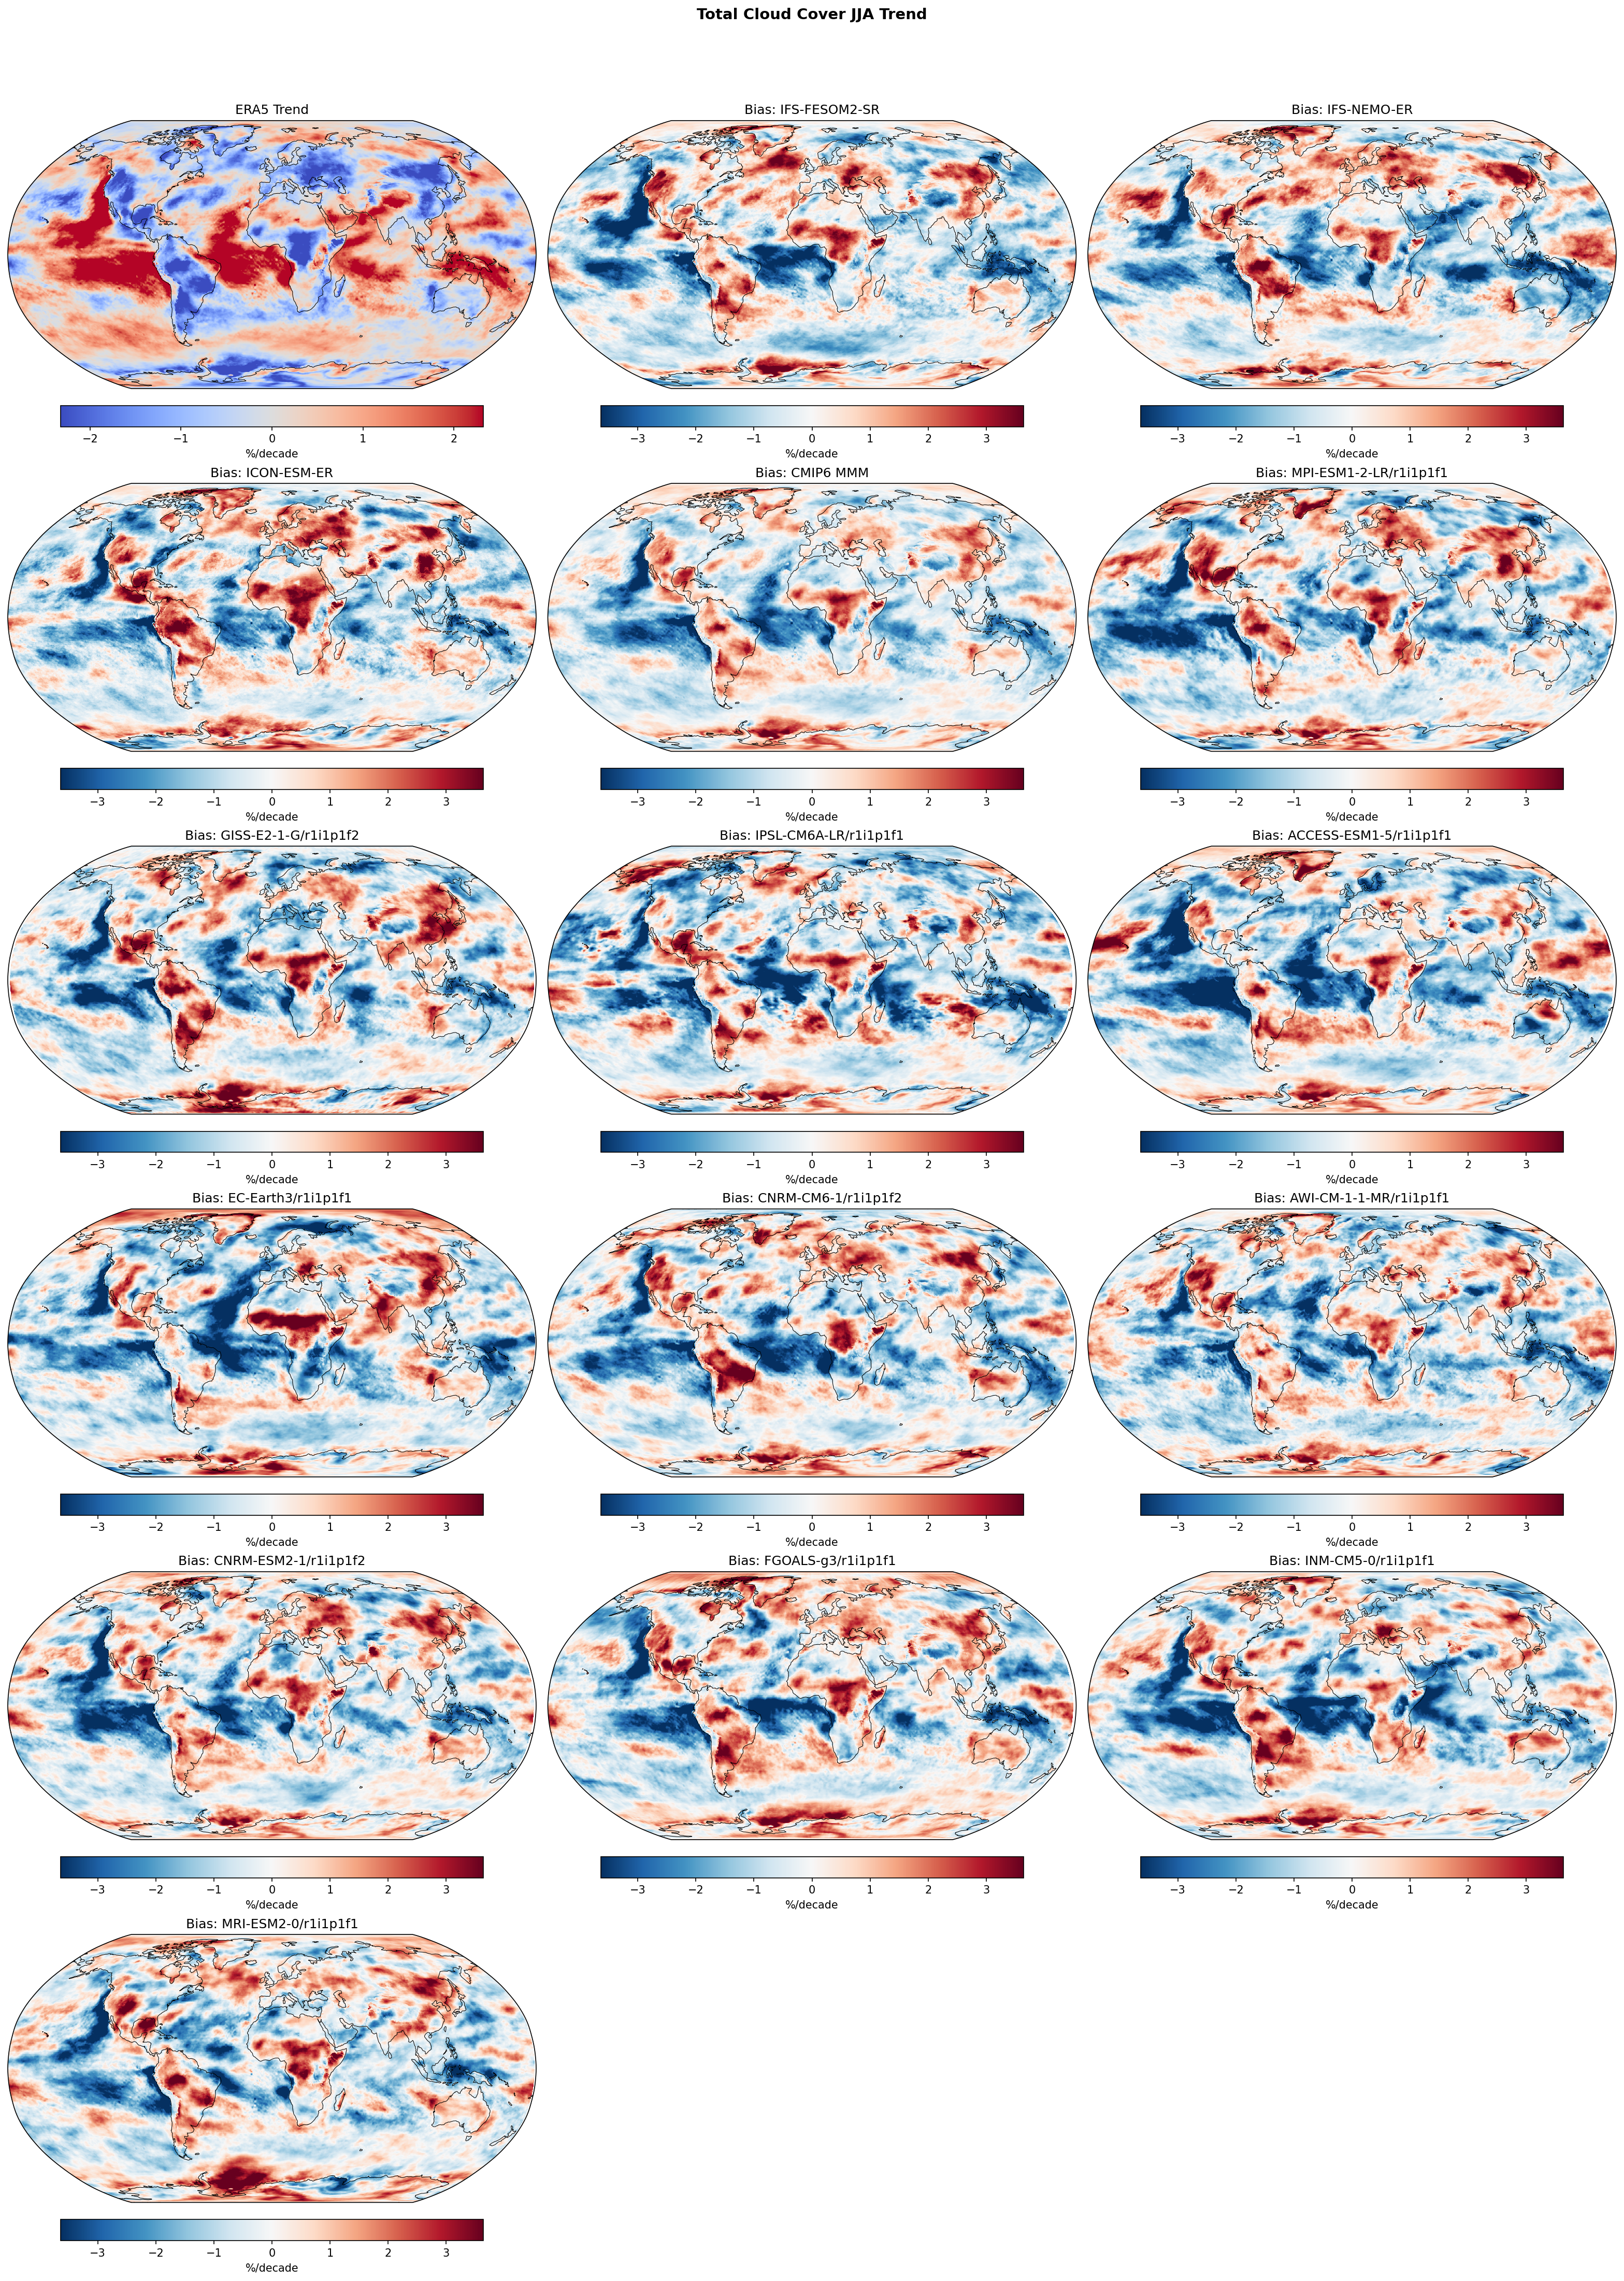
| Variables | clt |
|---|---|
| Models | IFS-FESOM2-SR, IFS-NEMO-ER, ICON-ESM-ER, CMIP6 MMM, MPI-ESM1-2-LR/r1i1p1f1, GISS-E2-1-G/r1i1p1f2, IPSL-CM6A-LR/r1i1p1f1, ACCESS-ESM1-5/r1i1p1f1, EC-Earth3/r1i1p1f1, CNRM-CM6-1/r1i1p1f2, AWI-CM-1-1-MR/r1i1p1f1, CNRM-ESM2-1/r1i1p1f2, FGOALS-g3/r1i1p1f1, INM-CM5-0/r1i1p1f1, MRI-ESM2-0/r1i1p1f1 |
| Reference Dataset | ERA5 |
| Units | %/decade |
| Period | 1980–2014 |
| CMIP6 MMM | Global Mean Trend Diff: -0.33 · Trend Rmse: None |
| MPI-ESM1-2-LR/r1i1p1f1 | Global Mean Trend Diff: -0.32 · Trend Rmse: None |
| GISS-E2-1-G/r1i1p1f2 | Global Mean Trend Diff: -0.25 · Trend Rmse: None |
| IPSL-CM6A-LR/r1i1p1f1 | Global Mean Trend Diff: -0.43 · Trend Rmse: None |
| ACCESS-ESM1-5/r1i1p1f1 | Global Mean Trend Diff: -0.51 · Trend Rmse: None |
| EC-Earth3/r1i1p1f1 | Global Mean Trend Diff: -0.46 · Trend Rmse: None |
| CNRM-CM6-1/r1i1p1f2 | Global Mean Trend Diff: -0.30 · Trend Rmse: None |
| AWI-CM-1-1-MR/r1i1p1f1 | Global Mean Trend Diff: -0.34 · Trend Rmse: None |
| CNRM-ESM2-1/r1i1p1f2 | Global Mean Trend Diff: -0.28 · Trend Rmse: None |
| FGOALS-g3/r1i1p1f1 | Global Mean Trend Diff: -0.18 · Trend Rmse: None |
| INM-CM5-0/r1i1p1f1 | Global Mean Trend Diff: -0.36 · Trend Rmse: None |
| MRI-ESM2-0/r1i1p1f1 | Global Mean Trend Diff: -0.19 · Trend Rmse: None |
Summary high
This figure evaluates linear trends in JJA Total Cloud Cover (1980–2014) comparing ERA5 observations against high-resolution EERIE models (IFS, ICON) and a CMIP6 ensemble. It highlights systematic discrepancies where models fail to reproduce observed decadal trend patterns, particularly over the oceans.
Key Findings
- Systematic failure to capture North Atlantic trends: ERA5 shows a strong increase in cloud cover (red trend), while almost all models show a strong negative bias (blue difference), indicating they simulate either no trend or a decrease.
- Exaggerated clearing in the Eastern Pacific: Models exhibit a widespread negative trend bias in the eastern Pacific stratocumulus regions, suggesting they simulate a stronger reduction in cloud cover than the moderate decrease seen in ERA5.
- Resolution independence of errors: The high-resolution IFS-FESOM2-SR, IFS-NEMO-ER, and ICON-ESM-ER simulations display spatial bias patterns that are strikingly similar to the standard-resolution CMIP6 Multi-Model Mean (MMM), implying that resolution alone does not correct these decadal trend biases.
- Continental discrepancies: Over the Amazon and parts of South America, models generally show a positive trend bias (red), contradicting the drying/clearing trend (blue) observed in ERA5.
Spatial Patterns
ERA5 exhibits a distinct pattern of increasing cloudiness over the North Atlantic and decreasing cloudiness over the Eastern Pacific and Mediterranean. The model bias maps are dominated by a 'blue' signal in the North Atlantic (underestimating the increase) and the Eastern Pacific (overestimating the decrease). Over land, particularly South America, models tend to have 'red' biases, indicating they do not capture the observed clearing trends as strongly.
Model Agreement
There is high inter-model agreement regarding the sign and location of the errors. Both the eddy-rich EERIE models and the diverse CMIP6 ensemble share the same systematic biases in the North Atlantic and Pacific, suggesting a common deficiency in response to forcing or internal variability phasing.
Physical Interpretation
The North Atlantic bias is likely linked to the 'warming hole' phenomenon; observations show relative SST cooling and increased stability/cloudiness, which coupled climate models historically struggle to reproduce (often showing warming and less cloud). The Eastern Pacific bias suggests an over-sensitivity of marine stratocumulus parameterizations to SST warming or circulation changes in the models. The similarity between high-res and low-res models suggests these trends are driven by large-scale dynamical responses or parameterized physics rather than resolved small-scale processes.
Caveats
- Trends are calculated over a 35-year period (1980-2014), which is subject to internal variability; model disagreement may partly arise from differing phases of internal modes (e.g., AMV, IPO) compared to the real world.
- ERA5 cloud cover trends can be influenced by changes in the satellite observing system over the reanalysis period, though the spatial coherence suggests physical signals.
Surface Latent Heat Flux Annual Linear Trend
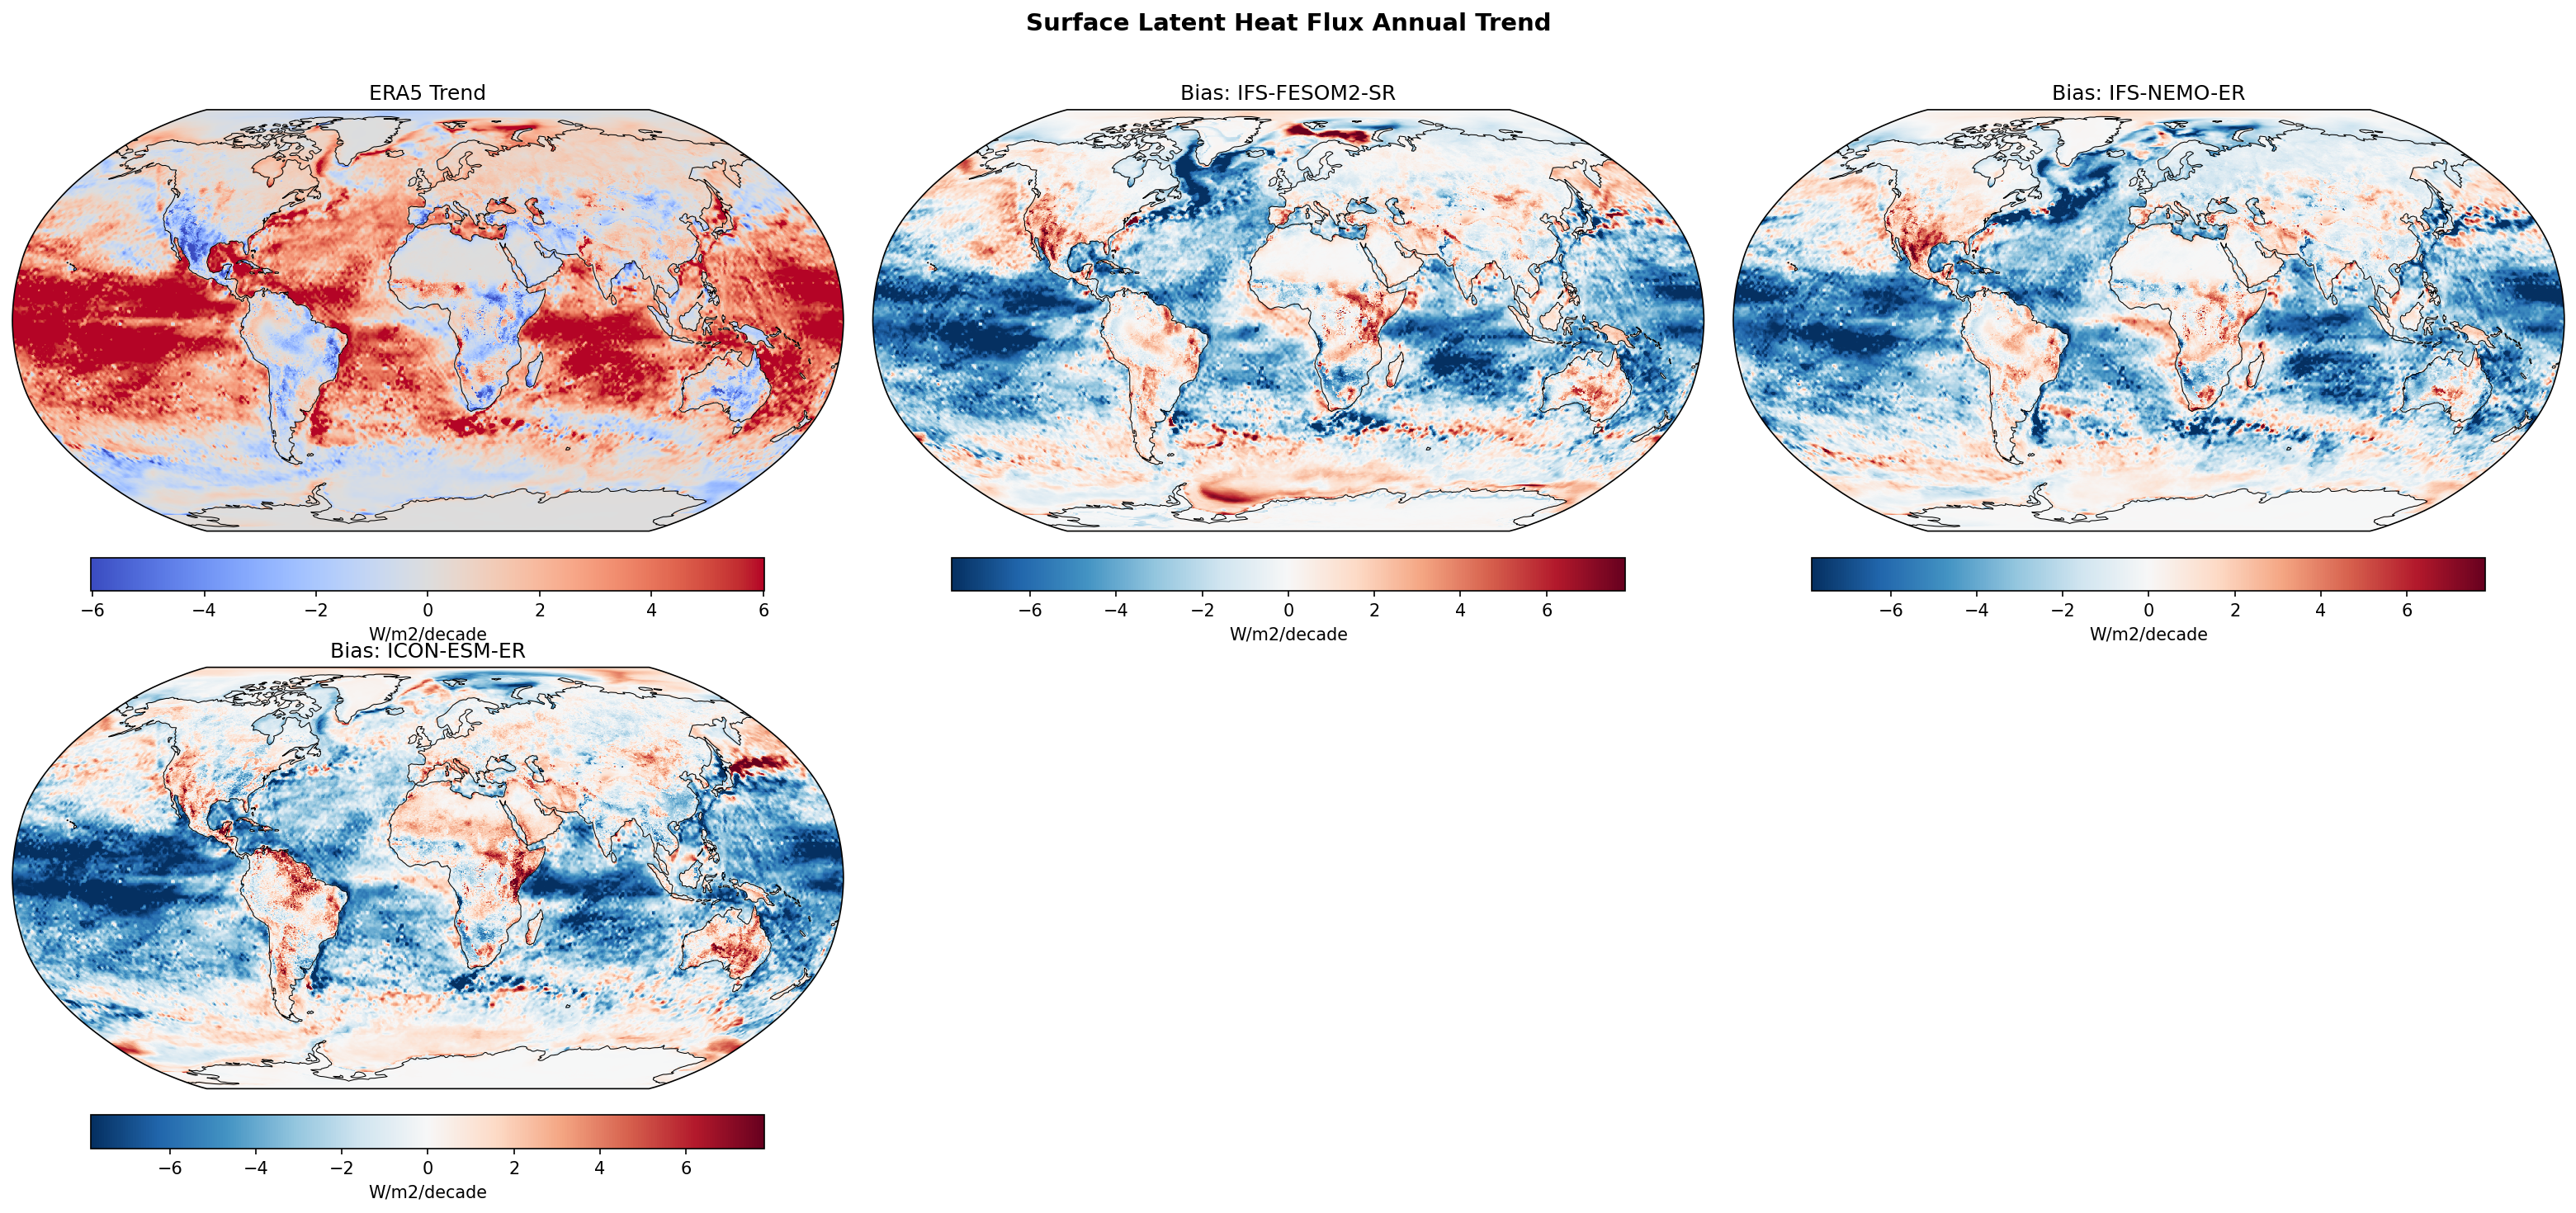
| Variables | hfls |
|---|---|
| Models | IFS-FESOM2-SR, IFS-NEMO-ER, ICON-ESM-ER |
| Reference Dataset | ERA5 |
| Units | W/m2/decade |
| Period | 1980–2014 |
| IFS-FESOM2-SR | Global Mean Trend: 0.41 · Global Mean Trend Diff: -1.53 · Trend Rmse: 3.30 |
| IFS-NEMO-ER | Global Mean Trend: 0.19 · Global Mean Trend Diff: -1.74 · Trend Rmse: 3.28 |
| ICON-ESM-ER | Global Mean Trend: 0.25 · Global Mean Trend Diff: -1.68 · Trend Rmse: 3.44 |
Summary medium
This figure compares annual linear trends in Surface Latent Heat Flux (1980–2014) from ERA5 reanalysis against three high-resolution coupled models. While ERA5 shows strong positive trends (increasing evaporation) across most tropical oceans, all models systematically underestimate these trends, resulting in widespread negative biases.
Key Findings
- ERA5 exhibits robust positive latent heat flux trends (>4 W/m²/decade) across the tropical Pacific, Indian, and Atlantic oceans, consistent with surface warming.
- All three models (IFS-FESOM2-SR, IFS-NEMO-ER, ICON-ESM-ER) strongly underestimate this increase, showing global mean trend differences of -1.5 to -1.7 W/m²/decade relative to ERA5.
- The spatial bias pattern is highly coherent across models, characterized by large negative values (blue) throughout the tropics and subtropics.
- Localized positive biases (model trend > obs trend) appear in the Gulf Stream extension (particularly IFS-NEMO-ER) and parts of the Southern Ocean.
Spatial Patterns
ERA5 shows a dominant 'red' pattern of increasing latent heat flux in the tropics. The model bias maps are inversely 'blue', indicating a failure to capture the magnitude of this increase. Specifically, the tropical Pacific and Indian Oceans show the largest trend deficits. In contrast, the North Atlantic shows complex bias structures with regions of overestimation near western boundary currents in the IFS models.
Model Agreement
There is high inter-model agreement regarding the sign and spatial distribution of the bias. The two IFS-based models (FESOM and NEMO) show very similar patterns, suggesting the atmospheric component or common forcing drives the response. ICON-ESM-ER exhibits a slightly more intense and uniform negative bias in the tropical Pacific.
Physical Interpretation
Latent heat flux is driven by wind speed and the vertical humidity gradient (controlled largely by SST). The models' failure to match the strong positive trend in ERA5 suggests they simulate either weaker surface warming, weaker increases in trade wind strength, or different boundary layer humidity adjustments than the reanalysis. The widespread nature suggests a global thermodynamic constraint or forcing response difference rather than just internal variability mismatch.
Caveats
- ERA5 trends may be influenced by changes in the observing system (e.g., satellite data assimilation) over the 1980–2014 period, potentially exaggerating the 'true' observational trend.
- Free-running coupled models are not phased with historical internal variability (e.g., ENSO, PDO), which significantly influences decadal trends in specific basins.
Surface Latent Heat Flux DJF Linear Trend
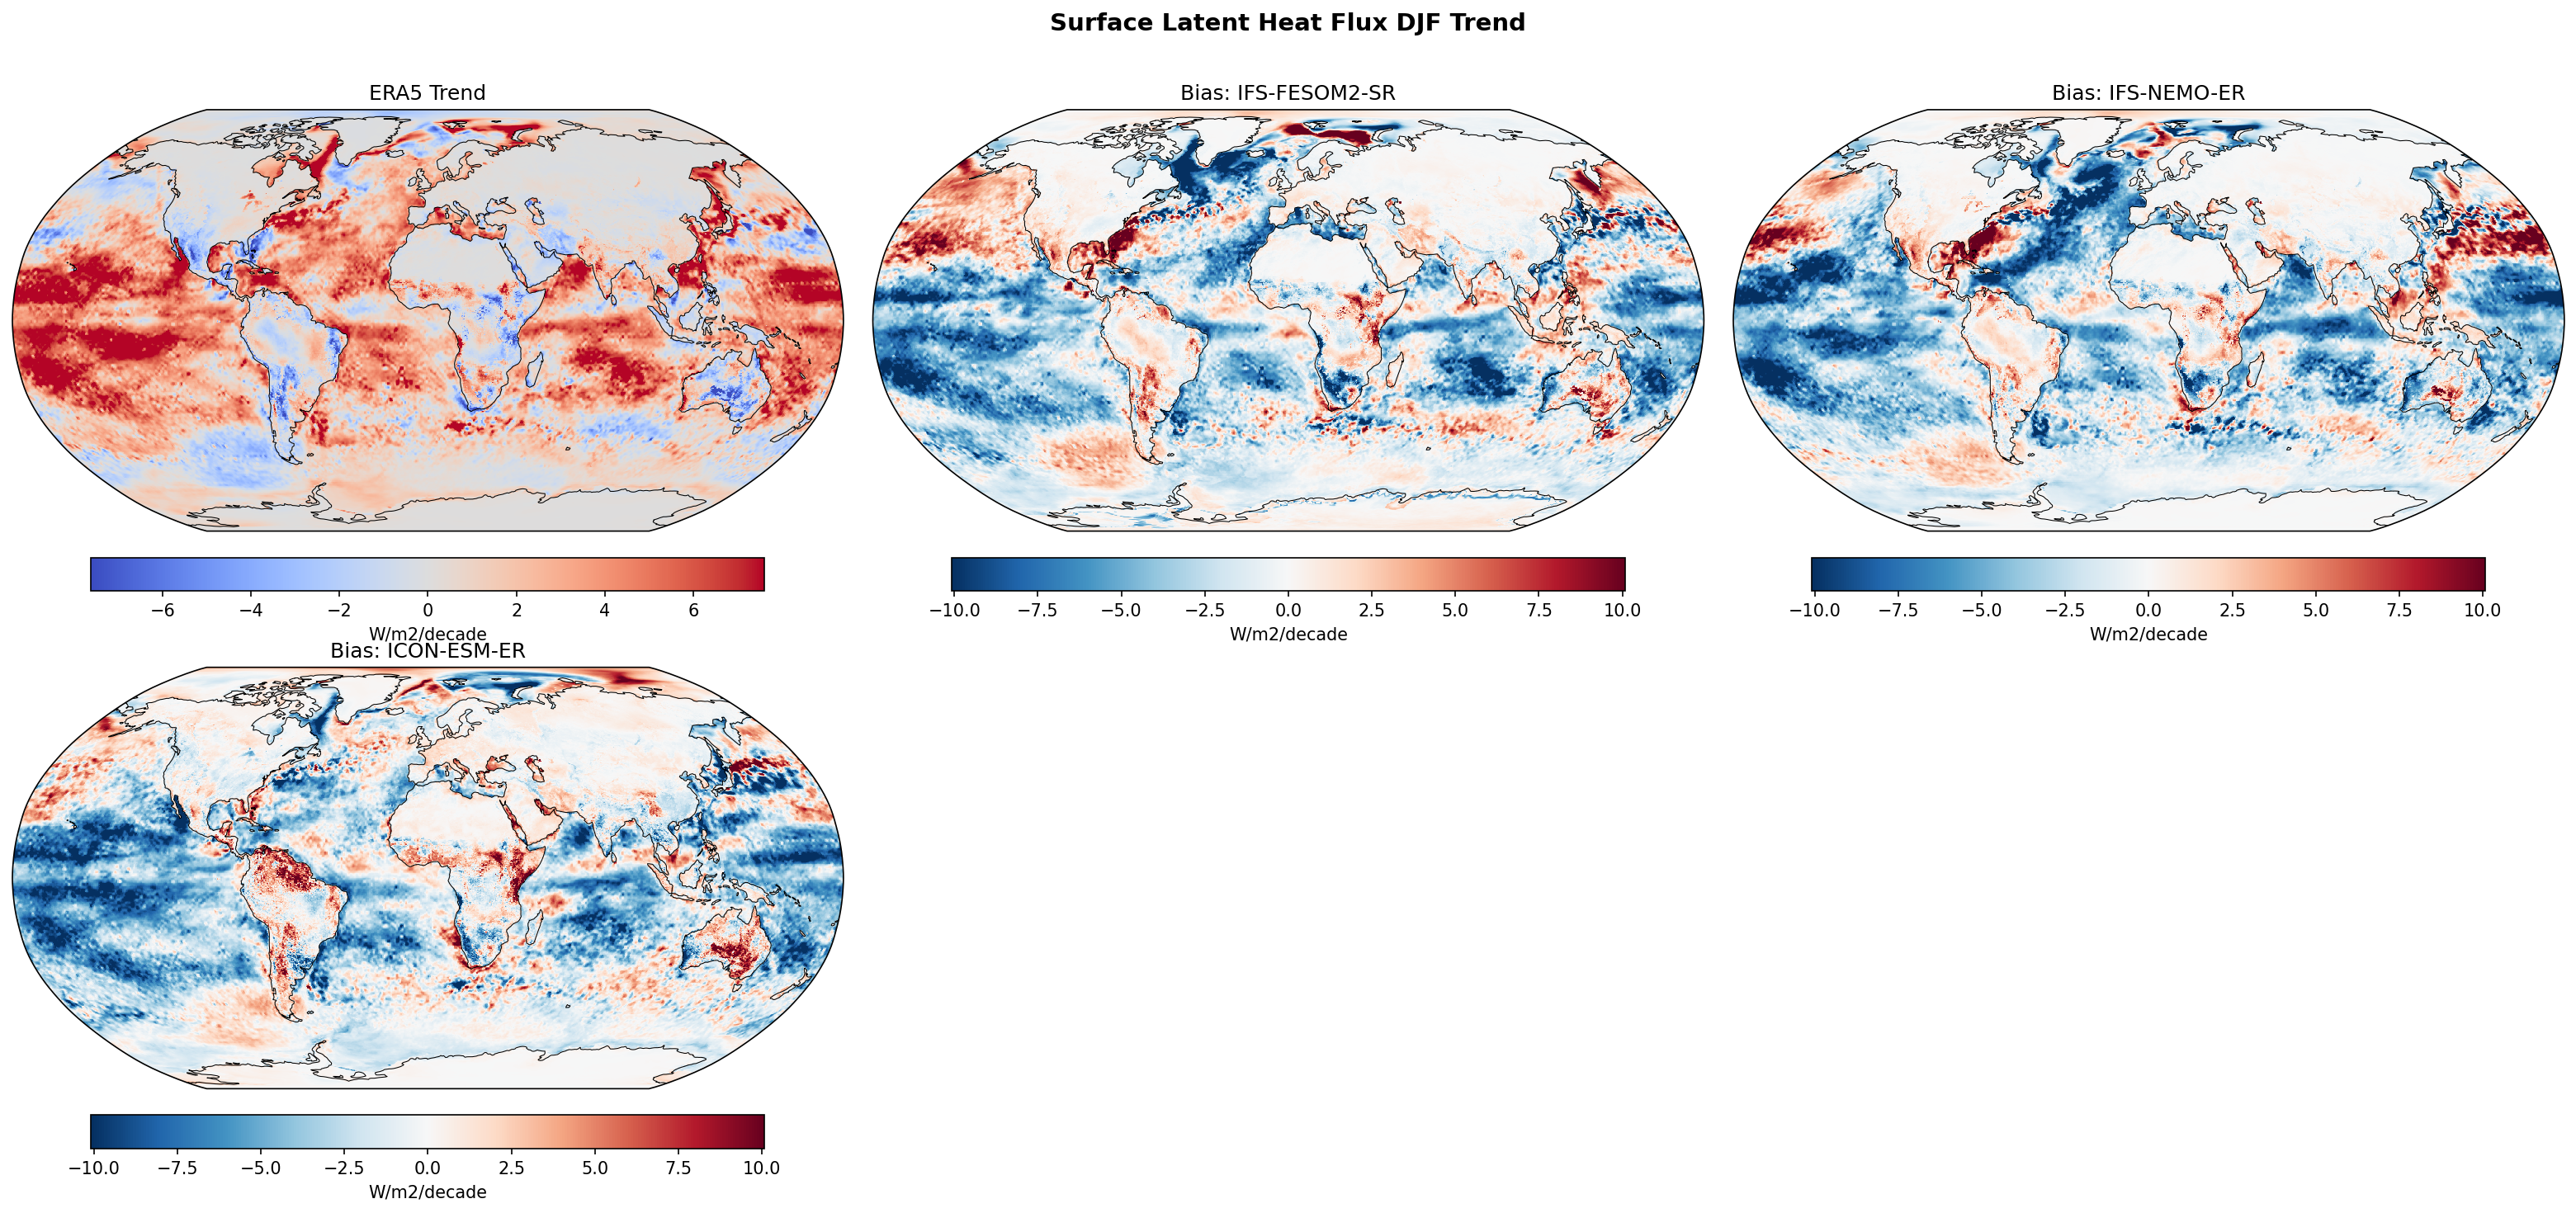
| Variables | hfls |
|---|---|
| Models | IFS-FESOM2-SR, IFS-NEMO-ER, ICON-ESM-ER |
| Reference Dataset | ERA5 |
| Units | W/m2/decade |
| Period | 1980–2014 |
Summary high
This figure evaluates linear trends in Surface Latent Heat Flux (hfls) for the DJF season from 1980–2014, comparing ERA5 reanalysis with three high-resolution coupled models. The models generally underestimate the strong positive trends in evaporation observed in the tropical Indo-Pacific and North Atlantic regions.
Key Findings
- ERA5 shows a strong positive trend (increasing evaporation, >4 W/m²/decade) in the tropical Western Pacific and Indian Ocean, consistent with an intensification of the hydrological cycle and strengthening trade winds (La Niña-like trend) over this period.
- All three models display widespread negative trend biases (blue regions) across the tropical oceans, indicating they simulate a much weaker increase in latent heat flux than observed.
- The IFS-based models (IFS-FESOM2-SR and IFS-NEMO-ER) exhibit nearly identical bias patterns, particularly in the North Atlantic and Tropical Pacific, suggesting the atmospheric component acts as the dominant driver for surface flux trends.
- A distinct positive bias (red) is visible in the eastern tropical Pacific and parts of the subtropical gyres for the IFS models, where models likely simulate warming/evaporation trends that exceed the observations (which show cooling/negative trends in the east).
Spatial Patterns
The observational baseline (ERA5) is characterized by strong LHF increases in the Indo-Pacific Warm Pool and Western Boundary Current regions. The model bias maps are dominated by negative values (blue) in these same regions, meaning the models fail to capture the magnitude of this increase. Conversely, in the Eastern Pacific, ERA5 shows neutral to negative trends (cooling tongue), while models tend to be closer to neutral or positive, resulting in local positive biases.
Model Agreement
There is strong inter-model agreement between the two IFS variants (FESOM2 vs NEMO), indicating that the ocean grid discretization has a secondary effect on these decadal flux trends compared to the atmospheric forcing. ICON-ESM-ER shares the broad tropical underestimation but shows stronger negative biases in the South Atlantic and different patterns in the Southern Ocean.
Physical Interpretation
The primary driver of the model-observation discrepancy is likely the mismatch in multi-decadal internal variability phases. The 1980–2014 period in the real world featured a strengthening of the Pacific Walker Circulation (La Niña-like trend pattern), which enhances evaporation in the Western Pacific. Free-running coupled models do not synchronize with historical internal variability (e.g., IPO/PDO phases) and often simulate a weakening Walker circulation or spatially uniform warming, leading to the observed underestimation of LHF trends in the West Pacific.
Caveats
- The 35-year analysis period (1980-2014) is short enough to be dominated by internal decadal variability (e.g., IPO). 'Biases' here likely reflect phase mismatch between the single observed realization and the models' random internal phasing, rather than purely structural physics errors.
- Sign convention: Standard CMIP `hfls` is positive upwards (flux to atmosphere). A positive trend implies increasing evaporation.
Surface Latent Heat Flux JJA Linear Trend
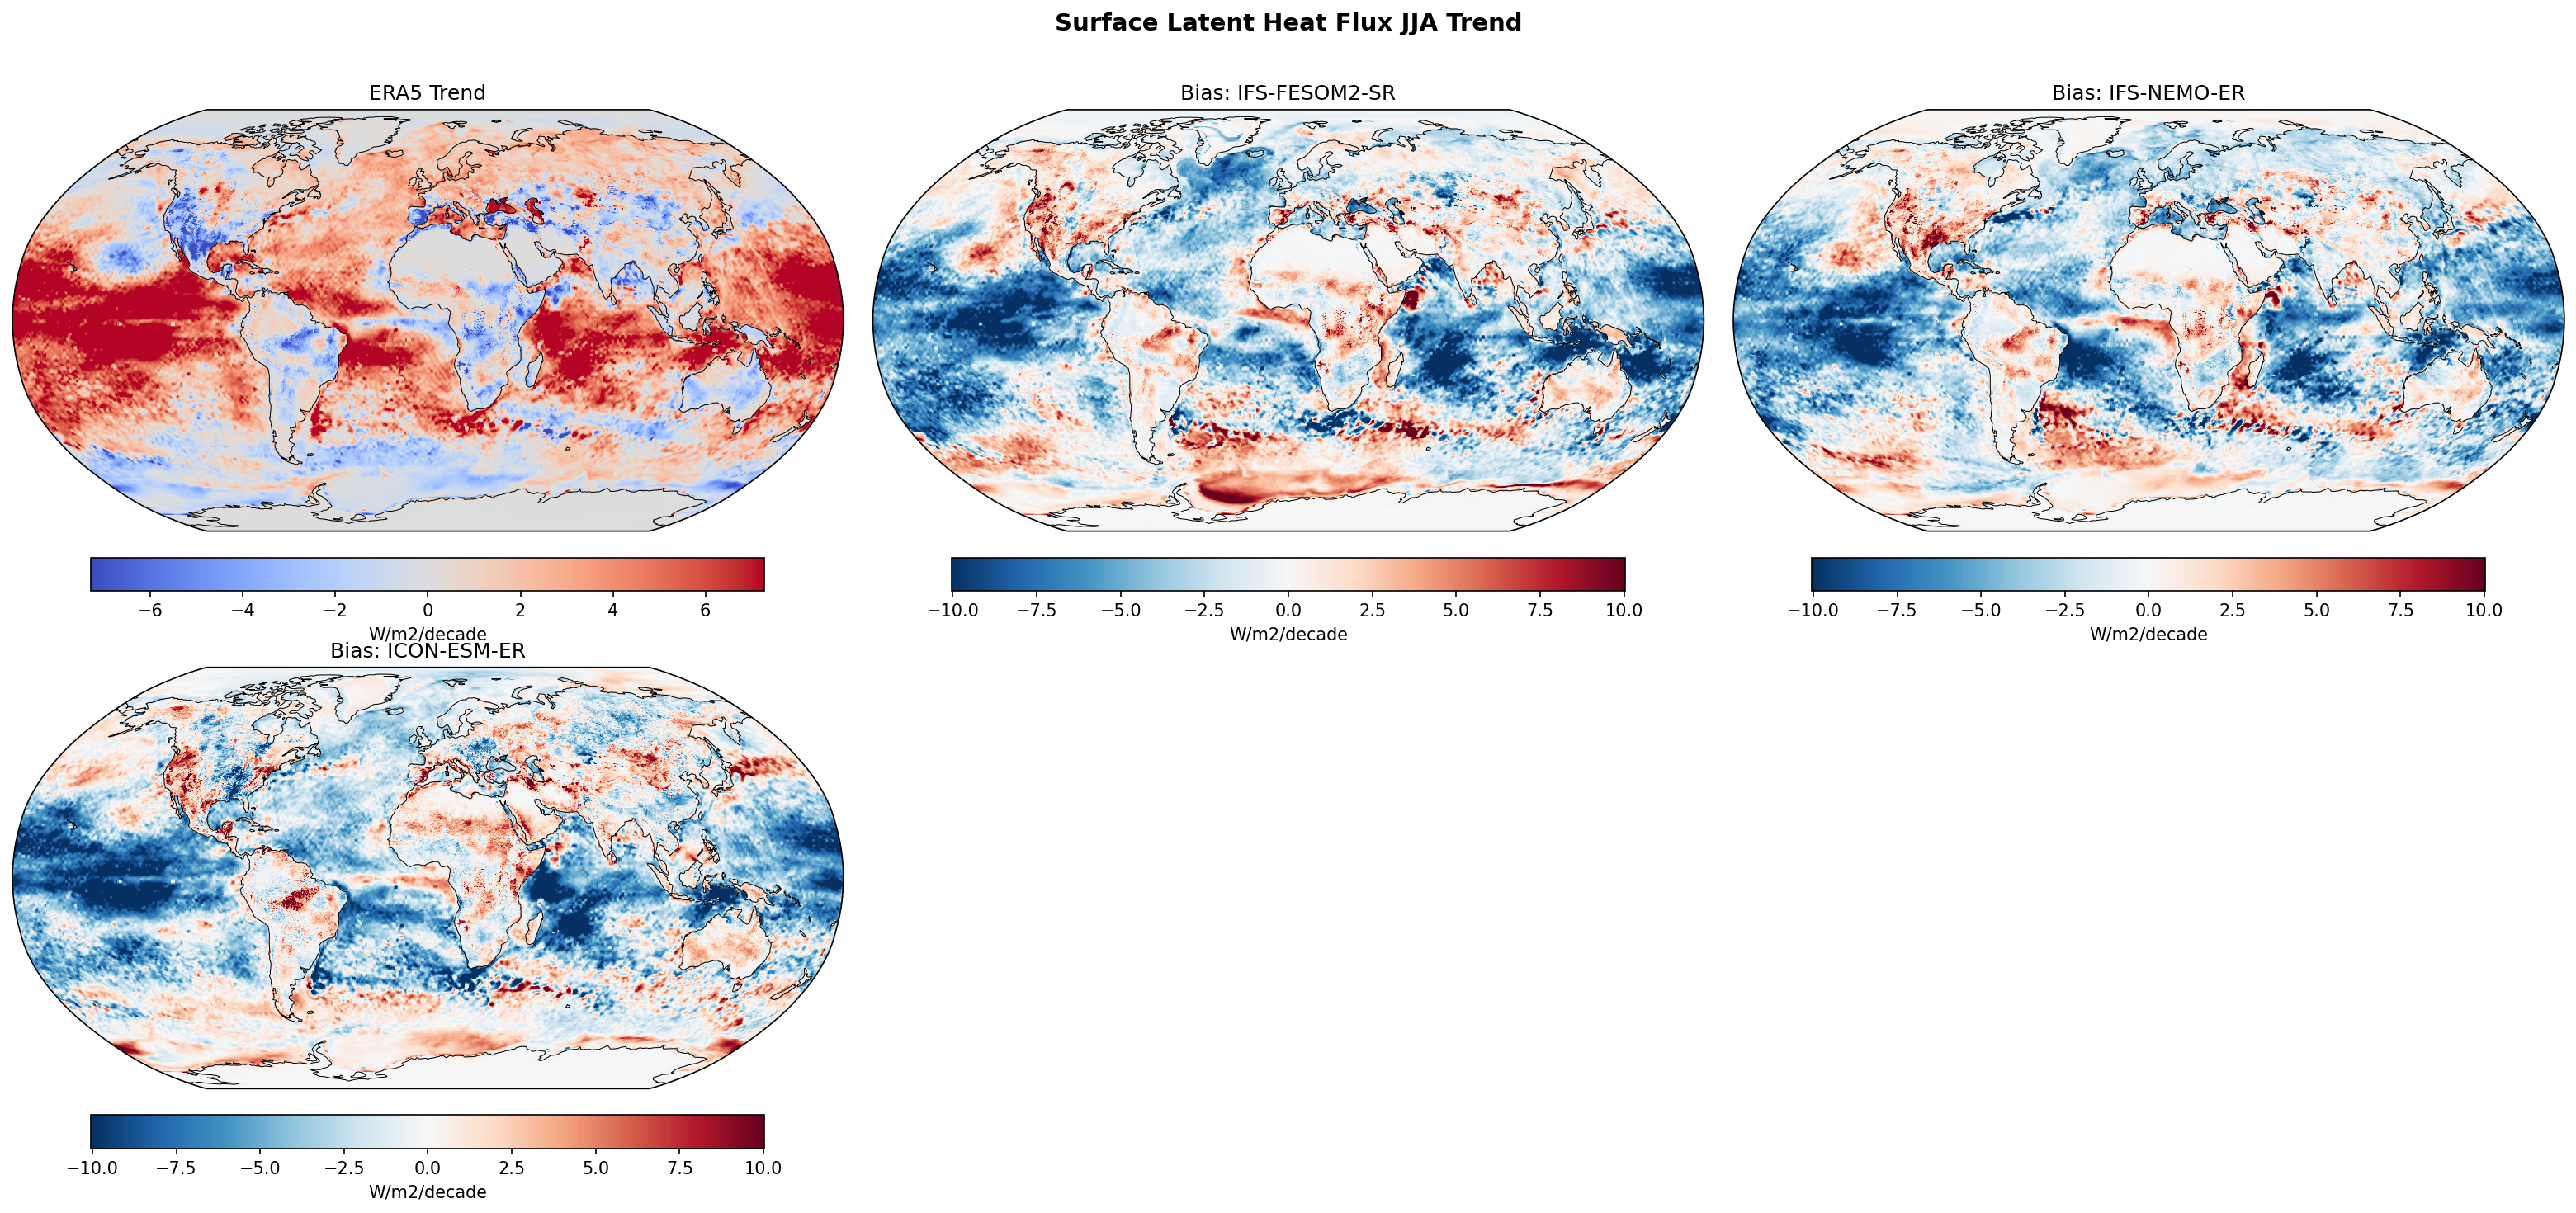
| Variables | hfls |
|---|---|
| Models | IFS-FESOM2-SR, IFS-NEMO-ER, ICON-ESM-ER |
| Reference Dataset | ERA5 |
| Units | W/m2/decade |
| Period | 1980–2014 |
Summary high
This diagnostic evaluates linear trends in JJA Surface Latent Heat Flux (1980–2014) for three high-resolution coupled models against ERA5 reanalysis. While ERA5 shows widespread increases in oceanic latent heat release, all three models exhibit strong negative trend biases over the tropical oceans and positive trend biases over tropical land.
Key Findings
- ERA5 displays broad positive trends (increased evaporation, red) over the tropical and subtropical oceans, reaching 4–6 W/m²/decade.
- All three models (IFS-FESOM2-SR, IFS-NEMO-ER, ICON-ESM-ER) show strong negative biases (blue) throughout the tropical Pacific, Atlantic, and Indian Oceans, indicating they simulate much weaker or negative trends compared to ERA5.
- Conversely, over tropical land regions like the Amazon and Central Africa, models generally show positive biases (red), implying they simulate a stronger increase in evapotranspiration than the reanalysis.
- Bias magnitudes in the tropics often exceed ±5 W/m²/decade, which is comparable to or larger than the signal seen in the observational baseline.
Spatial Patterns
The dominant pattern is a land-sea contrast in bias: systematic underestimation of latent heat flux trends over the tropical oceans (blue bias) and overestimation over tropical rainforest regions (red bias). In the Northern Hemisphere extratropics, biases are more mixed and regional, with notable negative biases in the western US and parts of the North Atlantic.
Model Agreement
There is striking agreement across all three models regarding the large-scale bias patterns. IFS-FESOM2, IFS-NEMO, and ICON-ESM all exhibit the same tropical ocean underestimation and tropical land overestimation, suggesting this discrepancy is robust across these model formulations and resolutions.
Physical Interpretation
Latent heat flux is driven by surface wind speed and the specific humidity gradient (SST vs. air temperature). The widespread negative oceanic bias suggests the models may have weaker trends in surface winds or slower SST warming rates compared to the reanalysis. Alternatively, the positive trend in ERA5 might be driven by changes in the observing system (e.g., satellite era transitions) that the free-running models do not replicate. The positive land bias suggests the models are simulating a more intense acceleration of the hydrological cycle (drying/evaporating) over land than ERA5 captures.
Caveats
- ERA5 surface fluxes are derived products, not direct observations, and their decadal trends can be influenced by inhomogeneities in the assimilated observing system.
- The analysis period (1980–2014) is relatively short, meaning trends are strongly influenced by internal variability (e.g., ENSO phases) which free-running models are not expected to synchronize with observations.
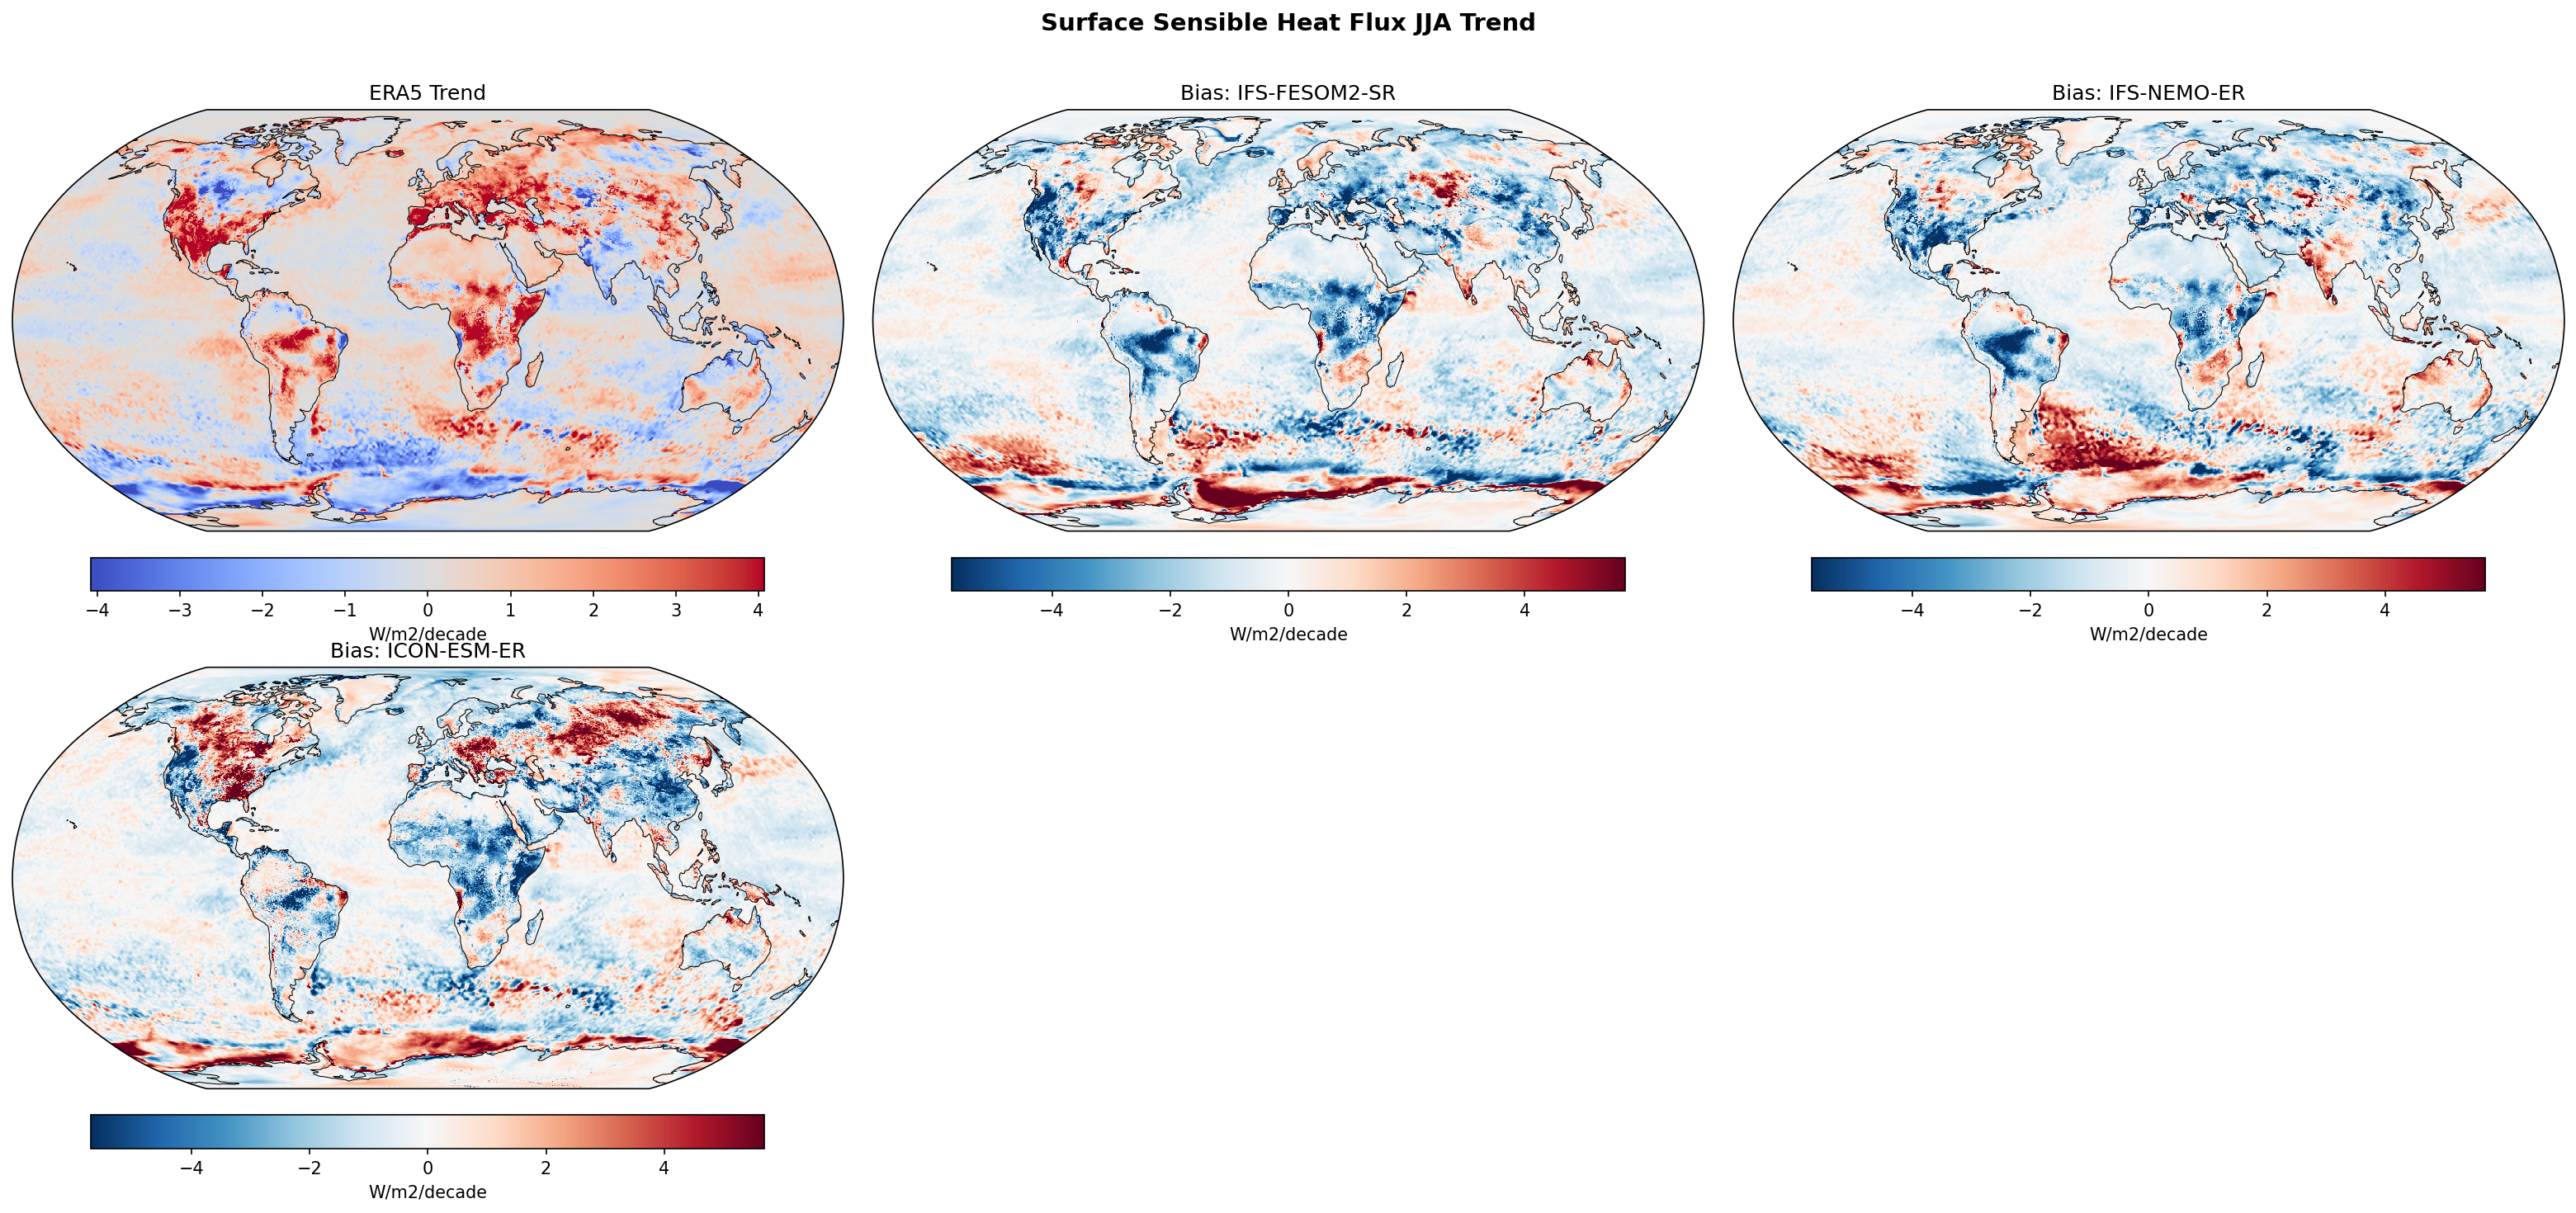
Surface Sensible Heat Flux Annual Linear Trend
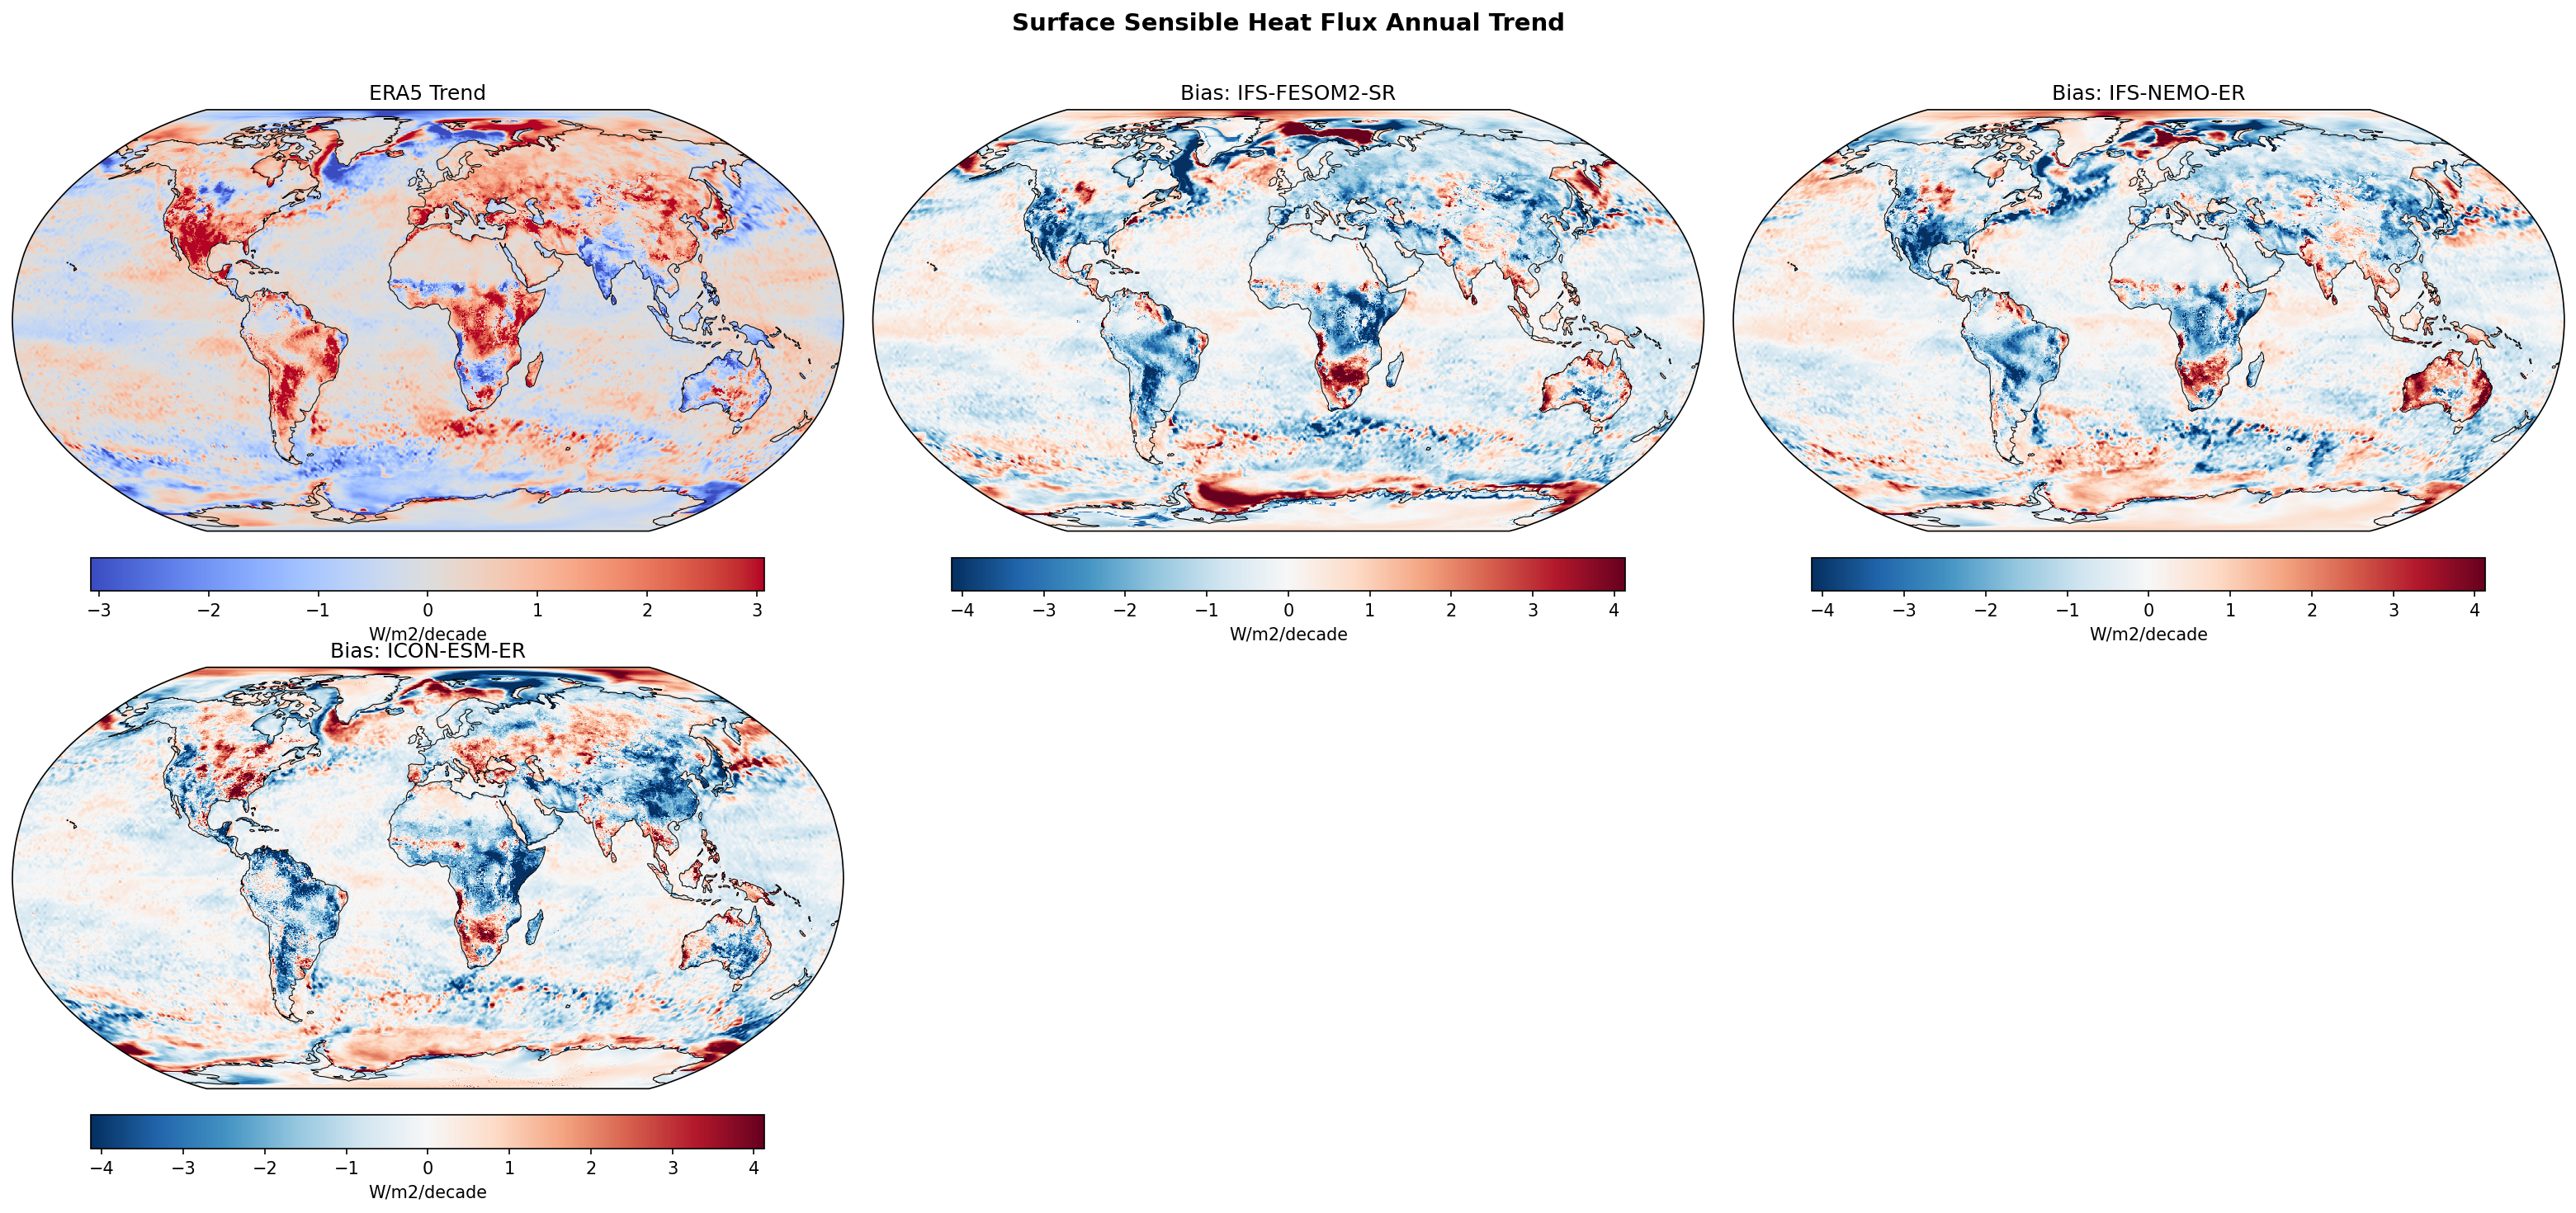
| Variables | hfss |
|---|---|
| Models | IFS-FESOM2-SR, IFS-NEMO-ER, ICON-ESM-ER |
| Reference Dataset | ERA5 |
| Units | W/m2/decade |
| Period | 1980–2014 |
| IFS-FESOM2-SR | Global Mean Trend: -0.14 · Global Mean Trend Diff: -0.34 · Trend Rmse: 1.39 |
| IFS-NEMO-ER | Global Mean Trend: -0.08 · Global Mean Trend Diff: -0.28 · Trend Rmse: 1.20 |
| ICON-ESM-ER | Global Mean Trend: -0.10 · Global Mean Trend Diff: -0.29 · Trend Rmse: 1.32 |
Summary high
The models fail to capture the observed positive global trend in surface sensible heat flux (hfss) seen in ERA5 (approx. +0.2 W/m²/decade), instead simulating a global decrease (approx. -0.1 W/m²/decade). This results in widespread negative trend biases, most notably in the North Atlantic and over major continental landmasses.
Key Findings
- Opposite Global Trends: While ERA5 shows an increasing trend in upward sensible heat flux, all three models simulate a decreasing trend, leading to a consistent negative global bias (~-0.3 W/m²/decade difference).
- North Atlantic Bias: All models exhibit a strong negative trend bias in the North Atlantic subpolar gyre and Gulf Stream extension, indicating they fail to reproduce the observed intensification of heat release (likely linked to SST trend discrepancies).
- Continental Discrepancies: Significant negative trend biases are observed over South America (Amazon) and Southern/Central Africa, suggesting models do not capture the observed increase in sensible heat flux, possibly due to differences in surface warming rates or soil moisture/Bowen ratio trends.
Spatial Patterns
The most prominent feature is the negative bias (blue) over the North Atlantic and parts of the Southern Ocean. Over land, strong negative biases appear over the Amazon and Southern Africa. Conversely, weak positive biases (red) are visible in the Eastern Tropical Pacific and parts of the Arctic, likely reflecting the models' failure to capture the observed cooling trend in the Pacific ('pattern effect') and potentially excessive warming/fluxes in the Arctic.
Model Agreement
There is high inter-model agreement in the spatial structure of biases, particularly the North Atlantic deficit and land biases in the Southern Hemisphere. IFS-NEMO-ER performs slightly better statistically (lowest RMSE of ~1.20 W/m²/decade) compared to IFS-FESOM2-SR and ICON-ESM-ER, but the overarching patterns are shared.
Physical Interpretation
Sensible heat flux trends are driven by changes in the air-sea (or air-land) temperature gradient and wind speed. The negative biases in the North Atlantic suggest the models are either not warming the SSTs as fast as observed or not capturing increased storminess/winds that drive flux. Over land (e.g., Amazon), ERA5 likely shows a drying/warming trend leading to increased sensible heat (higher Bowen ratio), whereas models may be retaining more moisture or warming less, favoring latent over sensible heat flux. The discrepancy in the Pacific (models > obs) aligns with the known difficulty of coupled models to reproduce the historical La Niña-like cooling trend.
Caveats
- ERA5 trends themselves are a reanalysis product and subject to uncertainties in parameterizations, though they are a standard baseline.
- Trend analyses over 1980-2014 are sensitive to internal variability (e.g., PDO, AMO phases) which coupled models are not expected to reproduce in phase, potentially explaining regional ocean mismatches.
Surface Sensible Heat Flux DJF Linear Trend
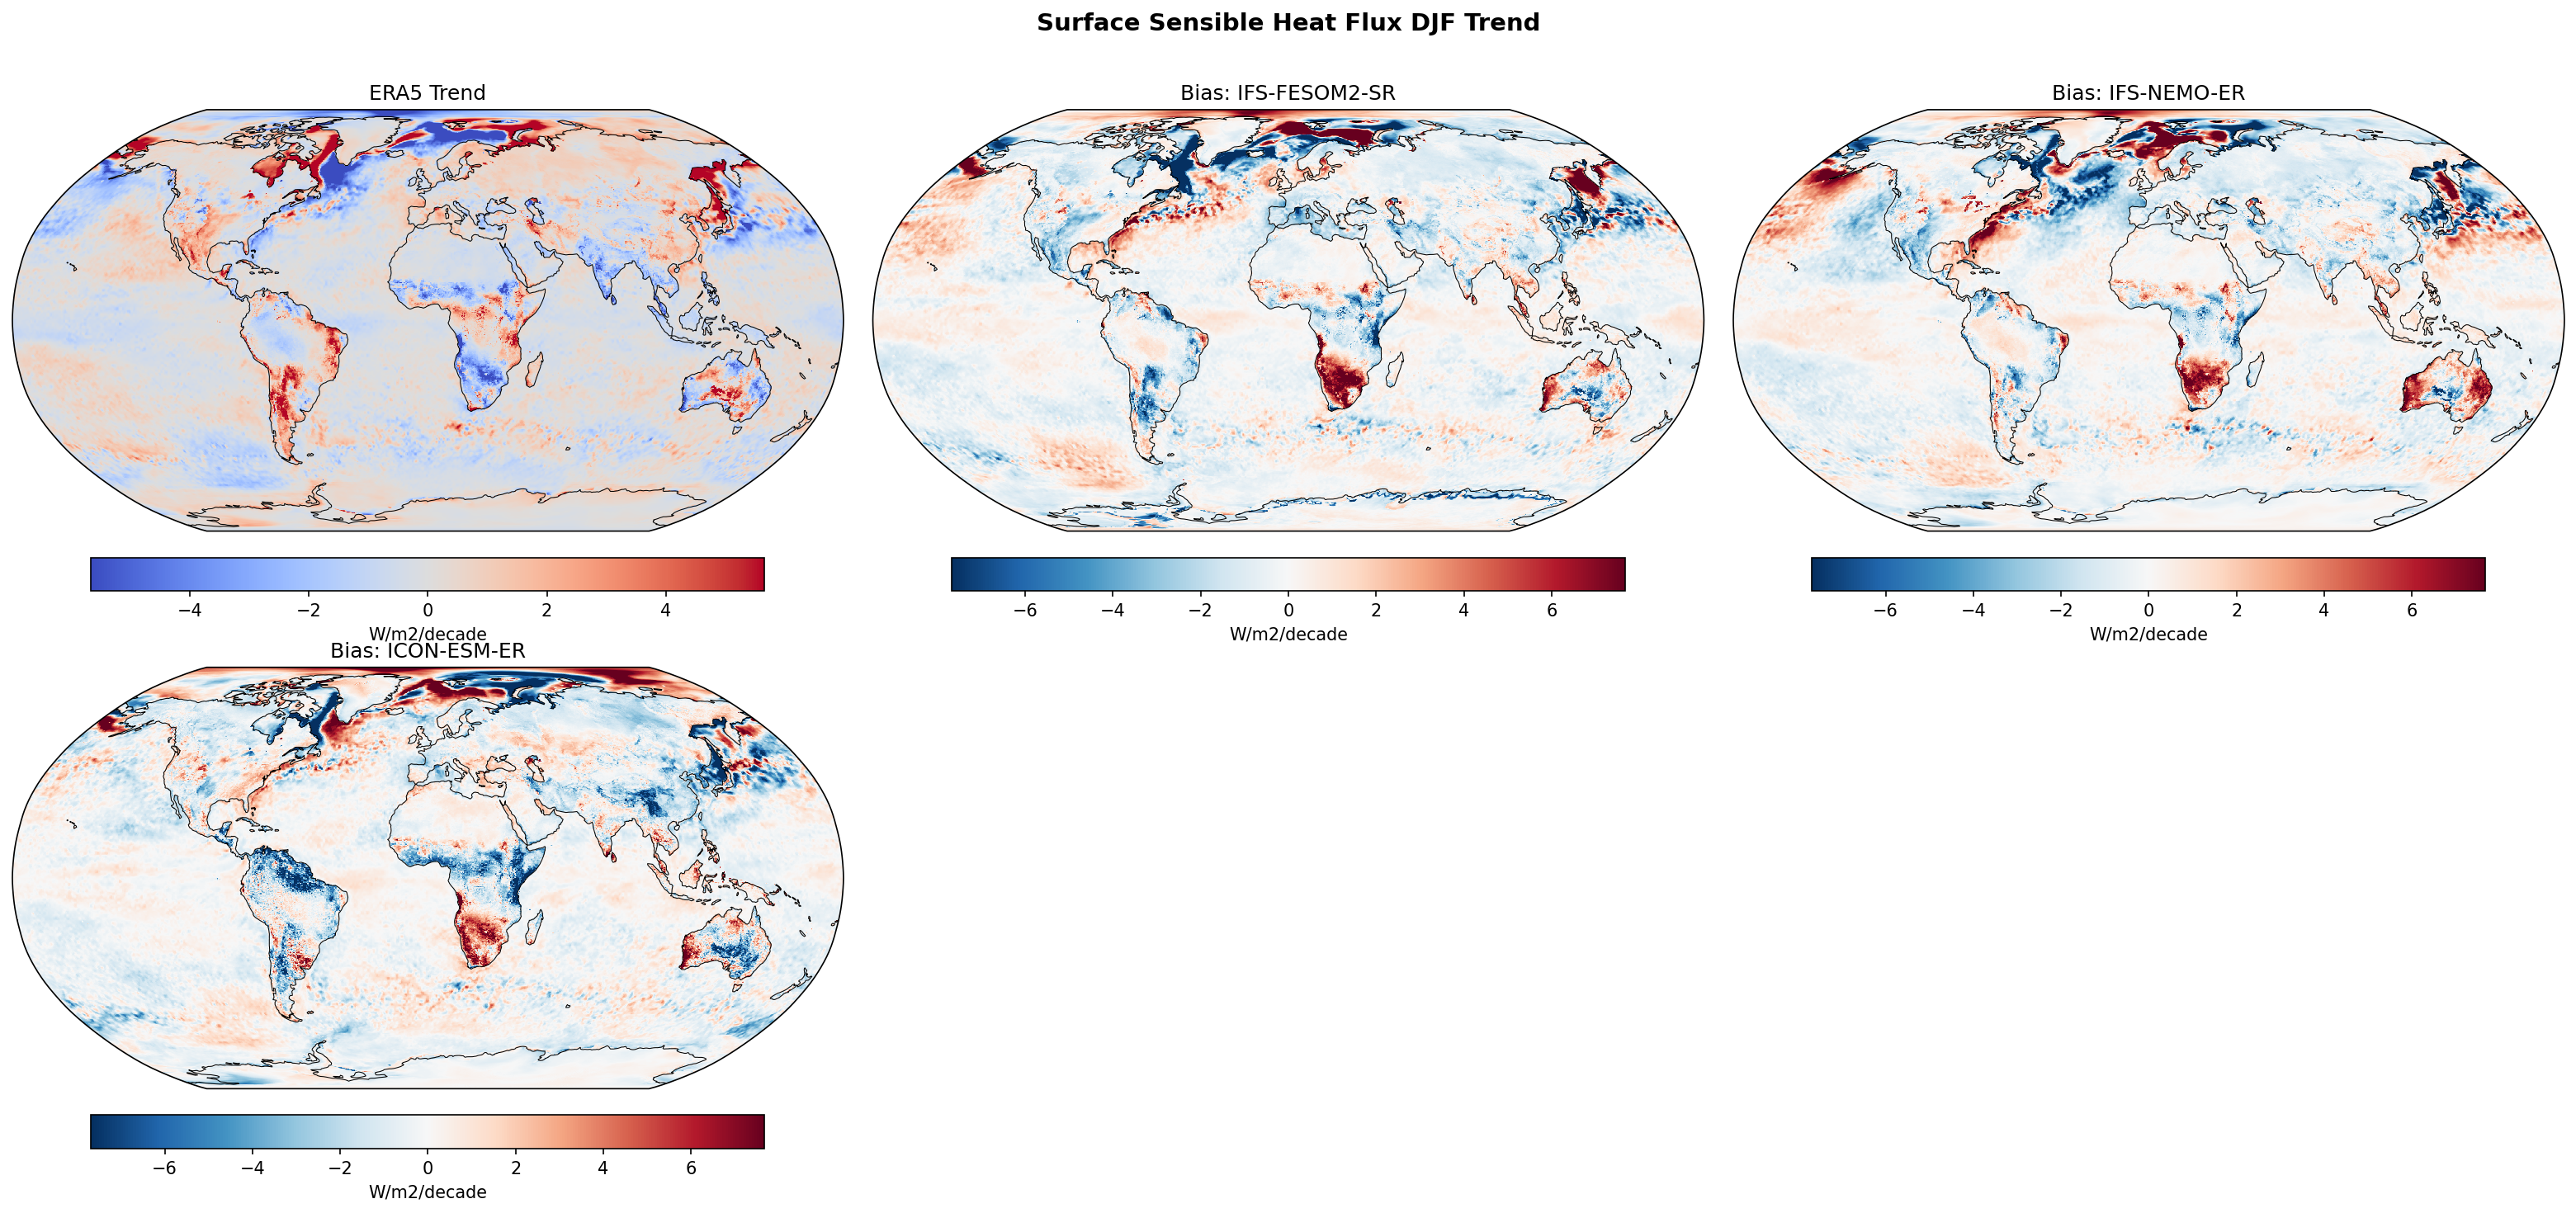
| Variables | hfss |
|---|---|
| Models | IFS-FESOM2-SR, IFS-NEMO-ER, ICON-ESM-ER |
| Reference Dataset | ERA5 |
| Units | W/m2/decade |
| Period | 1980–2014 |
Summary high
This figure evaluates linear trends in winter (DJF) Surface Sensible Heat Flux (SSHF) from 1980-2014, comparing ERA5 reanalysis with three high-resolution coupled models. The analysis reveals that models generally fail to capture the magnitude of observation-derived trends in key regions, particularly the Arctic sea ice margins and the North Atlantic subpolar gyre.
Key Findings
- ERA5 shows strong positive SSHF trends (increased heat loss to atmosphere) along Arctic sea ice edges (Barents/Kara Seas) and negative trends in the North Atlantic subpolar gyre.
- All models exhibit negative trend biases in the Barents/Kara Seas region, indicating an underestimation of the observation-derived increase in heat flux associated with sea ice retreat.
- Positive trend biases dominate the North Atlantic subpolar gyre in all models, suggesting they do not reproduce the observed reduction in sensible heat flux in this region.
- A stark contrast exists over Southern Africa: IFS-based models (FESOM/NEMO) show positive trend biases, while ICON-ESM-ER shows strong negative biases.
Spatial Patterns
In observations (ERA5), the most prominent features are the 'warming hole' signature in the North Atlantic (blue/negative trend) and the sea-ice retreat signature in the Arctic (red/positive trend). The bias maps show that models consistently oppose these observed trends: they have positive biases (red) where observations cool/reduce flux in the North Atlantic, and negative biases (blue) where observations warm/increase flux at the ice edge.
Model Agreement
There is high agreement between IFS-FESOM2-SR and IFS-NEMO-ER regarding biases over land (e.g., Africa, South America) and the North Atlantic, reflecting their shared atmospheric component. ICON-ESM-ER diverges significantly over tropical land masses (opposite sign bias over Africa) and shows a more intense negative bias in the Barents Sea, but agrees with the IFS models on the broad North Atlantic mismatch.
Physical Interpretation
The positive trend in ERA5 at high latitudes is driven by sea ice loss exposing warmer ocean surfaces to cold winter air; the models' negative bias suggests they underestimate the rate of sea ice decline or the associated flux response. In the North Atlantic, the observed negative trend likely relates to the 'warming hole' or AMOC variability/slowdown; the positive bias indicates the free-running models do not replicate this specific multidecadal cooling/flux reduction phase. The divergence over Africa likely stems from differences in land-surface parameterizations (soil moisture/bowen ratio changes) between the IFS and ICON atmospheric models.
Caveats
- The analysis period (1980-2014) is relatively short, meaning internal variability (e.g., NAO, AMOC phases) significantly influences trends; model-observation mismatch may result from unforced internal variability phasing rather than structural error.
- Sign convention assumes positive upwards (ocean to atmosphere); ERA5 negative trend implies reduced heat loss.
Surface Sensible Heat Flux JJA Linear Trend
| Variables | hfss |
|---|---|
| Models | IFS-FESOM2-SR, IFS-NEMO-ER, ICON-ESM-ER |
| Reference Dataset | ERA5 |
| Units | W/m2/decade |
| Period | 1980–2014 |
Summary high
This diagnostic evaluates linear trends in June-August (JJA) surface sensible heat flux over the period 1980–2014, comparing ERA5 reanalysis against three high-resolution coupled models. While ERA5 shows strong positive trends over major land masses (indicating warming/drying), the IFS-based models systematically underestimate these trends, whereas ICON-ESM-ER shows regional overestimations in high latitudes.
Key Findings
- ERA5 displays widespread positive sensible heat flux trends (>2–4 W/m²/decade) over Europe, North America, and the Amazon, reflecting surface warming and likely soil moisture feedbacks.
- Both IFS-FESOM2-SR and IFS-NEMO-ER exhibit extensive negative trend biases (blue) over these land regions, indicating they simulate a much weaker increase in sensible heat flux than observed.
- ICON-ESM-ER presents a distinct error pattern with positive trend biases (overestimation) over Northern Eurasia and Western North America, but strong negative biases over Central Africa.
- Large discrepancies exist in the Southern Ocean, particularly in IFS-NEMO-ER which shows strong dipolar trend biases likely associated with sea ice variability.
Spatial Patterns
The observational reference (ERA5) is dominated by land-based positive trends in the Northern Hemisphere and Tropics. The IFS models' bias maps are inversely correlated with this, showing blue (negative bias) where ERA5 is red. ICON breaks this pattern with red biases in boreal regions (Russia/Canada) and blue biases in the tropics (Africa/Amazon).
Model Agreement
The two IFS models show high agreement over land, suggesting the bias stems from the shared atmospheric component (IFS) or land surface scheme rather than the ocean model. ICON disagrees with the IFS class, suggesting different sensitivity in its land-surface coupling or warming rate.
Physical Interpretation
Increasing sensible heat flux in observations is physically consistent with land surface warming and potential drying (shifting energy from latent to sensible heat). The negative bias in IFS models suggests they may be retaining too much soil moisture or warming less at the surface, thereby suppressing the sensible heat response. ICON's positive bias in Eurasia implies excessive surface warming or drying. Southern Ocean biases are driven by differences in sea ice trends and SST evolution, regulating the strong air-sea fluxes in that region.
Caveats
- The 35-year trend period is influenced by internal decadal variability (e.g., AMO, IPO) and may not purely reflect forced climate change.
- Biases in the Southern Ocean are large and noisy, making it difficult to separate trend errors from variability mismatch.
Total Precipitation Rate Annual Linear Trend
| Variables | pr |
|---|---|
| Models | IFS-FESOM2-SR, IFS-NEMO-ER, ICON-ESM-ER, CMIP6 MMM, MPI-ESM1-2-LR/r1i1p1f1, GISS-E2-1-G/r1i1p1f2, IPSL-CM6A-LR/r1i1p1f1, ACCESS-ESM1-5/r1i1p1f1, EC-Earth3/r1i1p1f1, CNRM-CM6-1/r1i1p1f2, AWI-CM-1-1-MR/r1i1p1f1, CNRM-ESM2-1/r1i1p1f2, FGOALS-g3/r1i1p1f1, INM-CM5-0/r1i1p1f1, MRI-ESM2-0/r1i1p1f1 |
| Reference Dataset | ERA5 |
| Units | kg/m2/s/decade |
| Period | 1980–2014 |
| IFS-FESOM2-SR | Global Mean Trend: 0.00 · Global Mean Trend Diff: -0.00 · Trend Rmse: 0.00 |
| IFS-NEMO-ER | Global Mean Trend: 0.00 · Global Mean Trend Diff: -0.00 · Trend Rmse: 0.00 |
| ICON-ESM-ER | Global Mean Trend: 0.00 · Global Mean Trend Diff: -0.00 · Trend Rmse: 0.00 |
| CMIP6 MMM | Global Mean Trend Diff: -0.00 · Trend Rmse: 0.00 |
| MPI-ESM1-2-LR/r1i1p1f1 | Global Mean Trend Diff: -0.00 · Trend Rmse: 0.00 |
| GISS-E2-1-G/r1i1p1f2 | Global Mean Trend Diff: -0.00 · Trend Rmse: 0.00 |
| IPSL-CM6A-LR/r1i1p1f1 | Global Mean Trend Diff: -0.00 · Trend Rmse: 0.00 |
| ACCESS-ESM1-5/r1i1p1f1 | Global Mean Trend Diff: -0.00 · Trend Rmse: 0.00 |
| EC-Earth3/r1i1p1f1 | Global Mean Trend Diff: -0.00 · Trend Rmse: 0.00 |
| CNRM-CM6-1/r1i1p1f2 | Global Mean Trend Diff: -0.00 · Trend Rmse: 0.00 |
| AWI-CM-1-1-MR/r1i1p1f1 | Global Mean Trend Diff: -0.00 · Trend Rmse: 0.00 |
| CNRM-ESM2-1/r1i1p1f2 | Global Mean Trend Diff: -0.00 · Trend Rmse: 0.00 |
| FGOALS-g3/r1i1p1f1 | Global Mean Trend Diff: -0.00 · Trend Rmse: 0.00 |
| INM-CM5-0/r1i1p1f1 | Global Mean Trend Diff: -0.00 · Trend Rmse: 0.00 |
| MRI-ESM2-0/r1i1p1f1 | Global Mean Trend Diff: -0.00 · Trend Rmse: 0.00 |
Summary high
This diagnostic evaluates annual precipitation rate trends (1980–2014) for EERIE high-resolution models and CMIP6 models against ERA5 reanalysis. The dominant feature is a systematic failure of all models to capture the observed intensification of the hydrological cycle in the tropical Pacific.
Key Findings
- ERA5 displays a strong 'La Niña-like' trend pattern, with intense wetting (red, positive trend) in the Maritime Continent/West Pacific and drying (blue, negative trend) in the Central/East Pacific.
- All evaluated models (IFS-FESOM2-SR, IFS-NEMO-ER, ICON-ESM-ER, and CMIP6) exhibit a striking dipole bias in the tropical Pacific that opposes observations: a dry bias in the West and a wet bias in the East.
- The magnitude of the trend biases (RMSE ~2.4–2.9e-6 kg/m²/s/decade) is comparable to or exceeds the magnitude of the observed trends (~3e-6), indicating little predictive skill for regional decadal precipitation changes in this period.
- High-resolution models (~10 km) show no perceptible improvement over standard resolution CMIP6 models in capturing the spatial pattern of these trends.
Spatial Patterns
The observational trend is characterized by a strengthening of the Pacific Walker circulation (wet West/dry East). The bias maps for all models show the inverse spatial structure (Model minus Obs results in negative/blue in the West and positive/red in the East), implying the models simulate either a neutral or weakening Walker circulation trend (El Niño-like). Similar but less coherent biases are visible in the Indian Ocean, where models generally fail to capture the observed western drying trend.
Model Agreement
There is exceptionally high agreement across all models (inter-model differences are small compared to the model-observation difference). The high-resolution EERIE simulations (IFS, ICON) exhibit the same systematic biases as the CMIP6 Multi-Model Mean and individual CMIP6 members.
Physical Interpretation
The discrepancy highlights a known systematic issue where coupled climate models simulate an 'El Niño-like' warming pattern (weakened gradients) in response to historical forcing, whereas observations for this period show a 'La Niña-like' pattern (strengthened gradients). This may result from missing physical processes, incorrect response to aerosol forcing, or the dominance of internal variability (e.g., IPO phases) that free-running models are not phased to reproduce.
Caveats
- The analysis period (1980–2014) is short and heavily influenced by internal decadal variability (PDO/IPO); uninitialized models are not expected to match the specific phase of natural variability.
- ERA5 is a reanalysis product; while it generally captures broad dynamical shifts, trend magnitudes over the tropical oceans are subject to uncertainties in the assimilation system.
Total Precipitation Rate DJF Linear Trend
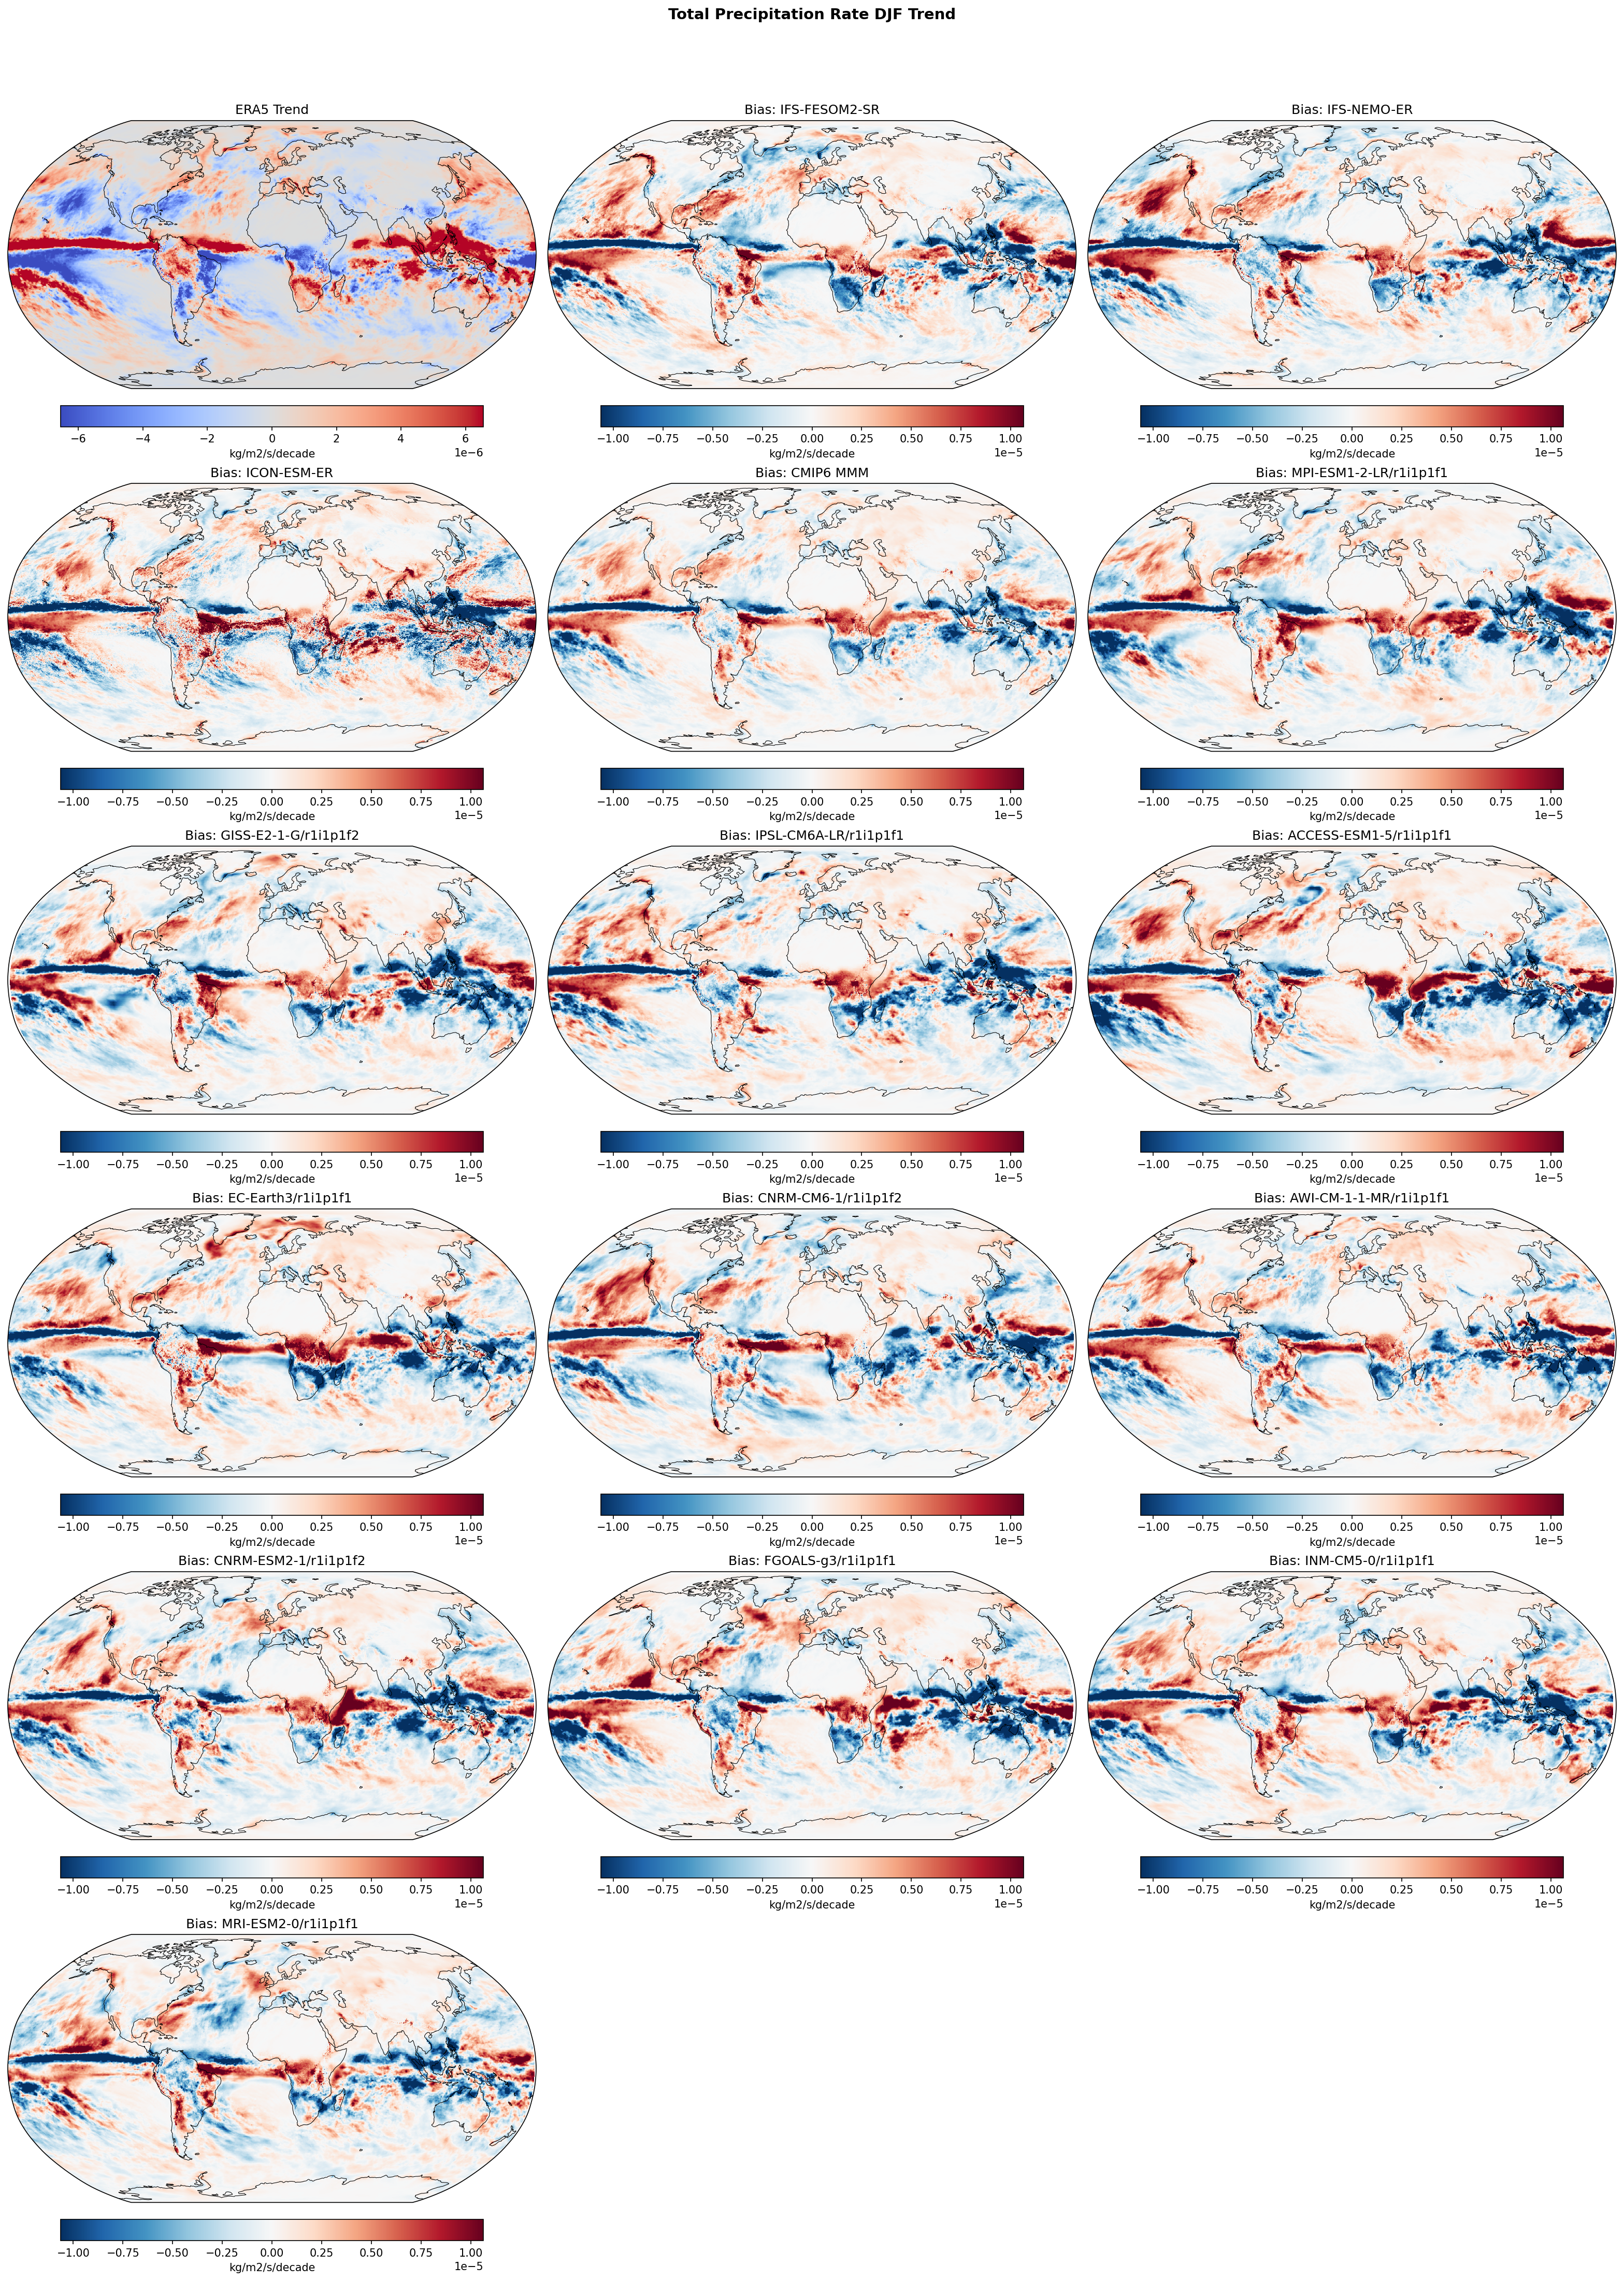
| Variables | pr |
|---|---|
| Models | IFS-FESOM2-SR, IFS-NEMO-ER, ICON-ESM-ER, CMIP6 MMM, MPI-ESM1-2-LR/r1i1p1f1, GISS-E2-1-G/r1i1p1f2, IPSL-CM6A-LR/r1i1p1f1, ACCESS-ESM1-5/r1i1p1f1, EC-Earth3/r1i1p1f1, CNRM-CM6-1/r1i1p1f2, AWI-CM-1-1-MR/r1i1p1f1, CNRM-ESM2-1/r1i1p1f2, FGOALS-g3/r1i1p1f1, INM-CM5-0/r1i1p1f1, MRI-ESM2-0/r1i1p1f1 |
| Reference Dataset | ERA5 |
| Units | kg/m2/s/decade |
| Period | 1980–2014 |
| CMIP6 MMM | Global Mean Trend Diff: -0.00 · Trend Rmse: None |
| MPI-ESM1-2-LR/r1i1p1f1 | Global Mean Trend Diff: -0.00 · Trend Rmse: None |
| GISS-E2-1-G/r1i1p1f2 | Global Mean Trend Diff: -0.00 · Trend Rmse: None |
| IPSL-CM6A-LR/r1i1p1f1 | Global Mean Trend Diff: -0.00 · Trend Rmse: None |
| ACCESS-ESM1-5/r1i1p1f1 | Global Mean Trend Diff: -0.00 · Trend Rmse: None |
| EC-Earth3/r1i1p1f1 | Global Mean Trend Diff: -0.00 · Trend Rmse: None |
| CNRM-CM6-1/r1i1p1f2 | Global Mean Trend Diff: -0.00 · Trend Rmse: None |
| AWI-CM-1-1-MR/r1i1p1f1 | Global Mean Trend Diff: -0.00 · Trend Rmse: None |
| CNRM-ESM2-1/r1i1p1f2 | Global Mean Trend Diff: -0.00 · Trend Rmse: None |
| FGOALS-g3/r1i1p1f1 | Global Mean Trend Diff: -0.00 · Trend Rmse: None |
| INM-CM5-0/r1i1p1f1 | Global Mean Trend Diff: -0.00 · Trend Rmse: None |
| MRI-ESM2-0/r1i1p1f1 | Global Mean Trend Diff: -0.00 · Trend Rmse: None |
Summary high
This figure displays linear trends in DJF total precipitation rate (1980–2014) for ERA5 reanalysis and the trend differences (biases) for IFS, ICON, and CMIP6 models. The analysis reveals a systematic inability of both high-resolution and standard-resolution models to reproduce the observed intensification of precipitation in the Western Pacific and the distinct zonal trend pattern of the Walker Circulation.
Key Findings
- Systematic Tropical Pacific bias: Almost all models, including high-resolution EERIE simulations, show a strong dipole error pattern with a dry trend bias in the Western Pacific/Maritime Continent and a wet trend bias in the Central/Eastern Pacific relative to ERA5.
- No resolution benefit for trend patterns: The IFS-FESOM2-SR and IFS-NEMO-ER models exhibit nearly identical zonal trend biases to the CMIP6 Multi-Model Mean, indicating that increased resolution does not correct the underlying dynamic response errors in the tropical overturning circulation.
- Atlantic and Indian Ocean biases: Models generally overestimate wetting trends in the Atlantic ITCZ and Central Indian Ocean compared to ERA5.
Spatial Patterns
The dominant spatial feature in the bias panels is a zonal dipole in the Tropical Pacific: blue (negative bias, models drier than obs) over the Maritime Continent and Western Pacific, and red (positive bias, models wetter than obs) extending across the Central and Eastern Pacific. ERA5 (top left) shows strong wetting centered on the Maritime Continent and SPCZ, which models fail to capture with sufficient magnitude. Additionally, a distinct band of positive trend bias is visible across the tropical Atlantic ITCZ in most simulations.
Model Agreement
There is high inter-model agreement regarding the sign and spatial structure of the Tropical Pacific trend bias. The IFS-FESOM2-SR, IFS-NEMO-ER, and CMIP6 MMM show very similar patterns. ICON-ESM-ER displays a noisier spatial structure but retains the large-scale zonal dipole error. Individual CMIP6 models show more variability but largely adhere to this systematic error pattern.
Physical Interpretation
The bias pattern is consistent with the well-known discrepancy in historical SST trends, where coupled models tend to simulate an 'El Niño-like' warming pattern (weakened Walker circulation, eastward shift of convection) whereas observations show a 'La Niña-like' trend (strengthened Walker circulation, enhanced warming/wetting in the West Pacific). The precipitation trend biases (wet east/dry west relative to obs) are a direct atmospheric consequence of these underlying SST gradient errors.
Caveats
- The analysis period (1980-2014) is relatively short, meaning internal multidecadal variability (e.g., IPO) could influence the observed trends.
- ERA5 precipitation is a model-derived product within the reanalysis system, though constrained by observations, and carries its own uncertainties.
Total Precipitation Rate JJA Linear Trend
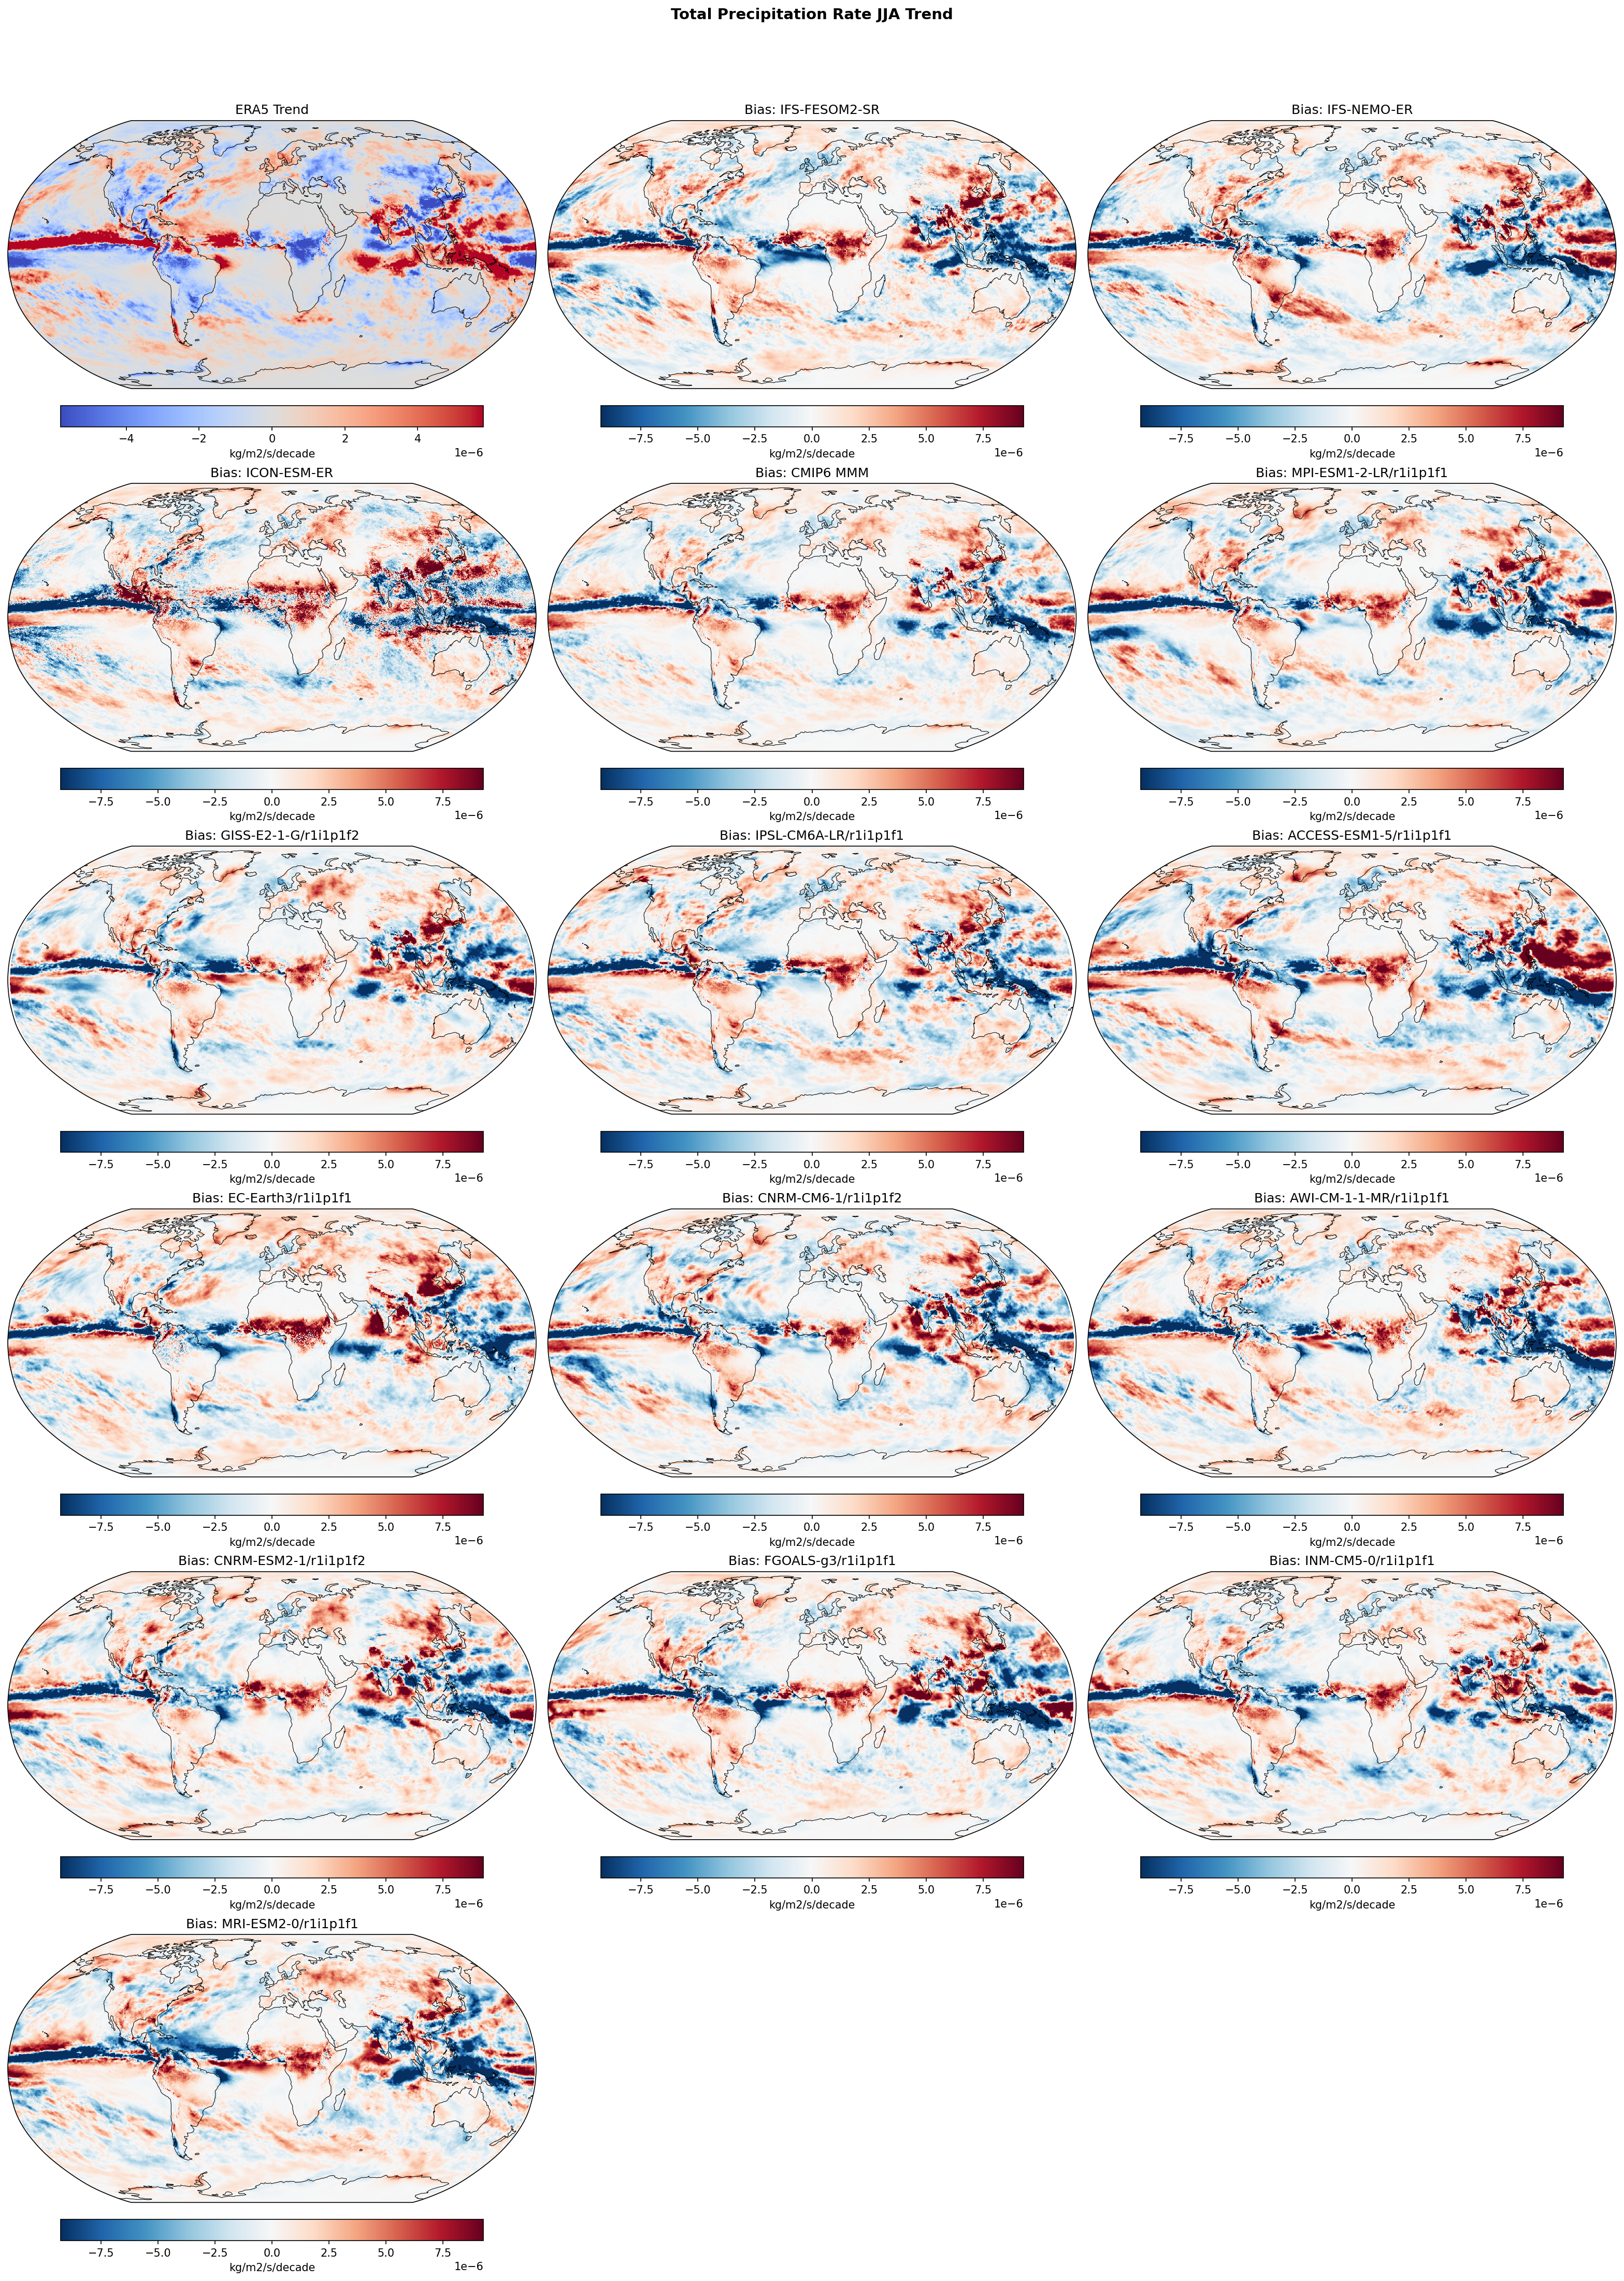
| Variables | pr |
|---|---|
| Models | IFS-FESOM2-SR, IFS-NEMO-ER, ICON-ESM-ER, CMIP6 MMM, MPI-ESM1-2-LR/r1i1p1f1, GISS-E2-1-G/r1i1p1f2, IPSL-CM6A-LR/r1i1p1f1, ACCESS-ESM1-5/r1i1p1f1, EC-Earth3/r1i1p1f1, CNRM-CM6-1/r1i1p1f2, AWI-CM-1-1-MR/r1i1p1f1, CNRM-ESM2-1/r1i1p1f2, FGOALS-g3/r1i1p1f1, INM-CM5-0/r1i1p1f1, MRI-ESM2-0/r1i1p1f1 |
| Reference Dataset | ERA5 |
| Units | kg/m2/s/decade |
| Period | 1980–2014 |
| CMIP6 MMM | Global Mean Trend Diff: -0.00 · Trend Rmse: None |
| MPI-ESM1-2-LR/r1i1p1f1 | Global Mean Trend Diff: -0.00 · Trend Rmse: None |
| GISS-E2-1-G/r1i1p1f2 | Global Mean Trend Diff: -0.00 · Trend Rmse: None |
| IPSL-CM6A-LR/r1i1p1f1 | Global Mean Trend Diff: -0.00 · Trend Rmse: None |
| ACCESS-ESM1-5/r1i1p1f1 | Global Mean Trend Diff: -0.00 · Trend Rmse: None |
| EC-Earth3/r1i1p1f1 | Global Mean Trend Diff: 0.00 · Trend Rmse: None |
| CNRM-CM6-1/r1i1p1f2 | Global Mean Trend Diff: -0.00 · Trend Rmse: None |
| AWI-CM-1-1-MR/r1i1p1f1 | Global Mean Trend Diff: -0.00 · Trend Rmse: None |
| CNRM-ESM2-1/r1i1p1f2 | Global Mean Trend Diff: -0.00 · Trend Rmse: None |
| FGOALS-g3/r1i1p1f1 | Global Mean Trend Diff: -0.00 · Trend Rmse: None |
| INM-CM5-0/r1i1p1f1 | Global Mean Trend Diff: -0.00 · Trend Rmse: None |
| MRI-ESM2-0/r1i1p1f1 | Global Mean Trend Diff: -0.00 · Trend Rmse: None |
Summary high
This figure evaluates June-August (JJA) linear trends in total precipitation (1980–2014) by comparing ERA5 reanalysis against high-resolution EERIE models (IFS, ICON) and a suite of CMIP6 models. The analysis highlights a systematic multi-model failure to capture observed trend patterns in the tropical Pacific.
Key Findings
- ERA5 shows a distinct trend pattern of drying in the Central/Eastern Pacific ITCZ and wetting in the Western Pacific/Maritime Continent, consistent with a strengthening Walker circulation.
- Almost all models, regardless of resolution, exhibit a strong 'positive' (wetting) bias in the Central/Eastern Pacific and a 'negative' (drying) bias in the Western Pacific relative to ERA5.
- The high-resolution models (IFS-FESOM2-SR, IFS-NEMO-ER, ICON-ESM-ER) share the same large-scale bias pattern as the CMIP6 Multi-Model Mean, indicating that increased resolution (~10 km) does not resolve this dynamical trend discrepancy.
- Bias magnitudes in the tropics (±5–7.5 × 10⁻⁶ kg/m²/s/decade) are frequently as large as or larger than the observed trends themselves.
Spatial Patterns
The dominant feature is a zonal dipole bias in the tropical Pacific: models consistently overestimate precipitation trends (red bias) in the Central/East Pacific and underestimate them (blue bias) in the West Pacific. In the Indian Ocean and SE Asia regions, biases are more mixed but often show drying biases (blue) where ERA5 shows wetting.
Model Agreement
There is high inter-model agreement regarding the sign of the error in the tropical Pacific. The bias pattern is robust across the EERIE high-resolution protocols and the standard CMIP6 ensemble, suggesting a fundamental common deficiency in simulating recent tropical atmospheric circulation trends.
Physical Interpretation
The bias pattern is symptomatic of the 'SST trend dilemma' or 'pattern effect.' Observations over this period show a La Niña-like cooling trend in the Eastern Pacific (driving the observed drying), whereas coupled models typically simulate an El Niño-like warming or uniform warming. This SST discrepancy drives the erroneous weakening or eastward shift of the Walker circulation in models, resulting in the observed precipitation trend biases.
Caveats
- The analysis period (1980–2014) is relatively short and strongly influenced by decadal internal variability (e.g., IPO), which models are not expected to phase-match with observations.
- Precipitation trends in ERA5 are derived from a reanalysis model and have their own uncertainties, although the large-scale zonal contrast is supported by satellite datasets (GPCP).
Mean Sea Level Pressure Annual Linear Trend
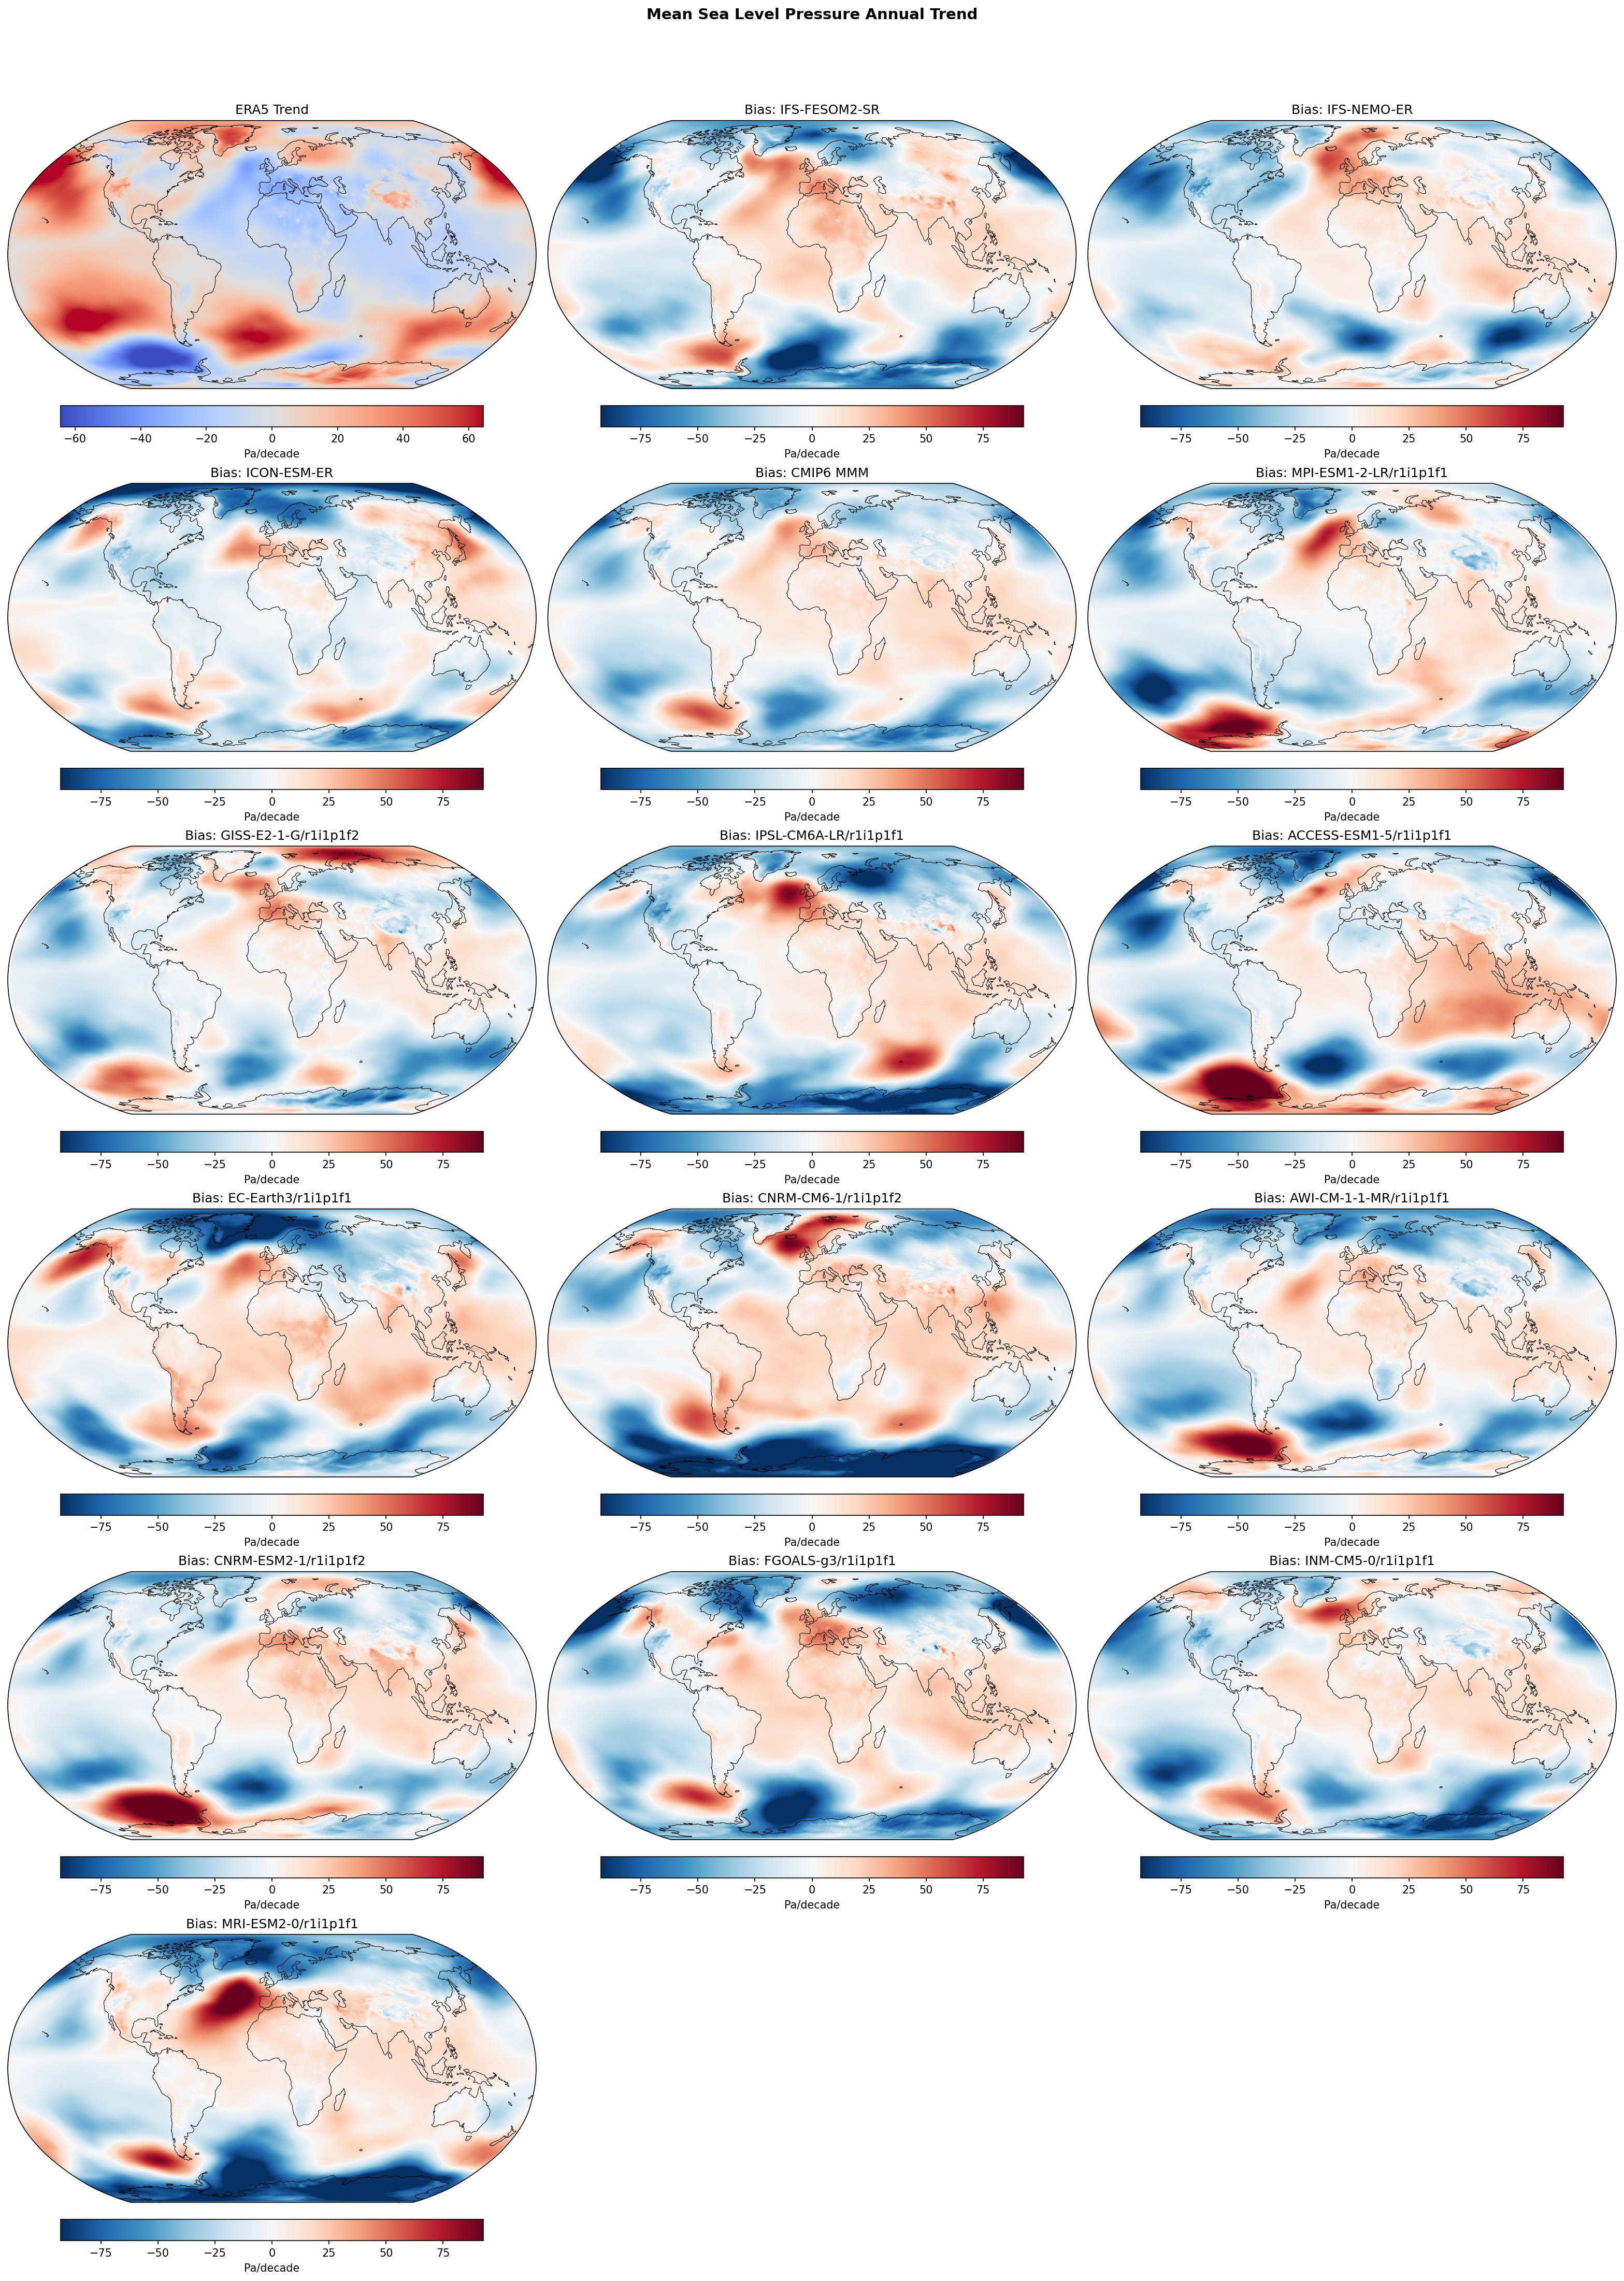
| Variables | psl |
|---|---|
| Models | IFS-FESOM2-SR, IFS-NEMO-ER, ICON-ESM-ER, CMIP6 MMM, MPI-ESM1-2-LR/r1i1p1f1, GISS-E2-1-G/r1i1p1f2, IPSL-CM6A-LR/r1i1p1f1, ACCESS-ESM1-5/r1i1p1f1, EC-Earth3/r1i1p1f1, CNRM-CM6-1/r1i1p1f2, AWI-CM-1-1-MR/r1i1p1f1, CNRM-ESM2-1/r1i1p1f2, FGOALS-g3/r1i1p1f1, INM-CM5-0/r1i1p1f1, MRI-ESM2-0/r1i1p1f1 |
| Reference Dataset | ERA5 |
| Units | Pa/decade |
| Period | 1980–2014 |
| IFS-FESOM2-SR | Global Mean Trend: -1.97 · Global Mean Trend Diff: -7.20 · Trend Rmse: 28.70 |
| IFS-NEMO-ER | Global Mean Trend: -1.48 · Global Mean Trend Diff: -6.71 · Trend Rmse: 23.64 |
| ICON-ESM-ER | Global Mean Trend: -1.36 · Global Mean Trend Diff: -6.59 · Trend Rmse: 22.56 |
| CMIP6 MMM | Global Mean Trend Diff: -5.92 · Trend Rmse: 21.65 |
| MPI-ESM1-2-LR/r1i1p1f1 | Global Mean Trend Diff: -6.64 · Trend Rmse: 25.69 |
| GISS-E2-1-G/r1i1p1f2 | Global Mean Trend Diff: -6.93 · Trend Rmse: 22.88 |
| IPSL-CM6A-LR/r1i1p1f1 | Global Mean Trend Diff: -7.58 · Trend Rmse: 28.03 |
| ACCESS-ESM1-5/r1i1p1f1 | Global Mean Trend Diff: -4.47 · Trend Rmse: 32.15 |
| EC-Earth3/r1i1p1f1 | Global Mean Trend Diff: -2.13 · Trend Rmse: 28.19 |
| CNRM-CM6-1/r1i1p1f2 | Global Mean Trend Diff: -4.38 · Trend Rmse: 32.79 |
| AWI-CM-1-1-MR/r1i1p1f1 | Global Mean Trend Diff: -7.37 · Trend Rmse: 26.68 |
| CNRM-ESM2-1/r1i1p1f2 | Global Mean Trend Diff: -3.34 · Trend Rmse: 25.78 |
| FGOALS-g3/r1i1p1f1 | Global Mean Trend Diff: -7.29 · Trend Rmse: 31.49 |
| INM-CM5-0/r1i1p1f1 | Global Mean Trend Diff: -7.75 · Trend Rmse: 26.52 |
| MRI-ESM2-0/r1i1p1f1 | Global Mean Trend Diff: -7.17 · Trend Rmse: 33.55 |
Summary high
This figure compares annual mean sea level pressure (PSL) linear trends (1980–2014) from ERA5 reanalysis against high-resolution EERIE simulations (IFS, ICON) and a suite of CMIP6 models, quantifying the discrepancy between observed and modeled circulation changes.
Key Findings
- ERA5 exhibits distinct high-magnitude trend features, notably a strong deepening of the Amundsen Sea Low (~ -60 Pa/decade) and pressure increases in the North Pacific (~ +50 Pa/decade).
- All models, including the high-resolution EERIE runs, display bias maps that strongly anticorrelate with the ERA5 trend pattern; they show positive biases where observations show negative trends (e.g., Southern Ocean) and negative biases where observations show positive trends (e.g., N. Pacific).
- The EERIE models (ICON-ESM-ER, IFS-NEMO-ER) show trend RMSEs (22.6 and 23.6 Pa/decade) that are competitive with the CMIP6 Multi-Model Mean (21.6 Pa/decade) and lower than several CMIP6 members, but resolution does not appear to correct the fundamental mismatch in trend patterns.
Spatial Patterns
The bias maps differ systematically from the ERA5 trend map. Where ERA5 shows a strong dipole (pressure rise in N. Pacific, fall in Amundsen Sea), the models consistently show the opposite error pattern (negative bias in N. Pacific, positive bias in Amundsen Sea). This indicates the models generally produce trends near zero or of insufficient magnitude compared to the strong directional trends in the observational record.
Model Agreement
There is striking agreement across the entire ensemble (EERIE and CMIP6) regarding the spatial structure of the trend 'bias'. The uniformity of this error pattern suggests it stems from a common factor—likely the lack of synchronization of internal variability—rather than specific parameterization or resolution differences.
Physical Interpretation
The 1980–2014 period is heavily influenced by specific phases of multi-decadal internal variability (e.g., IPO/PDO, SAM evolution, NAO). As free-running coupled models generate their own independent phases of internal variability, they do not reproduce the specific historical realization of these modes seen in ERA5. Consequently, the 'bias' maps largely reveal the inverse of the observed internal variability signal, which overwhelms the weaker forced climate response in this metric.
Caveats
- Comparing linear trends over a short 35-year period in free-running models against observations is primarily a test of internal variability phasing rather than model physics or forced response fidelity.
- The deepening Amundsen Sea Low has a known forced component (ozone/GHG) which models may systematically underestimate, contributing to the positive bias there beyond just variability mismatch.
Mean Sea Level Pressure DJF Linear Trend
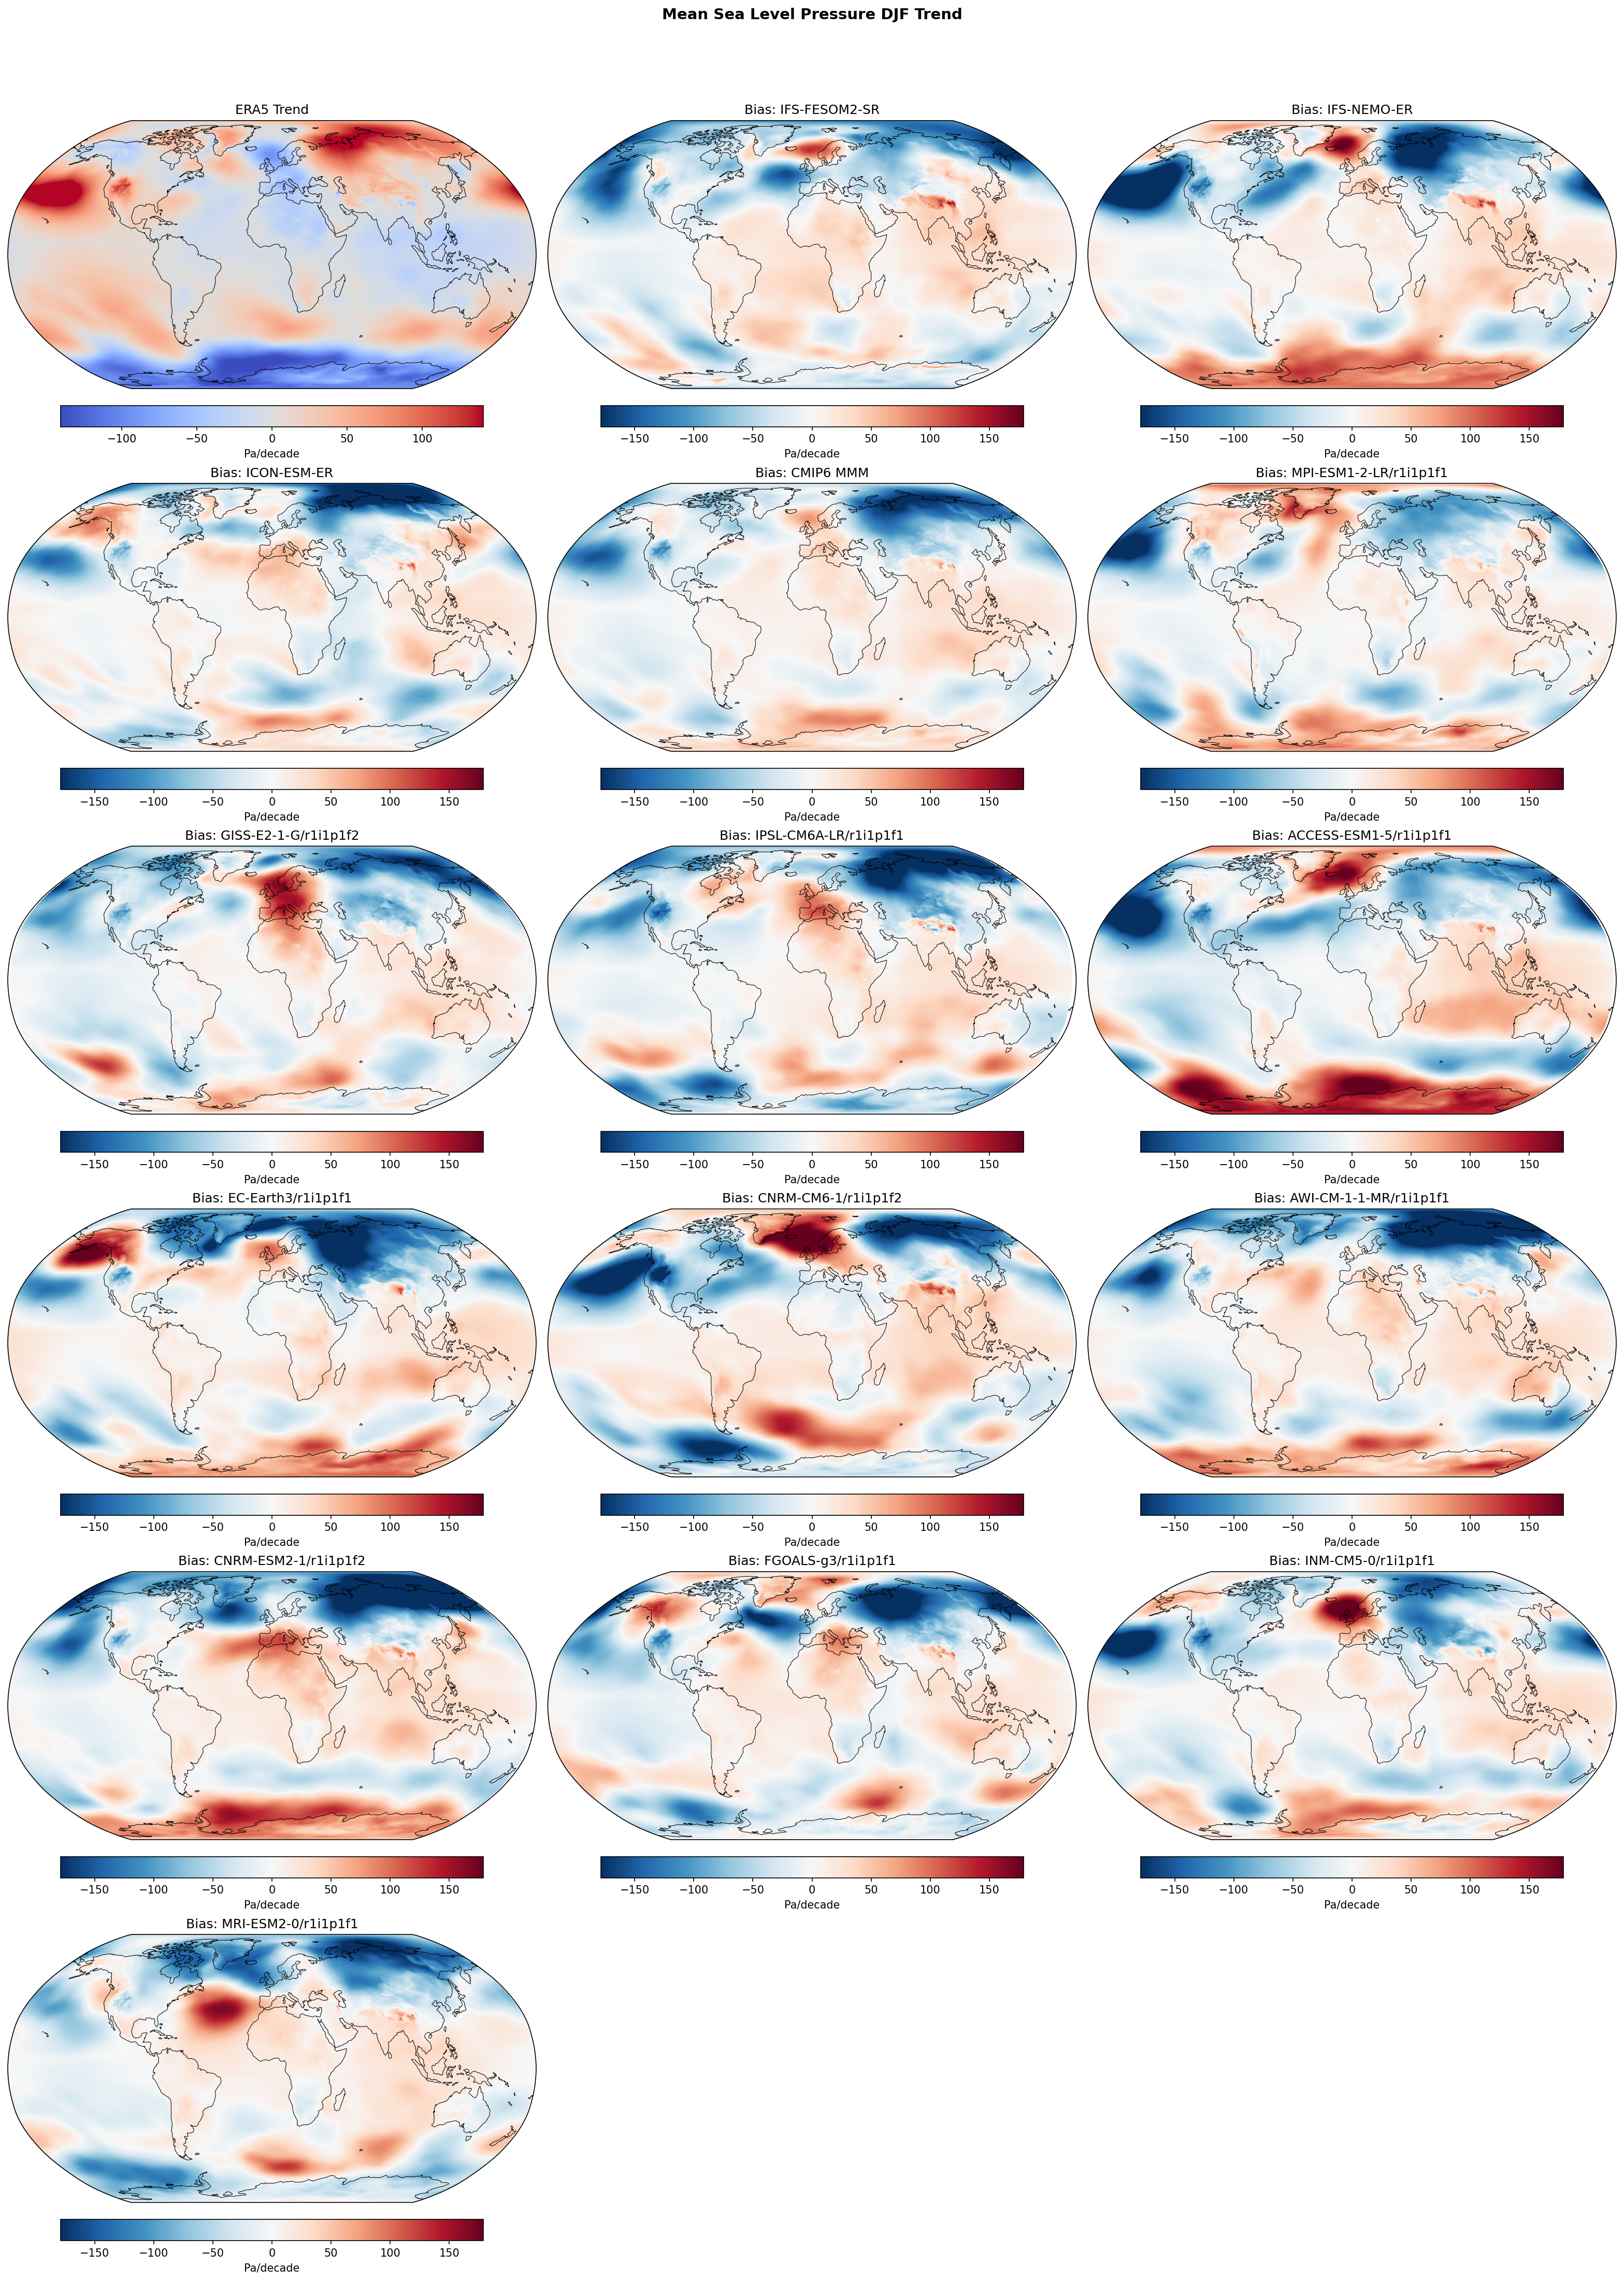
| Variables | psl |
|---|---|
| Models | IFS-FESOM2-SR, IFS-NEMO-ER, ICON-ESM-ER, CMIP6 MMM, MPI-ESM1-2-LR/r1i1p1f1, GISS-E2-1-G/r1i1p1f2, IPSL-CM6A-LR/r1i1p1f1, ACCESS-ESM1-5/r1i1p1f1, EC-Earth3/r1i1p1f1, CNRM-CM6-1/r1i1p1f2, AWI-CM-1-1-MR/r1i1p1f1, CNRM-ESM2-1/r1i1p1f2, FGOALS-g3/r1i1p1f1, INM-CM5-0/r1i1p1f1, MRI-ESM2-0/r1i1p1f1 |
| Reference Dataset | ERA5 |
| Units | Pa/decade |
| Period | 1980–2014 |
| CMIP6 MMM | Global Mean Trend Diff: -6.70 · Trend Rmse: None |
| MPI-ESM1-2-LR/r1i1p1f1 | Global Mean Trend Diff: -6.53 · Trend Rmse: None |
| GISS-E2-1-G/r1i1p1f2 | Global Mean Trend Diff: -7.08 · Trend Rmse: None |
| IPSL-CM6A-LR/r1i1p1f1 | Global Mean Trend Diff: -8.14 · Trend Rmse: None |
| ACCESS-ESM1-5/r1i1p1f1 | Global Mean Trend Diff: -5.41 · Trend Rmse: None |
| EC-Earth3/r1i1p1f1 | Global Mean Trend Diff: -4.19 · Trend Rmse: None |
| CNRM-CM6-1/r1i1p1f2 | Global Mean Trend Diff: -5.74 · Trend Rmse: None |
| AWI-CM-1-1-MR/r1i1p1f1 | Global Mean Trend Diff: -7.93 · Trend Rmse: None |
| CNRM-ESM2-1/r1i1p1f2 | Global Mean Trend Diff: -4.57 · Trend Rmse: None |
| FGOALS-g3/r1i1p1f1 | Global Mean Trend Diff: -7.68 · Trend Rmse: None |
| INM-CM5-0/r1i1p1f1 | Global Mean Trend Diff: -8.41 · Trend Rmse: None |
| MRI-ESM2-0/r1i1p1f1 | Global Mean Trend Diff: -7.76 · Trend Rmse: None |
Summary high
This figure displays linear trends in Dec-Jan-Feb (DJF) Mean Sea Level Pressure (PSL) from 1980–2014, comparing ERA5 observations against three high-resolution EERIE models and the CMIP6 ensemble. The dominant feature is a systematic discrepancy where models fail to reproduce the strong positive pressure trend observed in the North Pacific and underestimate the magnitude of the Southern Annular Mode (SAM) intensification.
Key Findings
- A prominent positive PSL trend (~100 Pa/decade) exists in the North Pacific in ERA5, but all models (EERIE and CMIP6) show a strong negative bias here, indicating they predict no trend or a negative trend in this region.
- ERA5 shows a clear strengthening of the Southern Annular Mode (pressure drop over Antarctica, rise in southern mid-latitudes), which models generally underestimate, appearing as a 'positive bias at the pole / negative bias in mid-latitudes' dipole.
- The high-resolution EERIE models (IFS-FESOM2-SR, IFS-NEMO-ER, ICON-ESM-ER) exhibit bias patterns remarkably similar to the coarse-resolution CMIP6 Multi-Model Mean, suggesting that increased resolution does not automatically correct these multi-decadal circulation trend discrepancies.
- A positive trend over the North Atlantic/Europe in observations is largely missed by the models, resulting in negative trend biases over Europe.
Spatial Patterns
ERA5 shows a strong high-pressure trend in the North Pacific and a SAM-like dipole in the Southern Hemisphere. The trend difference maps (Bias panels) are dominated by a large blue (negative) anomaly in the North Pacific across almost all models. In the Southern Hemisphere, difference maps frequently show a concentric pattern (red over Antarctica, blue in mid-latitudes), reflecting the models' weaker meridional pressure gradient trends compared to observations.
Model Agreement
There is high inter-model agreement in the spatial structure of the bias. The EERIE models (IFS and ICON variants) cluster closely with the CMIP6 Multi-Model Mean, all sharing the inability to capture the specific phase/magnitude of the North Pacific and Southern Ocean trends seen in ERA5.
Physical Interpretation
The North Pacific discrepancy is likely due to internal climate variability (e.g., the Pacific Decadal Oscillation or IPO) where the observed realization (1980–2014) had a specific phase that free-running coupled models are not expected to match in unison. The systematic underestimation of the Southern Hemisphere trends suggests models may have a too-weak response to ozone depletion and greenhouse gas forcing, which drives the poleward jet shift and SAM intensification.
Caveats
- Evaluating trends from free-running coupled models against a single observational realization over 35 years is dominated by internal variability; a mismatch does not necessarily imply model error in forced response.
- Units are Pa/decade; a bias of 100 Pa/decade accumulates to ~3.5 hPa over the analysis period, which is significant for circulation but small relative to absolute climatological pressure.
Mean Sea Level Pressure JJA Linear Trend
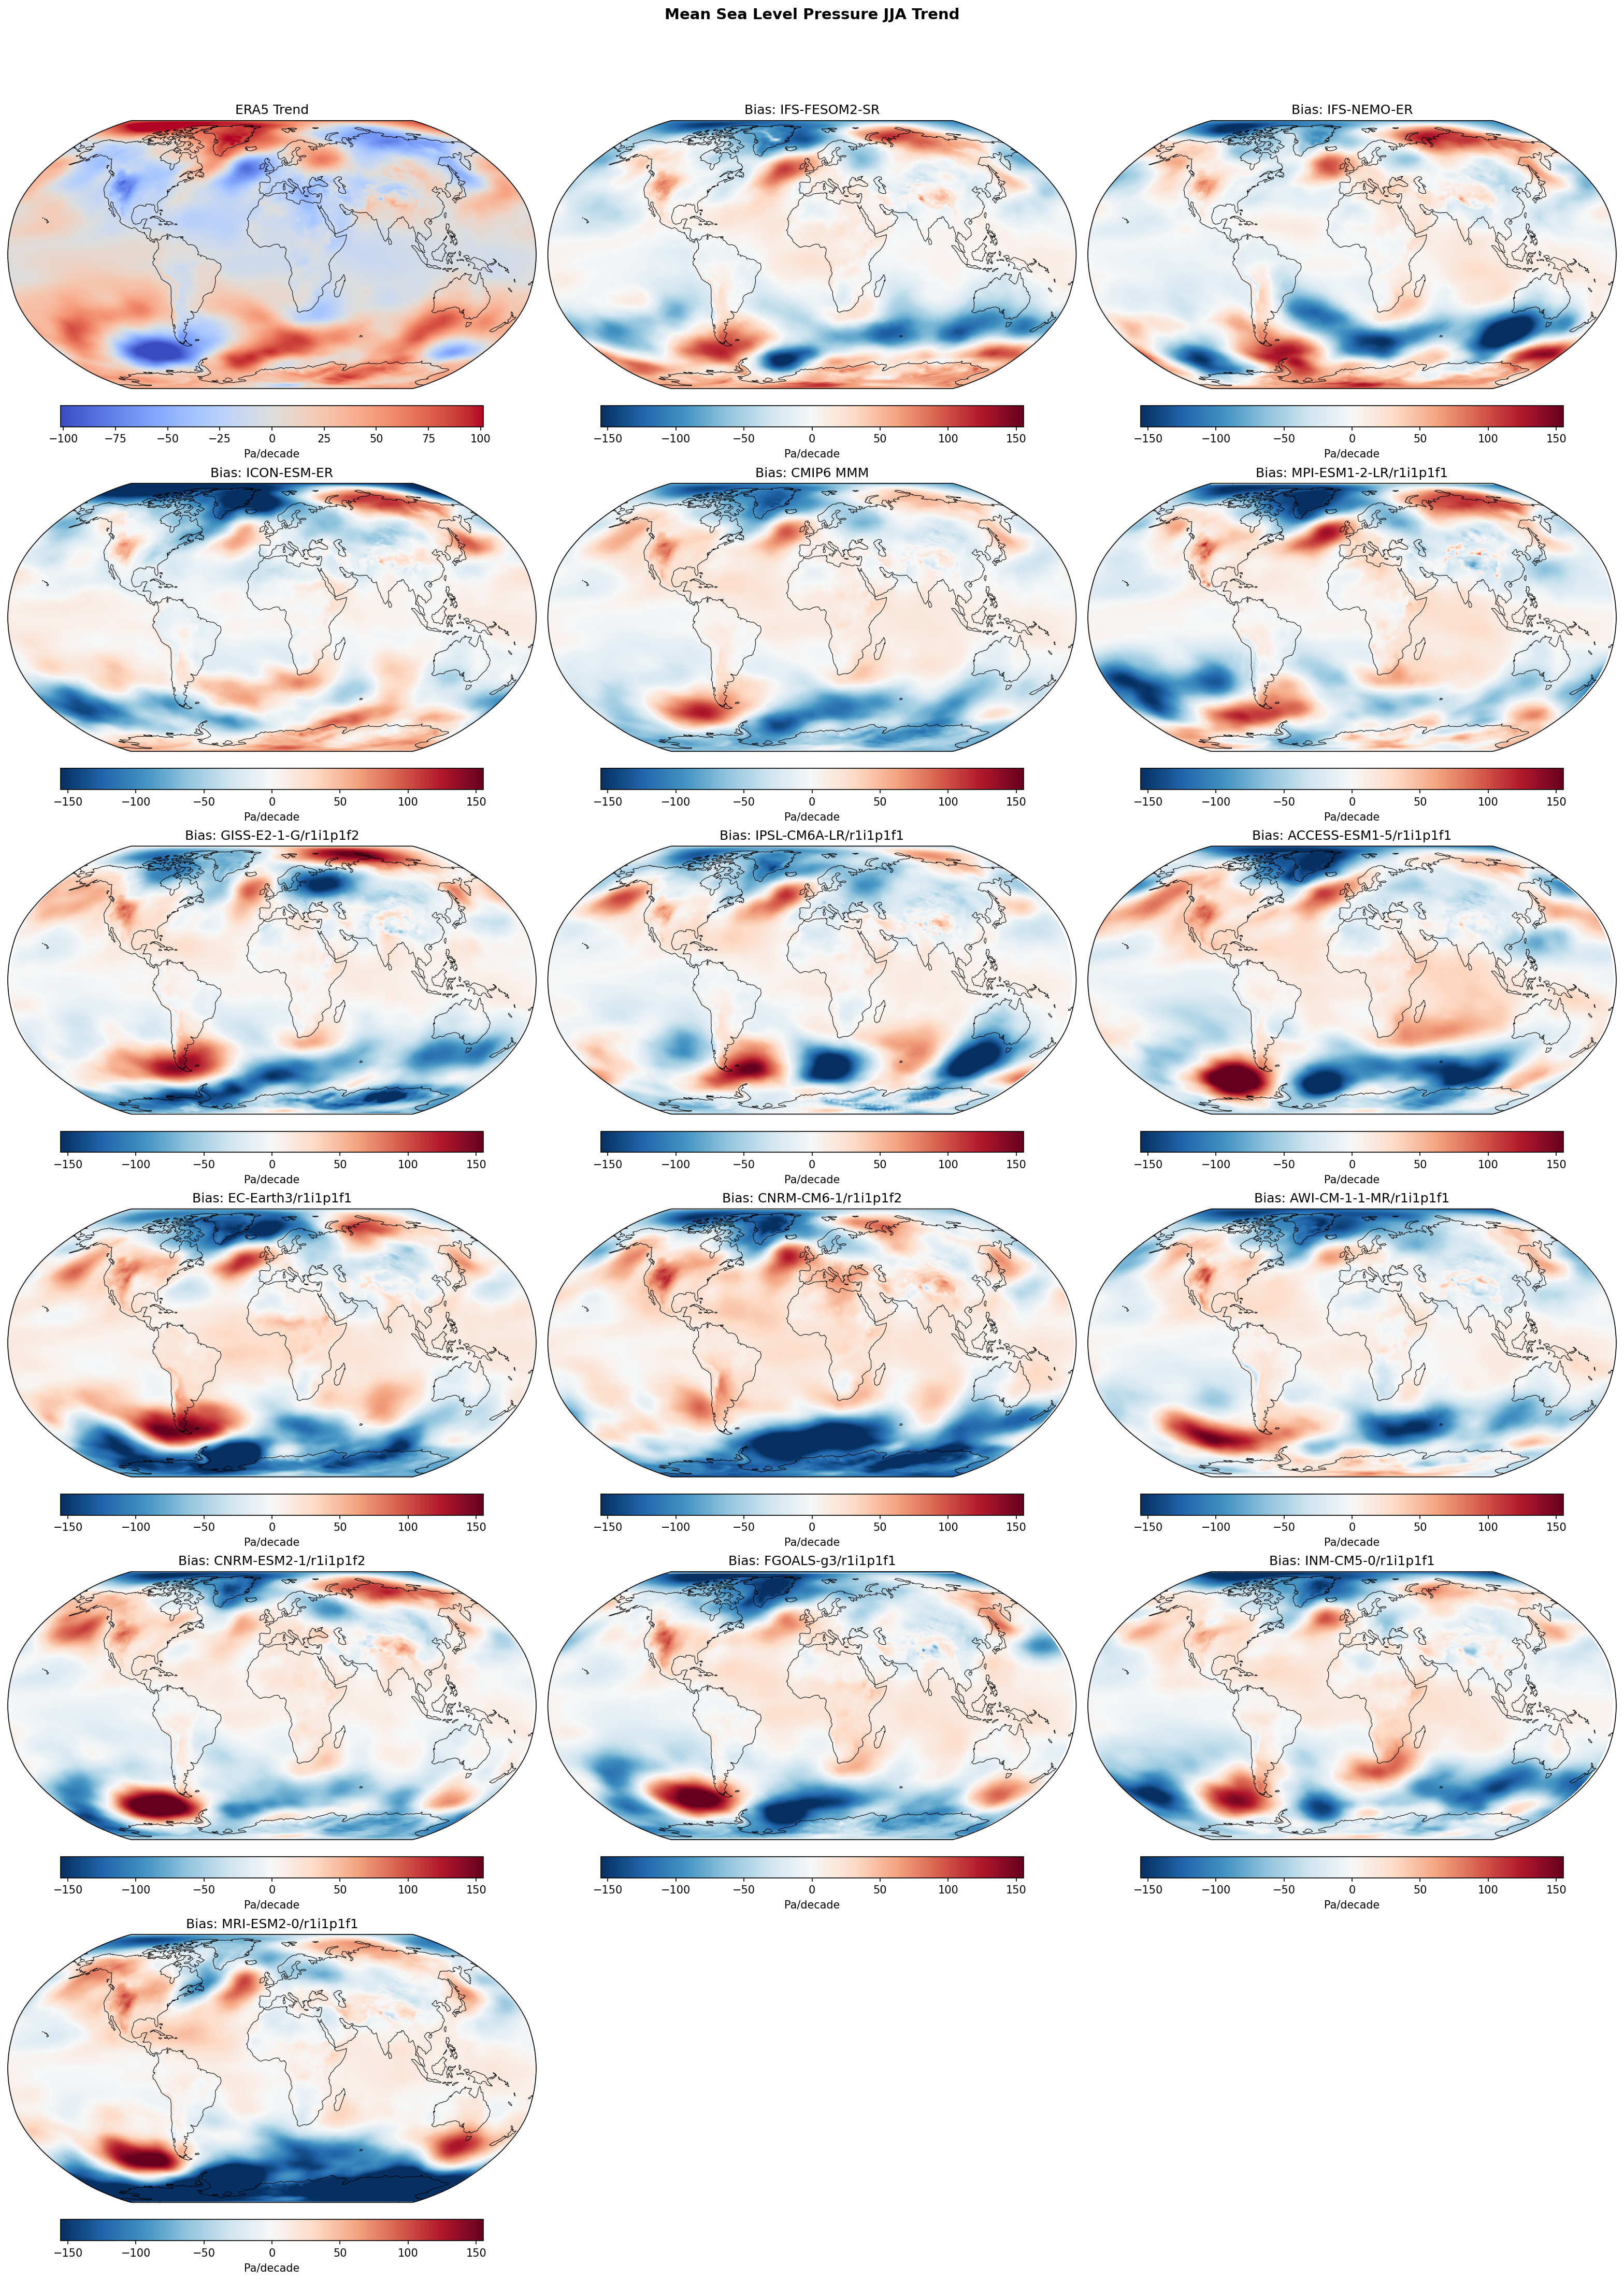
| Variables | psl |
|---|---|
| Models | IFS-FESOM2-SR, IFS-NEMO-ER, ICON-ESM-ER, CMIP6 MMM, MPI-ESM1-2-LR/r1i1p1f1, GISS-E2-1-G/r1i1p1f2, IPSL-CM6A-LR/r1i1p1f1, ACCESS-ESM1-5/r1i1p1f1, EC-Earth3/r1i1p1f1, CNRM-CM6-1/r1i1p1f2, AWI-CM-1-1-MR/r1i1p1f1, CNRM-ESM2-1/r1i1p1f2, FGOALS-g3/r1i1p1f1, INM-CM5-0/r1i1p1f1, MRI-ESM2-0/r1i1p1f1 |
| Reference Dataset | ERA5 |
| Units | Pa/decade |
| Period | 1980–2014 |
| CMIP6 MMM | Global Mean Trend Diff: -5.36 · Trend Rmse: None |
| MPI-ESM1-2-LR/r1i1p1f1 | Global Mean Trend Diff: -6.36 · Trend Rmse: None |
| GISS-E2-1-G/r1i1p1f2 | Global Mean Trend Diff: -7.51 · Trend Rmse: None |
| IPSL-CM6A-LR/r1i1p1f1 | Global Mean Trend Diff: -7.25 · Trend Rmse: None |
| ACCESS-ESM1-5/r1i1p1f1 | Global Mean Trend Diff: -3.22 · Trend Rmse: None |
| EC-Earth3/r1i1p1f1 | Global Mean Trend Diff: -0.57 · Trend Rmse: None |
| CNRM-CM6-1/r1i1p1f2 | Global Mean Trend Diff: -3.10 · Trend Rmse: None |
| AWI-CM-1-1-MR/r1i1p1f1 | Global Mean Trend Diff: -6.84 · Trend Rmse: None |
| CNRM-ESM2-1/r1i1p1f2 | Global Mean Trend Diff: -2.37 · Trend Rmse: None |
| FGOALS-g3/r1i1p1f1 | Global Mean Trend Diff: -7.01 · Trend Rmse: None |
| INM-CM5-0/r1i1p1f1 | Global Mean Trend Diff: -7.35 · Trend Rmse: None |
| MRI-ESM2-0/r1i1p1f1 | Global Mean Trend Diff: -7.21 · Trend Rmse: None |
Summary high
This figure illustrates the linear trends in Mean Sea Level Pressure (MSLP) for the JJA season over the period 1980–2014, comparing ERA5 observations with three high-resolution EERIE models (IFS-FESOM2-SR, IFS-NEMO-ER, ICON-ESM-ER) and a suite of CMIP6 models. The panels show the ERA5 trend (top-left) and the difference between model trends and the observed trend (denoted as bias).
Key Findings
- ERA5 displays strong, regionally distinct trends in the Southern Hemisphere (SH) high latitudes, characterized by a wave-like dipole with pressure increases south of Australia/New Zealand and pressure decreases in the Amundsen/Bellingshausen Sea sector.
- Both EERIE and individual CMIP6 models exhibit large-magnitude trend differences (biases) in the SH, often exceeding ±100 Pa/decade, which is comparable to the magnitude of the observed signal.
- The spatial patterns of the trend differences in the SH often resemble the inverse of the observed trend (e.g., negative bias where observations show positive trends), indicating that the free-running models do not reproduce the specific phase of decadal circulation variability seen in observations.
- The CMIP6 Multi-Model Mean (MMM) shows much weaker, smoother bias patterns than individual models, suggesting that the strong regional discrepancies in individual simulations (including EERIE models) are largely due to unforced internal variability rather than systematic forcing errors.
Spatial Patterns
The most prominent features are in the Southern Ocean. ERA5 shows a zonal wave-3 like structure. The model difference maps show large-scale dipoles or tripoles in this region. For instance, IFS-FESOM2-SR and IFS-NEMO-ER show a negative trend bias south of Australia and a positive trend bias in the Pacific sector, opposing the observed trends. In the Northern Hemisphere, IFS models show a positive trend bias (red) over the North Atlantic and Greenland, suggesting they overestimate pressure rises or underestimate deepening in this region relative to ERA5.
Model Agreement
There is low agreement between models and observations regarding regional trend details, particularly in the Southern Hemisphere. The high-resolution EERIE models behave similarly to individual CMIP6 ensemble members, showing high-amplitude regional trend differences. This divergence is expected for single realizations of coupled models where internal variability phases are random relative to history.
Physical Interpretation
The large discrepancies in regional MSLP trends are likely driven by internal climate variability (e.g., the Southern Annular Mode and associated planetary wave trains) rather than model resolution or physics deficiencies. A 35-year period is insufficient to separate the forced climate response from internal decadal variability. Consequently, free-running coupled models (whether EERIE or CMIP6) will generate their own circulation trends that do not phase-match the specific historical realization of internal variability captured by ERA5.
Caveats
- Comparing linear trends of circulation metrics from single model realizations against observations over short climatological periods (35 years) is dominated by internal variability noise.
- Large 'biases' here do not necessarily indicate model error, but rather a lack of phase synchronization in decadal variability.
Surface Downwelling Longwave Annual Linear Trend
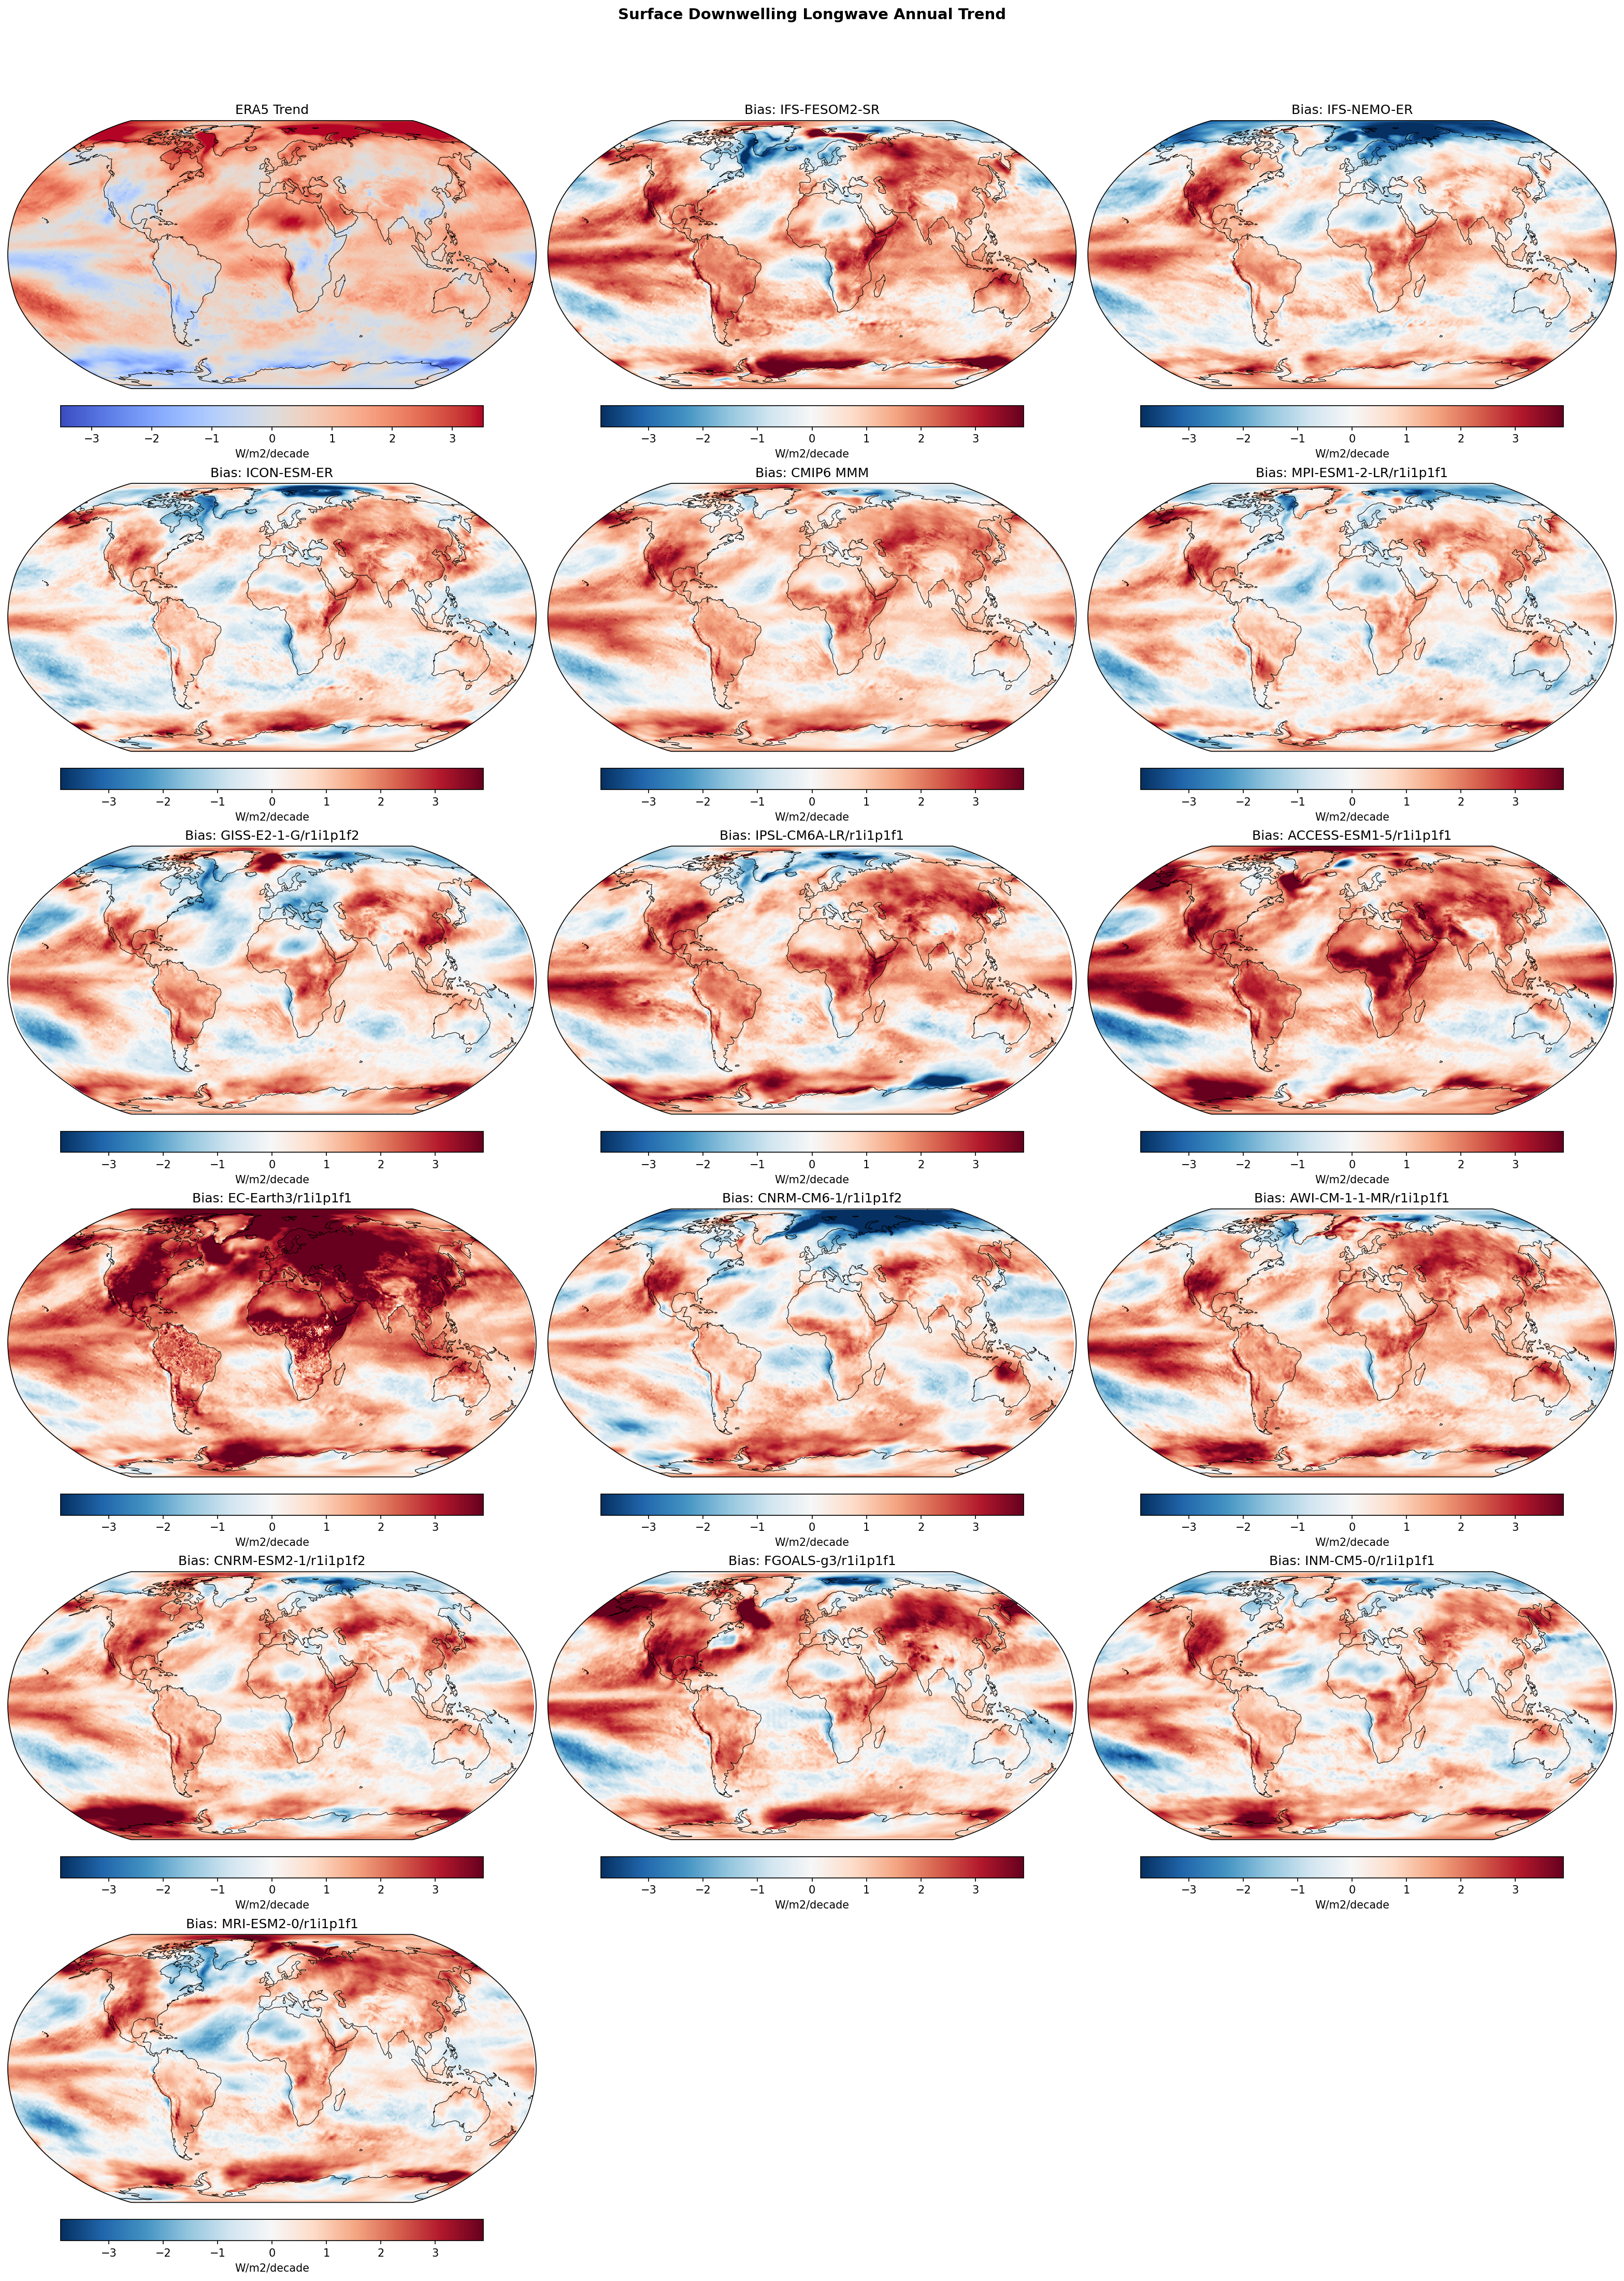
| Variables | rlds |
|---|---|
| Models | IFS-FESOM2-SR, IFS-NEMO-ER, ICON-ESM-ER, CMIP6 MMM, MPI-ESM1-2-LR/r1i1p1f1, GISS-E2-1-G/r1i1p1f2, IPSL-CM6A-LR/r1i1p1f1, ACCESS-ESM1-5/r1i1p1f1, EC-Earth3/r1i1p1f1, CNRM-CM6-1/r1i1p1f2, AWI-CM-1-1-MR/r1i1p1f1, CNRM-ESM2-1/r1i1p1f2, FGOALS-g3/r1i1p1f1, INM-CM5-0/r1i1p1f1, MRI-ESM2-0/r1i1p1f1 |
| Reference Dataset | ERA5 |
| Units | W/m2/decade |
| Period | 1980–2014 |
| IFS-FESOM2-SR | Global Mean Trend: 1.84 · Global Mean Trend Diff: 1.06 · Trend Rmse: 1.56 |
| IFS-NEMO-ER | Global Mean Trend: 1.24 · Global Mean Trend Diff: 0.45 · Trend Rmse: 1.23 |
| ICON-ESM-ER | Global Mean Trend: 1.18 · Global Mean Trend Diff: 0.39 · Trend Rmse: 1.04 |
| CMIP6 MMM | Global Mean Trend Diff: 0.87 · Trend Rmse: 1.24 |
| MPI-ESM1-2-LR/r1i1p1f1 | Global Mean Trend Diff: 0.40 · Trend Rmse: 1.02 |
| GISS-E2-1-G/r1i1p1f2 | Global Mean Trend Diff: 0.51 · Trend Rmse: 1.21 |
| IPSL-CM6A-LR/r1i1p1f1 | Global Mean Trend Diff: 0.97 · Trend Rmse: 1.49 |
| ACCESS-ESM1-5/r1i1p1f1 | Global Mean Trend Diff: 1.32 · Trend Rmse: 1.87 |
| EC-Earth3/r1i1p1f1 | Global Mean Trend Diff: 1.86 · Trend Rmse: 2.37 |
| CNRM-CM6-1/r1i1p1f2 | Global Mean Trend Diff: 0.46 · Trend Rmse: 1.34 |
| AWI-CM-1-1-MR/r1i1p1f1 | Global Mean Trend Diff: 1.03 · Trend Rmse: 1.46 |
| CNRM-ESM2-1/r1i1p1f2 | Global Mean Trend Diff: 0.78 · Trend Rmse: 1.28 |
| FGOALS-g3/r1i1p1f1 | Global Mean Trend Diff: 0.96 · Trend Rmse: 1.60 |
| INM-CM5-0/r1i1p1f1 | Global Mean Trend Diff: 0.68 · Trend Rmse: 1.26 |
| MRI-ESM2-0/r1i1p1f1 | Global Mean Trend Diff: 0.61 · Trend Rmse: 1.21 |
Summary high
This figure evaluates 1980–2014 annual linear trends in surface downwelling longwave radiation (rlds) for EERIE and CMIP6 models compared to ERA5. Most models simulate a stronger positive trend (warming) than the reanalysis, with the high-resolution ICON-ESM-ER and IFS-NEMO-ER performing notably better (lower trend bias) than the CMIP6 Multi-Model Mean and IFS-FESOM2-SR.
Key Findings
- Systematic Overestimation: The majority of models (panels 2–15) show positive trend differences (red), indicating they simulate a faster increase in downwelling longwave radiation (0.4–1.9 W/m²/decade excess) than ERA5.
- EERIE Model Divergence: Despite sharing an atmospheric component, IFS-NEMO-ER (0.45 W/m²/dec bias) significantly outperforms IFS-FESOM2-SR (1.06 W/m²/dec bias), suggesting ocean/sea-ice coupling strongly influences atmospheric radiative trends.
- Best Performers: ICON-ESM-ER (0.39 bias, 1.04 RMSE) and IFS-NEMO-ER align with the best-performing CMIP6 models (e.g., MPI-ESM1-2-LR), showing much closer agreement to observed trends than the CMIP6 ensemble mean.
Spatial Patterns
ERA5 (top left) shows moderate widespread increases with Arctic amplification. The model difference panels reveal that errors are not spatially uniform: the largest excesses in trend (deep red) occur in the Arctic (indicating excessive polar amplification mechanisms) and the Southern Ocean (where models generally fail to capture observed delayed warming/cooling). The Tropical Pacific shows mixed signals, likely related to mismatches in simulating the historical ENSO/PDO phase (observed La Niña-like cooling vs. model warming).
Model Agreement
There is significant inter-model spread. 'High-sensitivity' models like EC-Earth3 and ACCESS-ESM1-5 show intense global reddening (biases >1.3 W/m²/dec), while ICON-ESM-ER and MPI-ESM1-2-LR are much more neutral (white/pale colors). The CMIP6 MMM obscures this spread but generally indicates a positive trend bias.
Physical Interpretation
Surface downwelling longwave radiation is primarily driven by atmospheric temperature, water vapor, and cloud cover. The widespread positive trend bias suggests that in most coupled models, the feedback loop (warming surface → moistening atmosphere → increased rlds) is stronger than in the ERA5 reanalysis. The stark difference between IFS-NEMO and IFS-FESOM implies that the FESOM2 ocean/ice component may be driving faster surface warming or sea-ice loss, forcing a stronger atmospheric radiative response. The Southern Ocean discrepancies highlight the common model difficulty in reproducing the observed lack of warming in that region, possibly due to meltwater, ozone, or cloud feedback errors.
Caveats
- ERA5 trends are reanalysis products, not direct observations, and are subject to their own model physics uncertainties.
- The 35-year period (1980–2014) is short enough that internal variability (e.g., IPO phases) can significantly affect trend comparisons; models are free-running and not expected to match the specific phase of internal variability seen in observations.
Surface Downwelling Longwave DJF Linear Trend
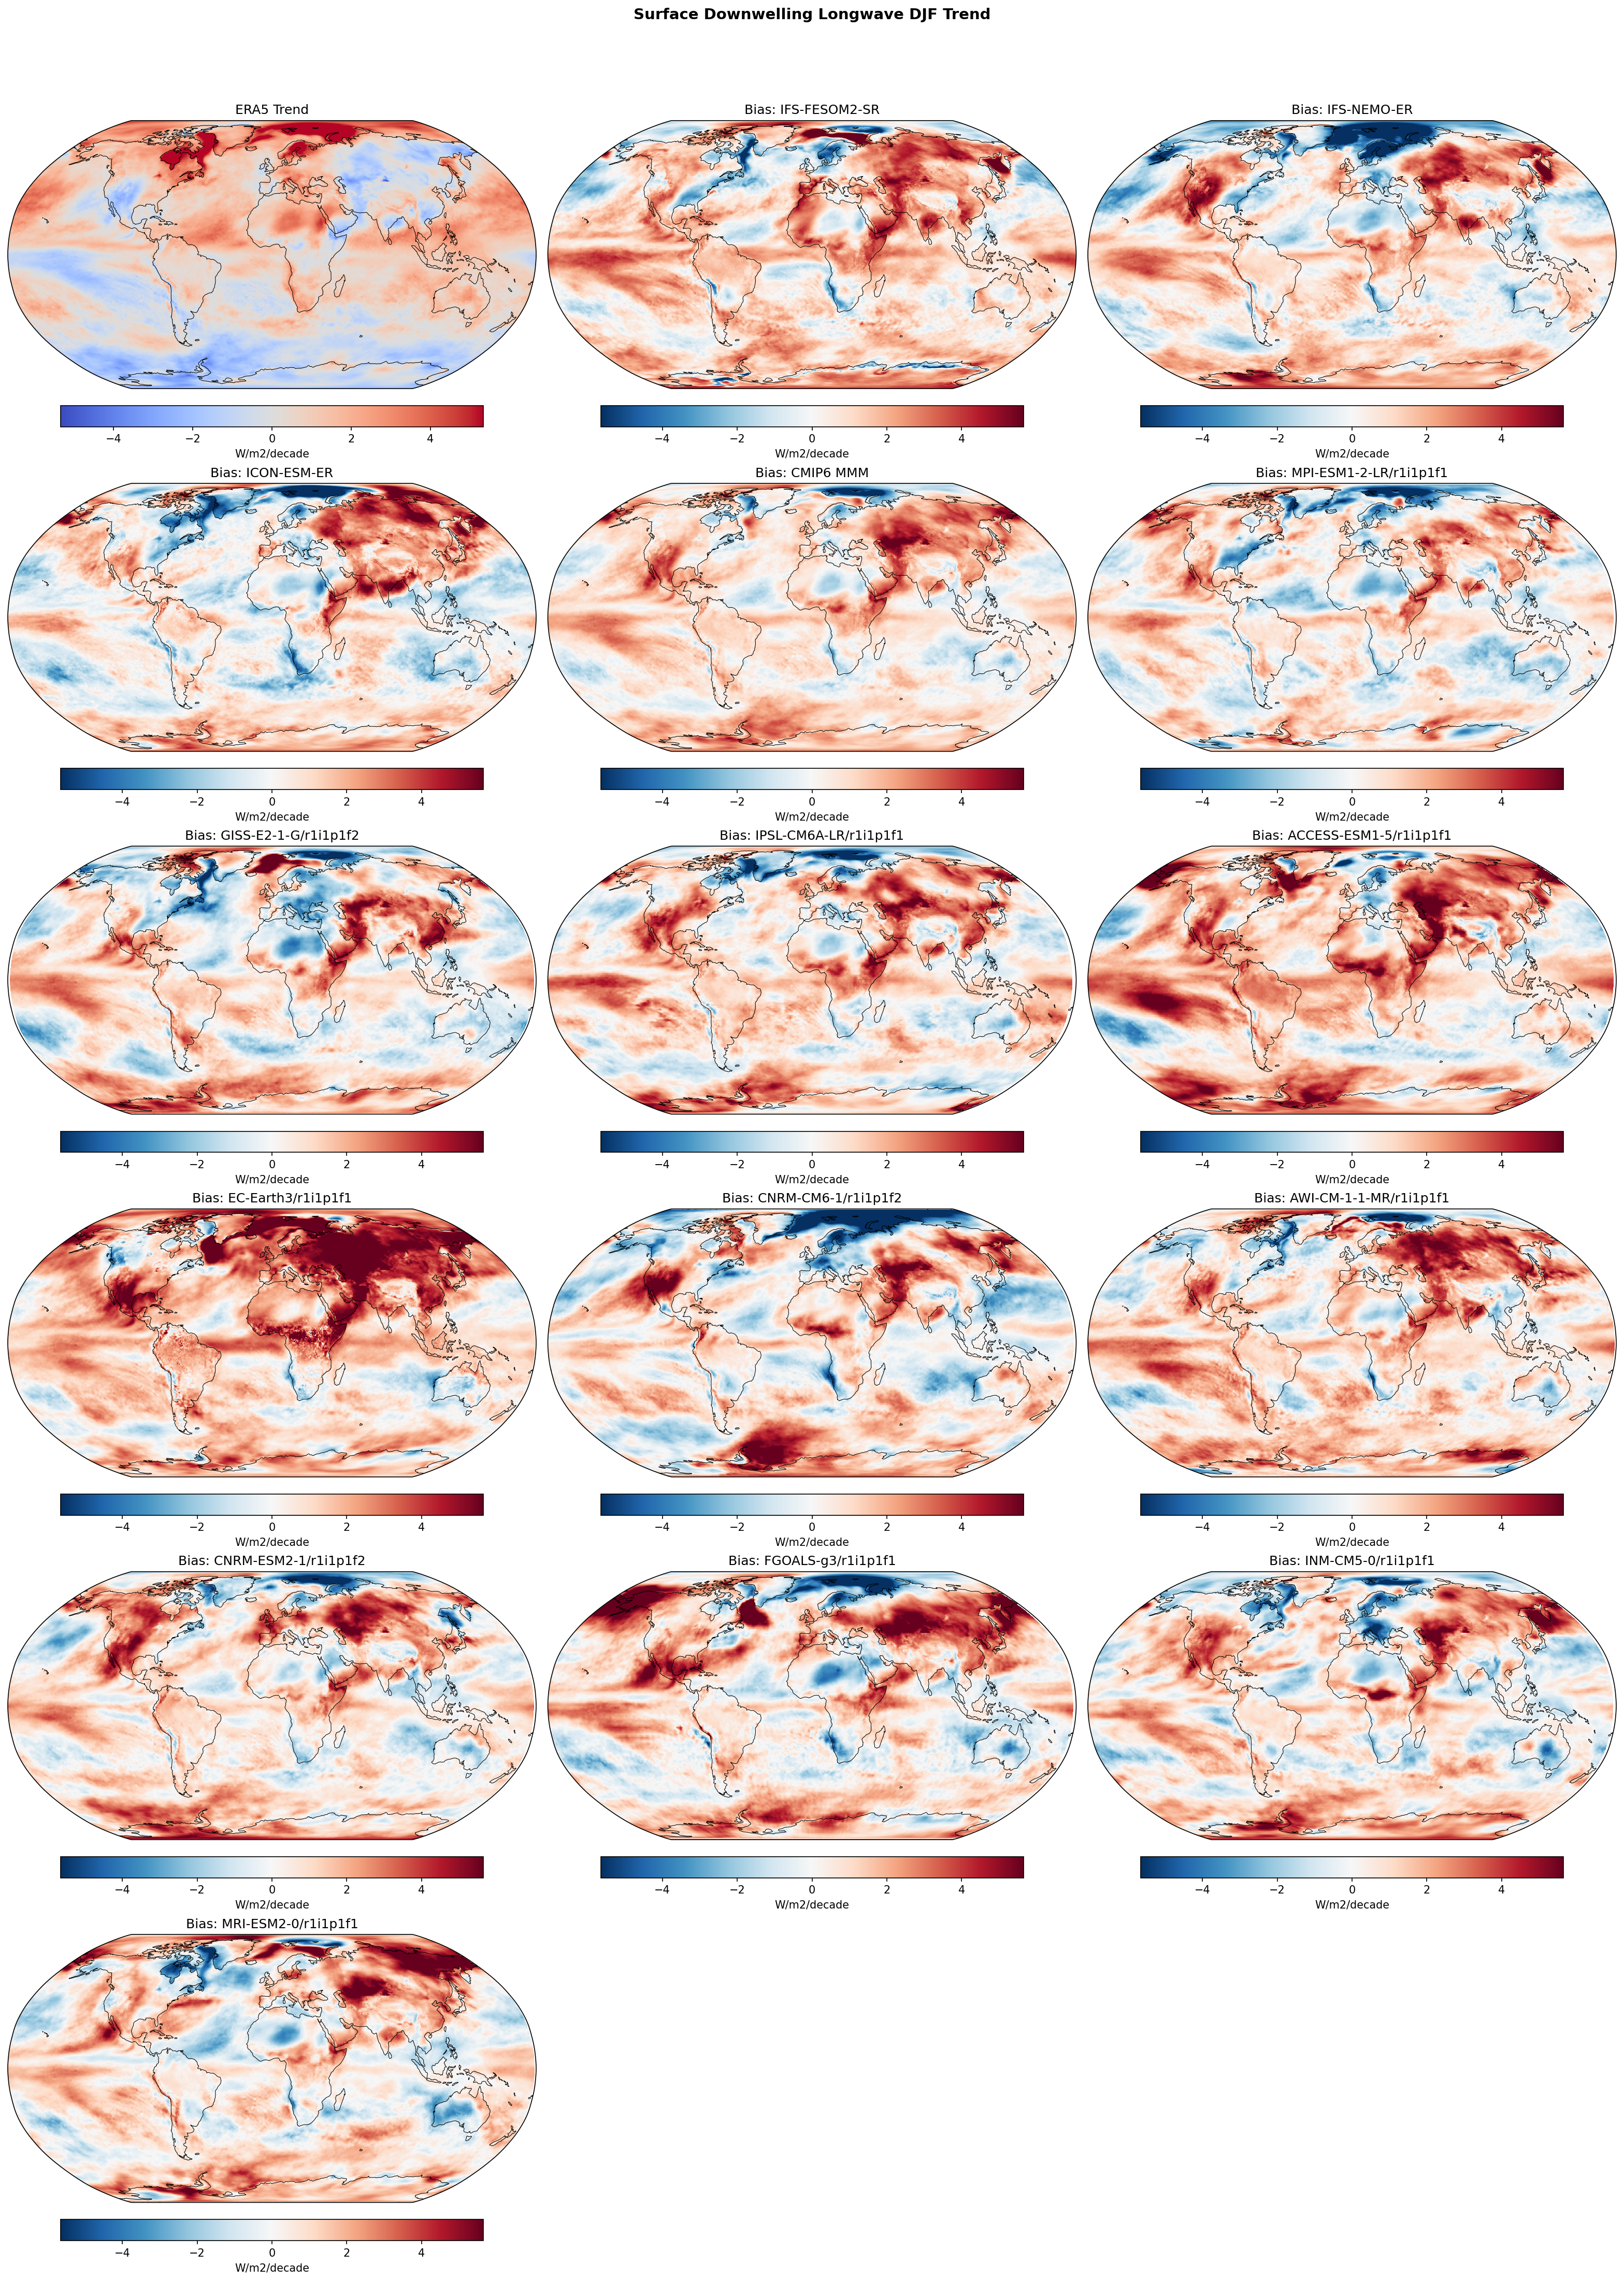
| Variables | rlds |
|---|---|
| Models | IFS-FESOM2-SR, IFS-NEMO-ER, ICON-ESM-ER, CMIP6 MMM, MPI-ESM1-2-LR/r1i1p1f1, GISS-E2-1-G/r1i1p1f2, IPSL-CM6A-LR/r1i1p1f1, ACCESS-ESM1-5/r1i1p1f1, EC-Earth3/r1i1p1f1, CNRM-CM6-1/r1i1p1f2, AWI-CM-1-1-MR/r1i1p1f1, CNRM-ESM2-1/r1i1p1f2, FGOALS-g3/r1i1p1f1, INM-CM5-0/r1i1p1f1, MRI-ESM2-0/r1i1p1f1 |
| Reference Dataset | ERA5 |
| Units | W/m2/decade |
| Period | 1980–2014 |
| CMIP6 MMM | Global Mean Trend Diff: 0.83 · Trend Rmse: None |
| MPI-ESM1-2-LR/r1i1p1f1 | Global Mean Trend Diff: 0.35 · Trend Rmse: None |
| GISS-E2-1-G/r1i1p1f2 | Global Mean Trend Diff: 0.51 · Trend Rmse: None |
| IPSL-CM6A-LR/r1i1p1f1 | Global Mean Trend Diff: 0.84 · Trend Rmse: None |
| ACCESS-ESM1-5/r1i1p1f1 | Global Mean Trend Diff: 1.35 · Trend Rmse: None |
| EC-Earth3/r1i1p1f1 | Global Mean Trend Diff: 1.76 · Trend Rmse: None |
| CNRM-CM6-1/r1i1p1f2 | Global Mean Trend Diff: 0.44 · Trend Rmse: None |
| AWI-CM-1-1-MR/r1i1p1f1 | Global Mean Trend Diff: 0.97 · Trend Rmse: None |
| CNRM-ESM2-1/r1i1p1f2 | Global Mean Trend Diff: 0.76 · Trend Rmse: None |
| FGOALS-g3/r1i1p1f1 | Global Mean Trend Diff: 0.91 · Trend Rmse: None |
| INM-CM5-0/r1i1p1f1 | Global Mean Trend Diff: 0.61 · Trend Rmse: None |
| MRI-ESM2-0/r1i1p1f1 | Global Mean Trend Diff: 0.66 · Trend Rmse: None |
Summary high
This figure evaluates the linear trend (1980–2014) of surface downwelling longwave radiation (rlds) in DJF, comparing ERA5 reanalysis with high-resolution EERIE models (IFS, ICON) and a suite of CMIP6 models. The panels show the ERA5 trend and the difference (bias) between each model's trend and ERA5.
Key Findings
- ERA5 displays distinct regional cooling trends (blue) over Siberia and the Eastern Equatorial Pacific, with strong warming (red) in the Arctic.
- Almost all models exhibit a systematic positive trend bias (red difference maps), indicating they simulate a widespread increase in downwelling longwave radiation that exceeds the observed trends.
- The largest discrepancies occur over Northern Hemisphere continents (Eurasia, North America) and the Arctic, where models consistently overestimate the trend compared to ERA5.
- The high-resolution models (IFS-FESOM2-SR, IFS-NEMO-ER, ICON-ESM-ER) show bias patterns very similar to the CMIP6 Multi-Model Mean, suggesting increased resolution does not automatically resolve these trend discrepancies.
Spatial Patterns
In ERA5, the period is characterized by negative trends in the Eastern Pacific (La Niña-like pattern) and Eurasia. In the bias maps, these regions appear as strong positive anomalies because the models simulate generic warming (greenhouse forcing) rather than the specific cooling phases of internal variability observed. The Arctic shows a positive bias, implying model amplification exceeds that in ERA5.
Model Agreement
There is high inter-model agreement regarding the sign of the bias; nearly every model shows a global mean positive trend difference (ranging from +0.35 to +1.76 W/m²/decade). EC-Earth3 and ACCESS-ESM1-5 have the strongest positive biases, while MPI-ESM1-2-LR aligns closest to the observational mean trend.
Physical Interpretation
Surface downwelling longwave radiation is primarily driven by atmospheric temperature, water vapor, and cloud cover. The positive bias suggests models are warming the surface and lower atmosphere faster than observed during this period. Much of this discrepancy is likely due to internal climate variability: the observed 1980-2014 period included phases of the IPO and AO/NAO that caused regional cooling (e.g., in the Pacific and Siberia) which free-running, uninitialized coupled models do not reproduce in phase. Consequently, the models' forced warming signal contrasts with the observations' mixed forced-plus-internal signal.
Caveats
- The analysis period (1980-2014) is relatively short, making trends highly susceptible to multi-decadal internal variability (e.g., PDO/IPO).
- Comparisons are against ERA5 reanalysis; while robust, reanalysis trends in radiative fluxes can carry uncertainties from the underlying assimilation model.
Surface Downwelling Longwave JJA Linear Trend
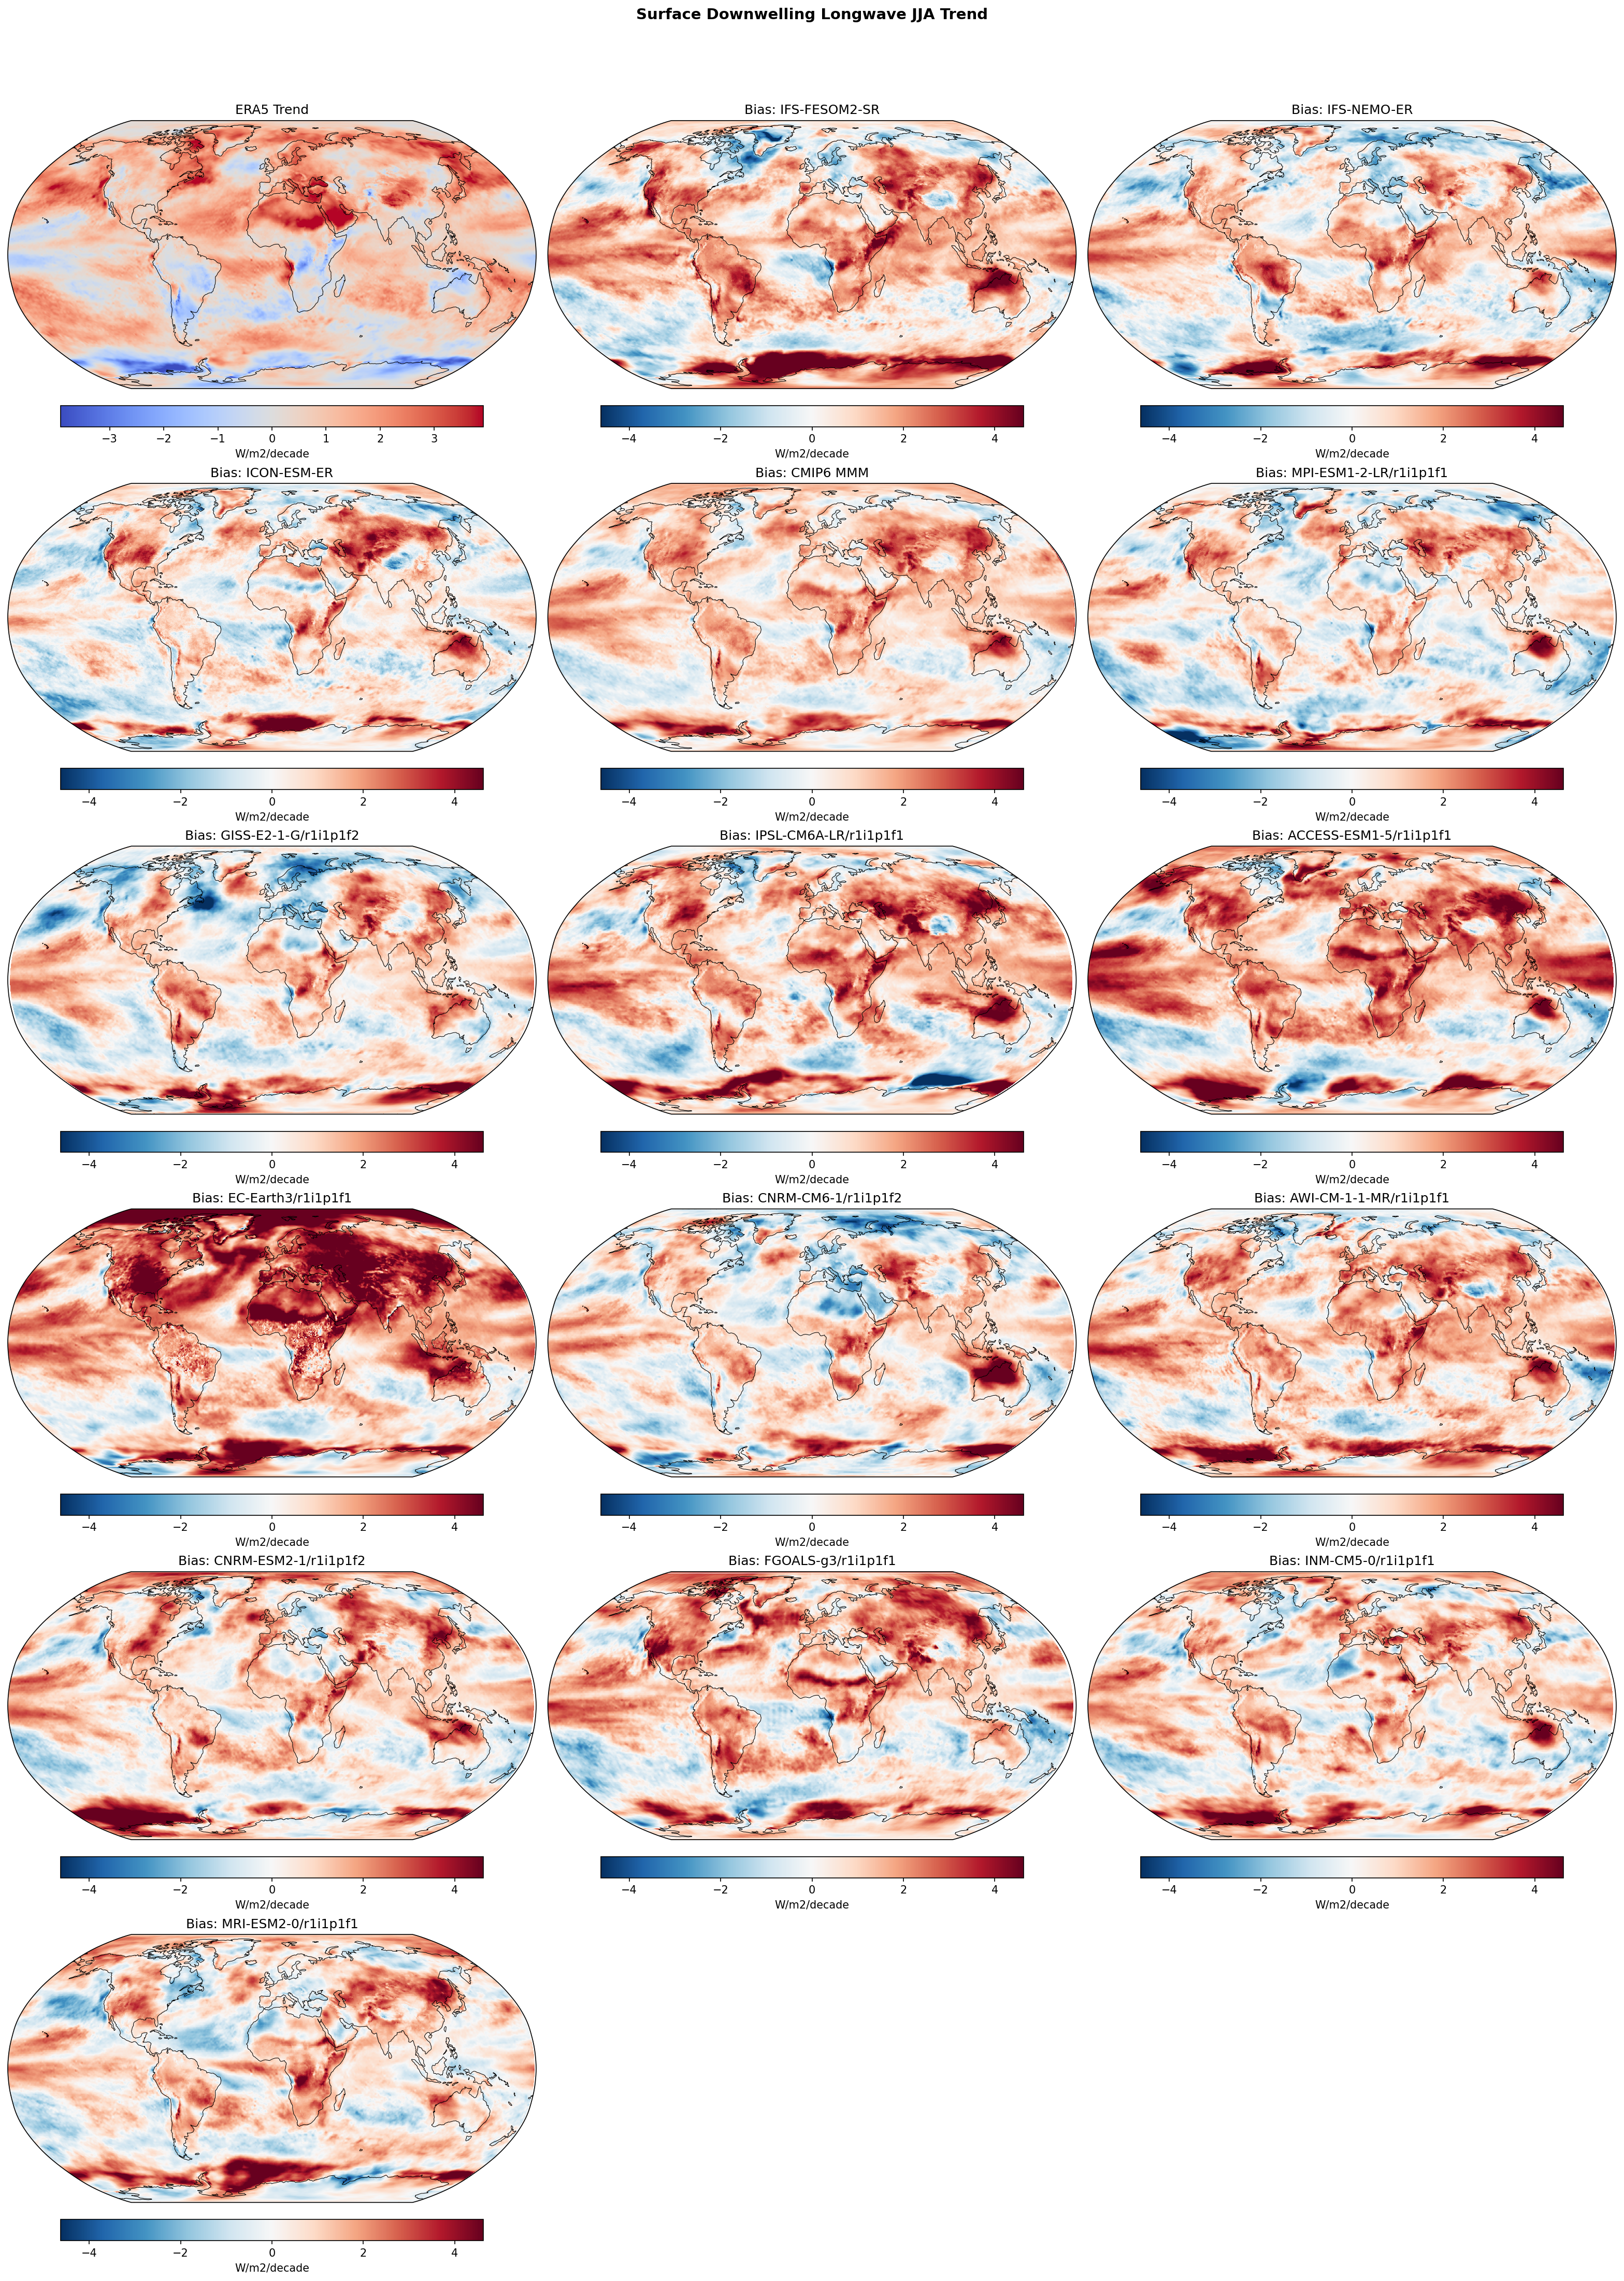
| Variables | rlds |
|---|---|
| Models | IFS-FESOM2-SR, IFS-NEMO-ER, ICON-ESM-ER, CMIP6 MMM, MPI-ESM1-2-LR/r1i1p1f1, GISS-E2-1-G/r1i1p1f2, IPSL-CM6A-LR/r1i1p1f1, ACCESS-ESM1-5/r1i1p1f1, EC-Earth3/r1i1p1f1, CNRM-CM6-1/r1i1p1f2, AWI-CM-1-1-MR/r1i1p1f1, CNRM-ESM2-1/r1i1p1f2, FGOALS-g3/r1i1p1f1, INM-CM5-0/r1i1p1f1, MRI-ESM2-0/r1i1p1f1 |
| Reference Dataset | ERA5 |
| Units | W/m2/decade |
| Period | 1980–2014 |
| CMIP6 MMM | Global Mean Trend Diff: 0.87 · Trend Rmse: None |
| MPI-ESM1-2-LR/r1i1p1f1 | Global Mean Trend Diff: 0.34 · Trend Rmse: None |
| GISS-E2-1-G/r1i1p1f2 | Global Mean Trend Diff: 0.44 · Trend Rmse: None |
| IPSL-CM6A-LR/r1i1p1f1 | Global Mean Trend Diff: 1.04 · Trend Rmse: None |
| ACCESS-ESM1-5/r1i1p1f1 | Global Mean Trend Diff: 1.31 · Trend Rmse: None |
| EC-Earth3/r1i1p1f1 | Global Mean Trend Diff: 1.88 · Trend Rmse: None |
| CNRM-CM6-1/r1i1p1f2 | Global Mean Trend Diff: 0.48 · Trend Rmse: None |
| AWI-CM-1-1-MR/r1i1p1f1 | Global Mean Trend Diff: 1.01 · Trend Rmse: None |
| CNRM-ESM2-1/r1i1p1f2 | Global Mean Trend Diff: 0.77 · Trend Rmse: None |
| FGOALS-g3/r1i1p1f1 | Global Mean Trend Diff: 0.94 · Trend Rmse: None |
| INM-CM5-0/r1i1p1f1 | Global Mean Trend Diff: 0.72 · Trend Rmse: None |
| MRI-ESM2-0/r1i1p1f1 | Global Mean Trend Diff: 0.62 · Trend Rmse: None |
Summary high
This diagnostic evaluates the linear trend in Surface Downwelling Longwave Radiation (JJA, 1980–2014) relative to ERA5. Most models, including the high-resolution EERIE simulations and the CMIP6 Multi-Model Mean, exhibit a systematic positive trend bias, indicating they simulate a more rapid increase in downwelling longwave radiation than observed, particularly over Northern Hemisphere land.
Key Findings
- Systematic positive trend biases dominate most models, meaning they overestimate the decadal increase in surface downwelling longwave radiation compared to ERA5.
- The strongest biases (>2-4 W/m²/decade) occur over Northern Hemisphere continental interiors (Eurasia, North America) and North Africa, coinciding with the summer season (JJA).
- High-sensitivity CMIP6 models (e.g., EC-Earth3, ACCESS-ESM1-5) show the most severe widespread positive biases, while lower-sensitivity models (MPI-ESM1-2-LR, MRI-ESM2-0) show much closer agreement with observations.
- The EERIE high-resolution models (IFS-FESOM2-SR, IFS-NEMO-ER, ICON-ESM-ER) display bias patterns similar to the CMIP6 ensemble, suggesting that increased resolution does not automatically correct the tendency to overestimate surface longwave warming trends.
Spatial Patterns
ERA5 shows moderate positive trends (0–2 W/m²/decade) over NH land and the Arctic. The models generally exaggerate this, showing 'red' bias maps. Notable hotspots for positive bias include the Sahara, Middle East, and Central Asia. The Southern Ocean also shows positive trend biases in models where ERA5 indicates cooling or neutral trends. Conversely, the Tropical Pacific shows negative trend biases in IFS variants and some CMIP6 models, indicating a failure to capture observed warming or an overestimation of cooling trends in that region.
Model Agreement
There is broad inter-model agreement on the sign of the bias (positive over land). The IFS-FESOM2-SR and IFS-NEMO-ER simulations are nearly identical, confirming that atmospheric formulation (IFS) dictates the rlds trend rather than the ocean component. EC-Earth3 is an outlier with the highest global mean trend difference (1.88 W/m²/decade), while MPI-ESM1-2-LR has the lowest (0.34 W/m²/decade).
Physical Interpretation
Surface downwelling longwave radiation is primarily driven by lower tropospheric temperature and water vapor (greenhouse effect). The widespread positive trend biases imply that models are warming the lower atmosphere and/or moistening it at a faster rate than ERA5 over the 1980–2014 period. This aligns with the known higher equilibrium climate sensitivity (ECS) of several CMIP6 models (like EC-Earth3), leading to accelerated historical warming rates. The land-focused biases in JJA suggests potential issues with land-atmosphere feedbacks (e.g., excessive drying leading to higher temperatures) or cloud cover trends.
Caveats
- Trends over a 35-year period (1980–2014) are influenced by internal variability (e.g., ENSO, IPO); coupled models are not expected to reproduce the specific phase of internal variability seen in observations, potentially contributing to regional mismatches (e.g., Tropical Pacific).
- ERA5 trends may contain artifacts from changes in the global observing system (satellite assimilation) over the period.
Surface Downwelling Shortwave Annual Linear Trend
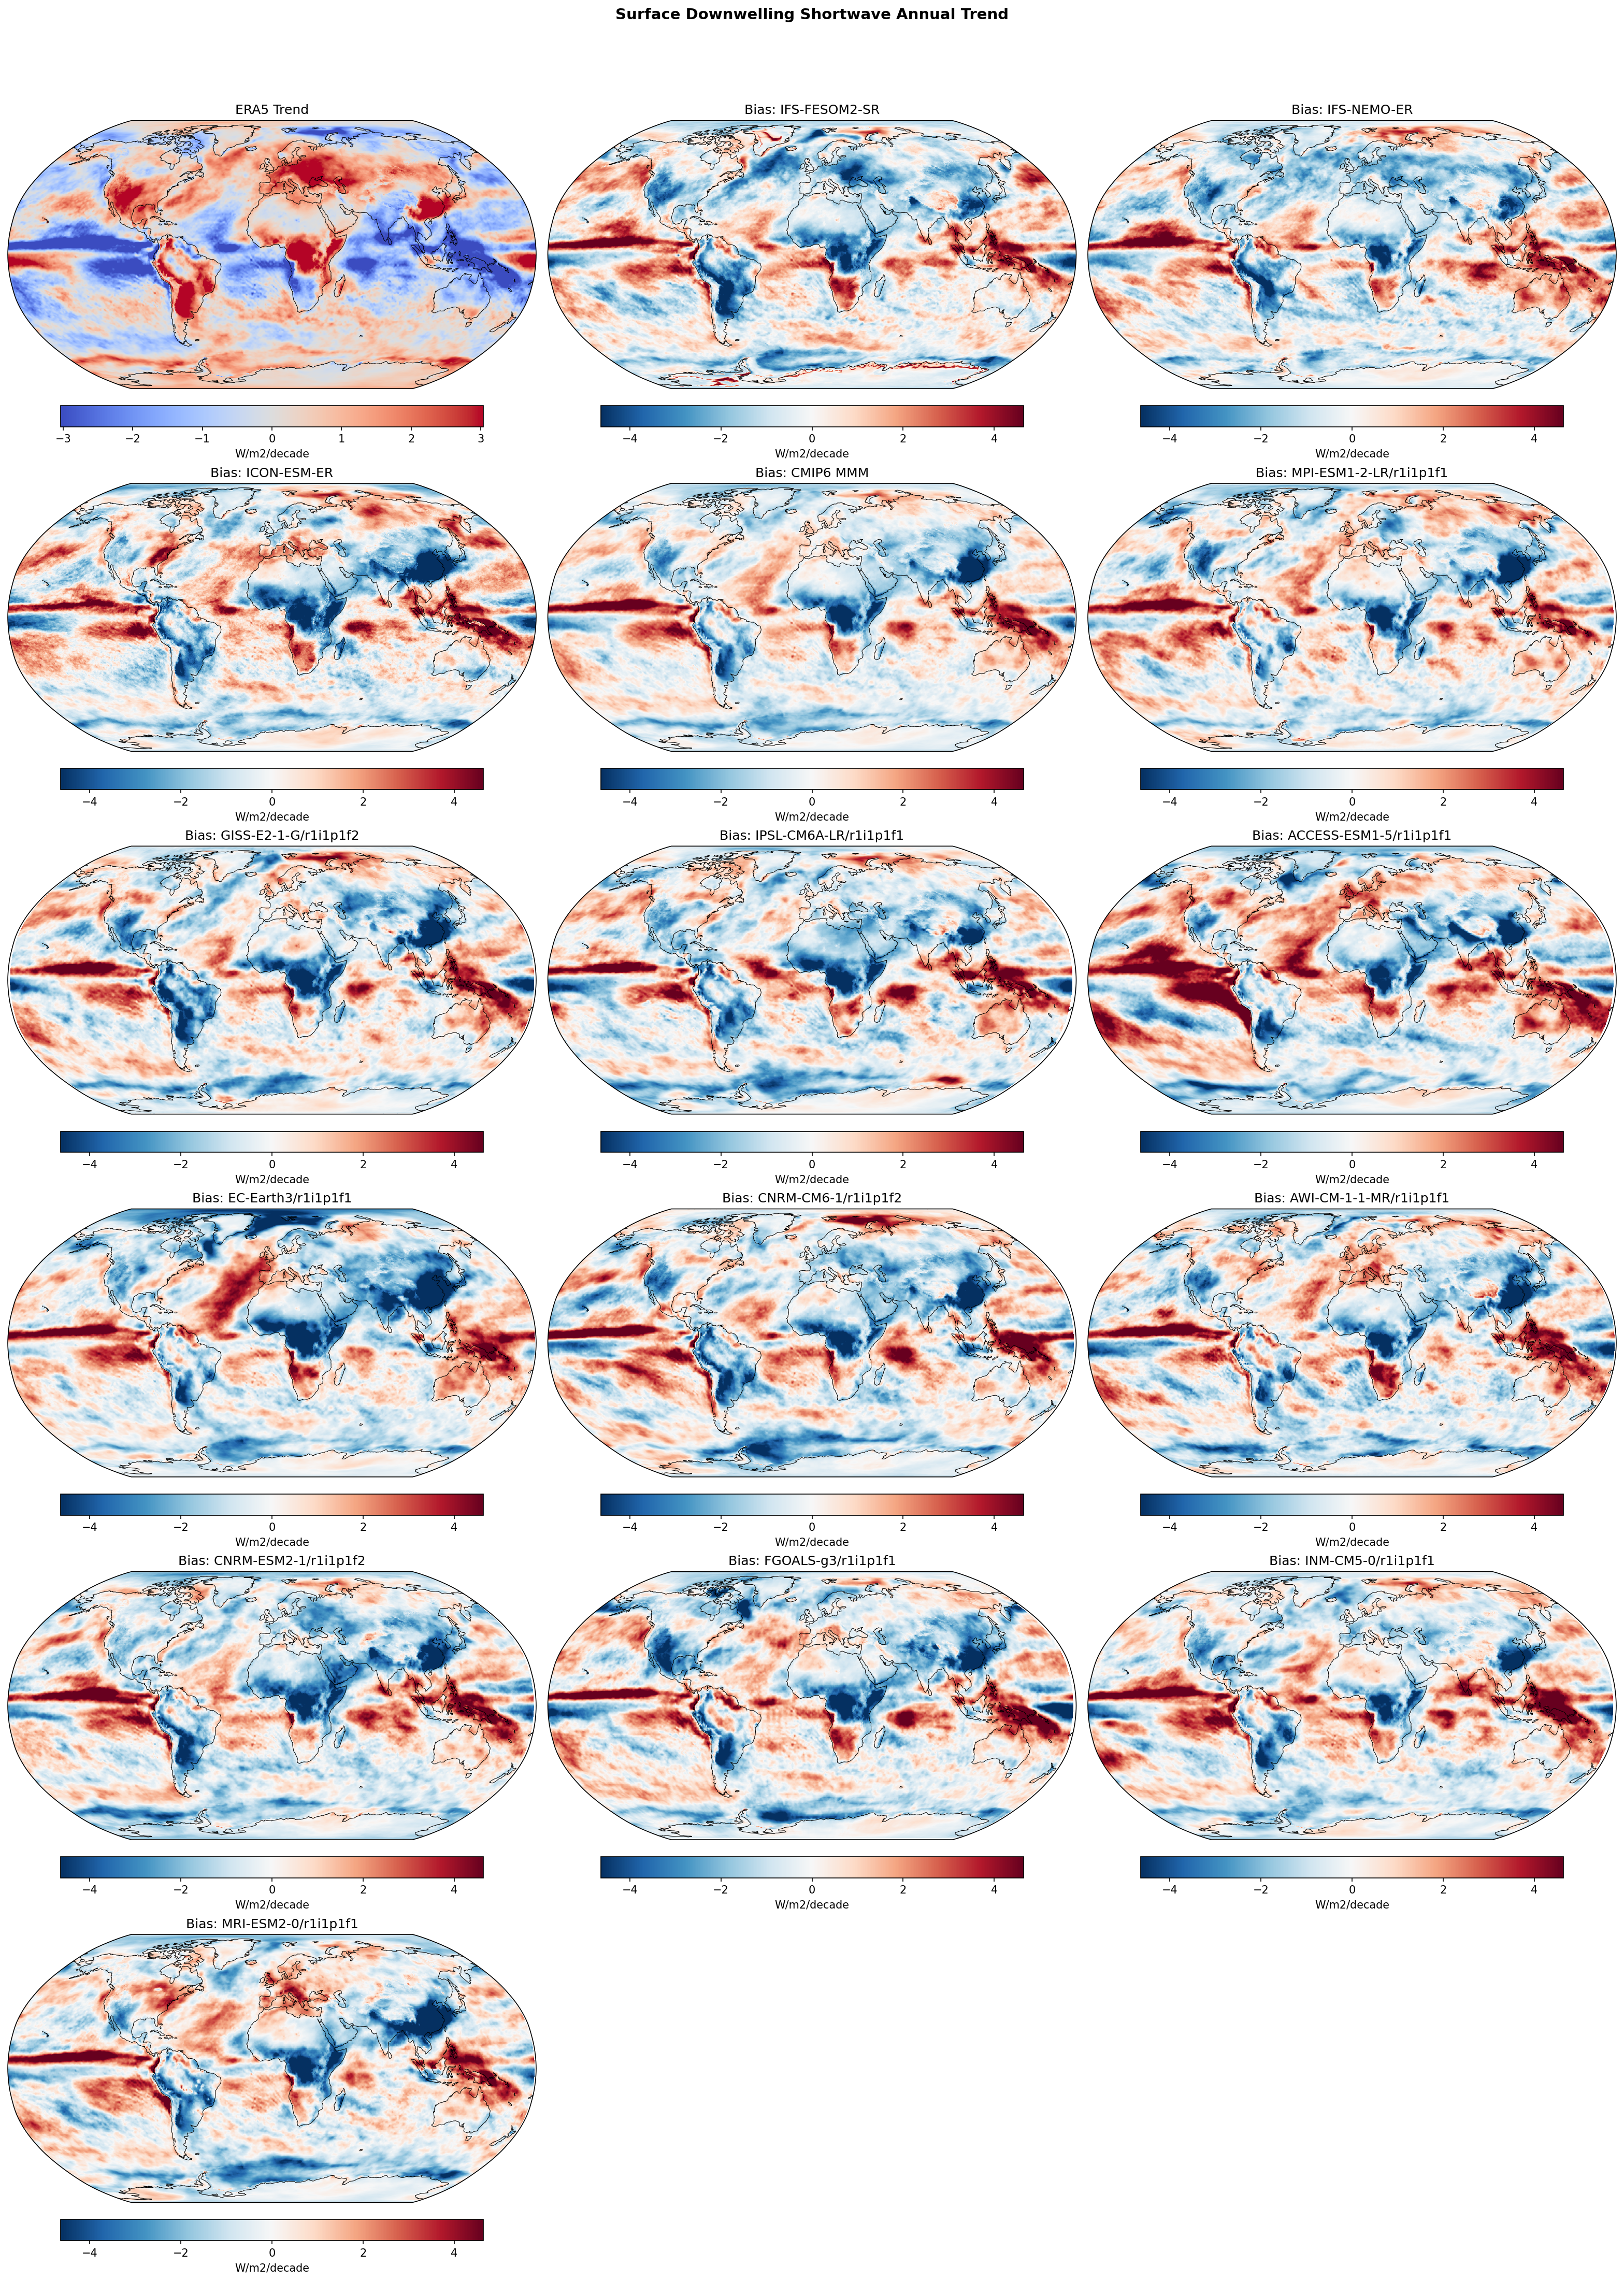
| Variables | rsds |
|---|---|
| Models | IFS-FESOM2-SR, IFS-NEMO-ER, ICON-ESM-ER, CMIP6 MMM, MPI-ESM1-2-LR/r1i1p1f1, GISS-E2-1-G/r1i1p1f2, IPSL-CM6A-LR/r1i1p1f1, ACCESS-ESM1-5/r1i1p1f1, EC-Earth3/r1i1p1f1, CNRM-CM6-1/r1i1p1f2, AWI-CM-1-1-MR/r1i1p1f1, CNRM-ESM2-1/r1i1p1f2, FGOALS-g3/r1i1p1f1, INM-CM5-0/r1i1p1f1, MRI-ESM2-0/r1i1p1f1 |
| Reference Dataset | ERA5 |
| Units | W/m2/decade |
| Period | 1980–2014 |
| IFS-FESOM2-SR | Global Mean Trend: -0.16 · Global Mean Trend Diff: -0.08 · Trend Rmse: 1.79 |
| IFS-NEMO-ER | Global Mean Trend: -0.18 · Global Mean Trend Diff: -0.10 · Trend Rmse: 1.69 |
| ICON-ESM-ER | Global Mean Trend: -0.12 · Global Mean Trend Diff: -0.04 · Trend Rmse: 1.92 |
| CMIP6 MMM | Global Mean Trend Diff: -0.06 · Trend Rmse: 1.65 |
| MPI-ESM1-2-LR/r1i1p1f1 | Global Mean Trend Diff: 0.02 · Trend Rmse: 1.69 |
| GISS-E2-1-G/r1i1p1f2 | Global Mean Trend Diff: -0.12 · Trend Rmse: 1.89 |
| IPSL-CM6A-LR/r1i1p1f1 | Global Mean Trend Diff: -0.15 · Trend Rmse: 1.83 |
| ACCESS-ESM1-5/r1i1p1f1 | Global Mean Trend Diff: 0.27 · Trend Rmse: 2.15 |
| EC-Earth3/r1i1p1f1 | Global Mean Trend Diff: -0.19 · Trend Rmse: 2.02 |
| CNRM-CM6-1/r1i1p1f2 | Global Mean Trend Diff: -0.10 · Trend Rmse: 1.93 |
| AWI-CM-1-1-MR/r1i1p1f1 | Global Mean Trend Diff: -0.07 · Trend Rmse: 1.85 |
| CNRM-ESM2-1/r1i1p1f2 | Global Mean Trend Diff: -0.18 · Trend Rmse: 1.84 |
| FGOALS-g3/r1i1p1f1 | Global Mean Trend Diff: -0.11 · Trend Rmse: 1.92 |
| INM-CM5-0/r1i1p1f1 | Global Mean Trend Diff: 0.12 · Trend Rmse: 1.82 |
| MRI-ESM2-0/r1i1p1f1 | Global Mean Trend Diff: -0.10 · Trend Rmse: 1.86 |
Summary high
This diagnostic evaluates the 1980–2014 linear trend in surface downwelling shortwave radiation, revealing that both high-resolution EERIE models and standard CMIP6 models systematically underestimate the observed 'brightening' over Europe and 'dimming' in the Tropical Pacific.
Key Findings
- Systematic underestimation of European brightening: ERA5 shows a strong positive trend (+1 to +3 W/m²/decade) over Europe, likely due to aerosol reductions, while all models exhibit a negative bias (predicting weaker or no brightening).
- Tropical Pacific trend mismatch: ERA5 displays a negative trend (dimming) in the equatorial Pacific, consistent with La Niña-like cooling and increased cloudiness. Models show a positive bias here, indicating a failure to capture this circulation-driven cloud response.
- Resolution does not resolve trend biases: The bias patterns in high-resolution IFS and ICON models are strikingly similar to the CMIP6 Multi-Model Mean and standard resolution models, suggesting these errors are driven by forcing or internal variability phasing rather than grid scale.
Spatial Patterns
ERA5 shows distinct regional trends: widespread brightening over Europe/Mediterranean and dimming over the Tropical Pacific and parts of East Asia. The model bias maps are dominated by a dipole structure: negative biases (blue) over Europe/North Atlantic and positive biases (red) over the Tropical Pacific. Biases reach magnitudes of ±2-4 W/m²/decade, comparable to the trends themselves.
Model Agreement
There is high consistency in the error patterns across all models. Whether high-resolution (IFS-NEMO-ER, ICON-ESM-ER) or standard CMIP6 (MPI-ESM, IPSL-CM6), models universally struggle to reproduce the magnitude of European brightening and the sign of the Pacific trend. The CMIP6 MMM provides the lowest RMSE (1.65), but IFS-NEMO-ER is competitive (1.69).
Physical Interpretation
The bias over Europe is likely linked to the representation of aerosol radiative forcing; models may underestimate the magnitude of surface brightening resulting from the post-1980 decline in anthropogenic aerosols (direct and indirect effects). The Pacific discrepancy is attributed to internal decadal variability (e.g., IPO/PDO): the real world experienced a strengthening Walker circulation (more low clouds/dimming) during this period, while free-running coupled models do not phase-lock to this specific historical trajectory and often simulate mean-state warming (El Niño-like) instead.
Caveats
- Comparisons of decadal trends in free-running coupled models are limited by internal variability; models are not expected to match the phase of natural cycles (like the IPO) seen in observations.
- ERA5 is a reanalysis product; while it assimilates observations, its representation of long-term aerosol trends and cloud interactions carries its own uncertainties.
Surface Downwelling Shortwave DJF Linear Trend
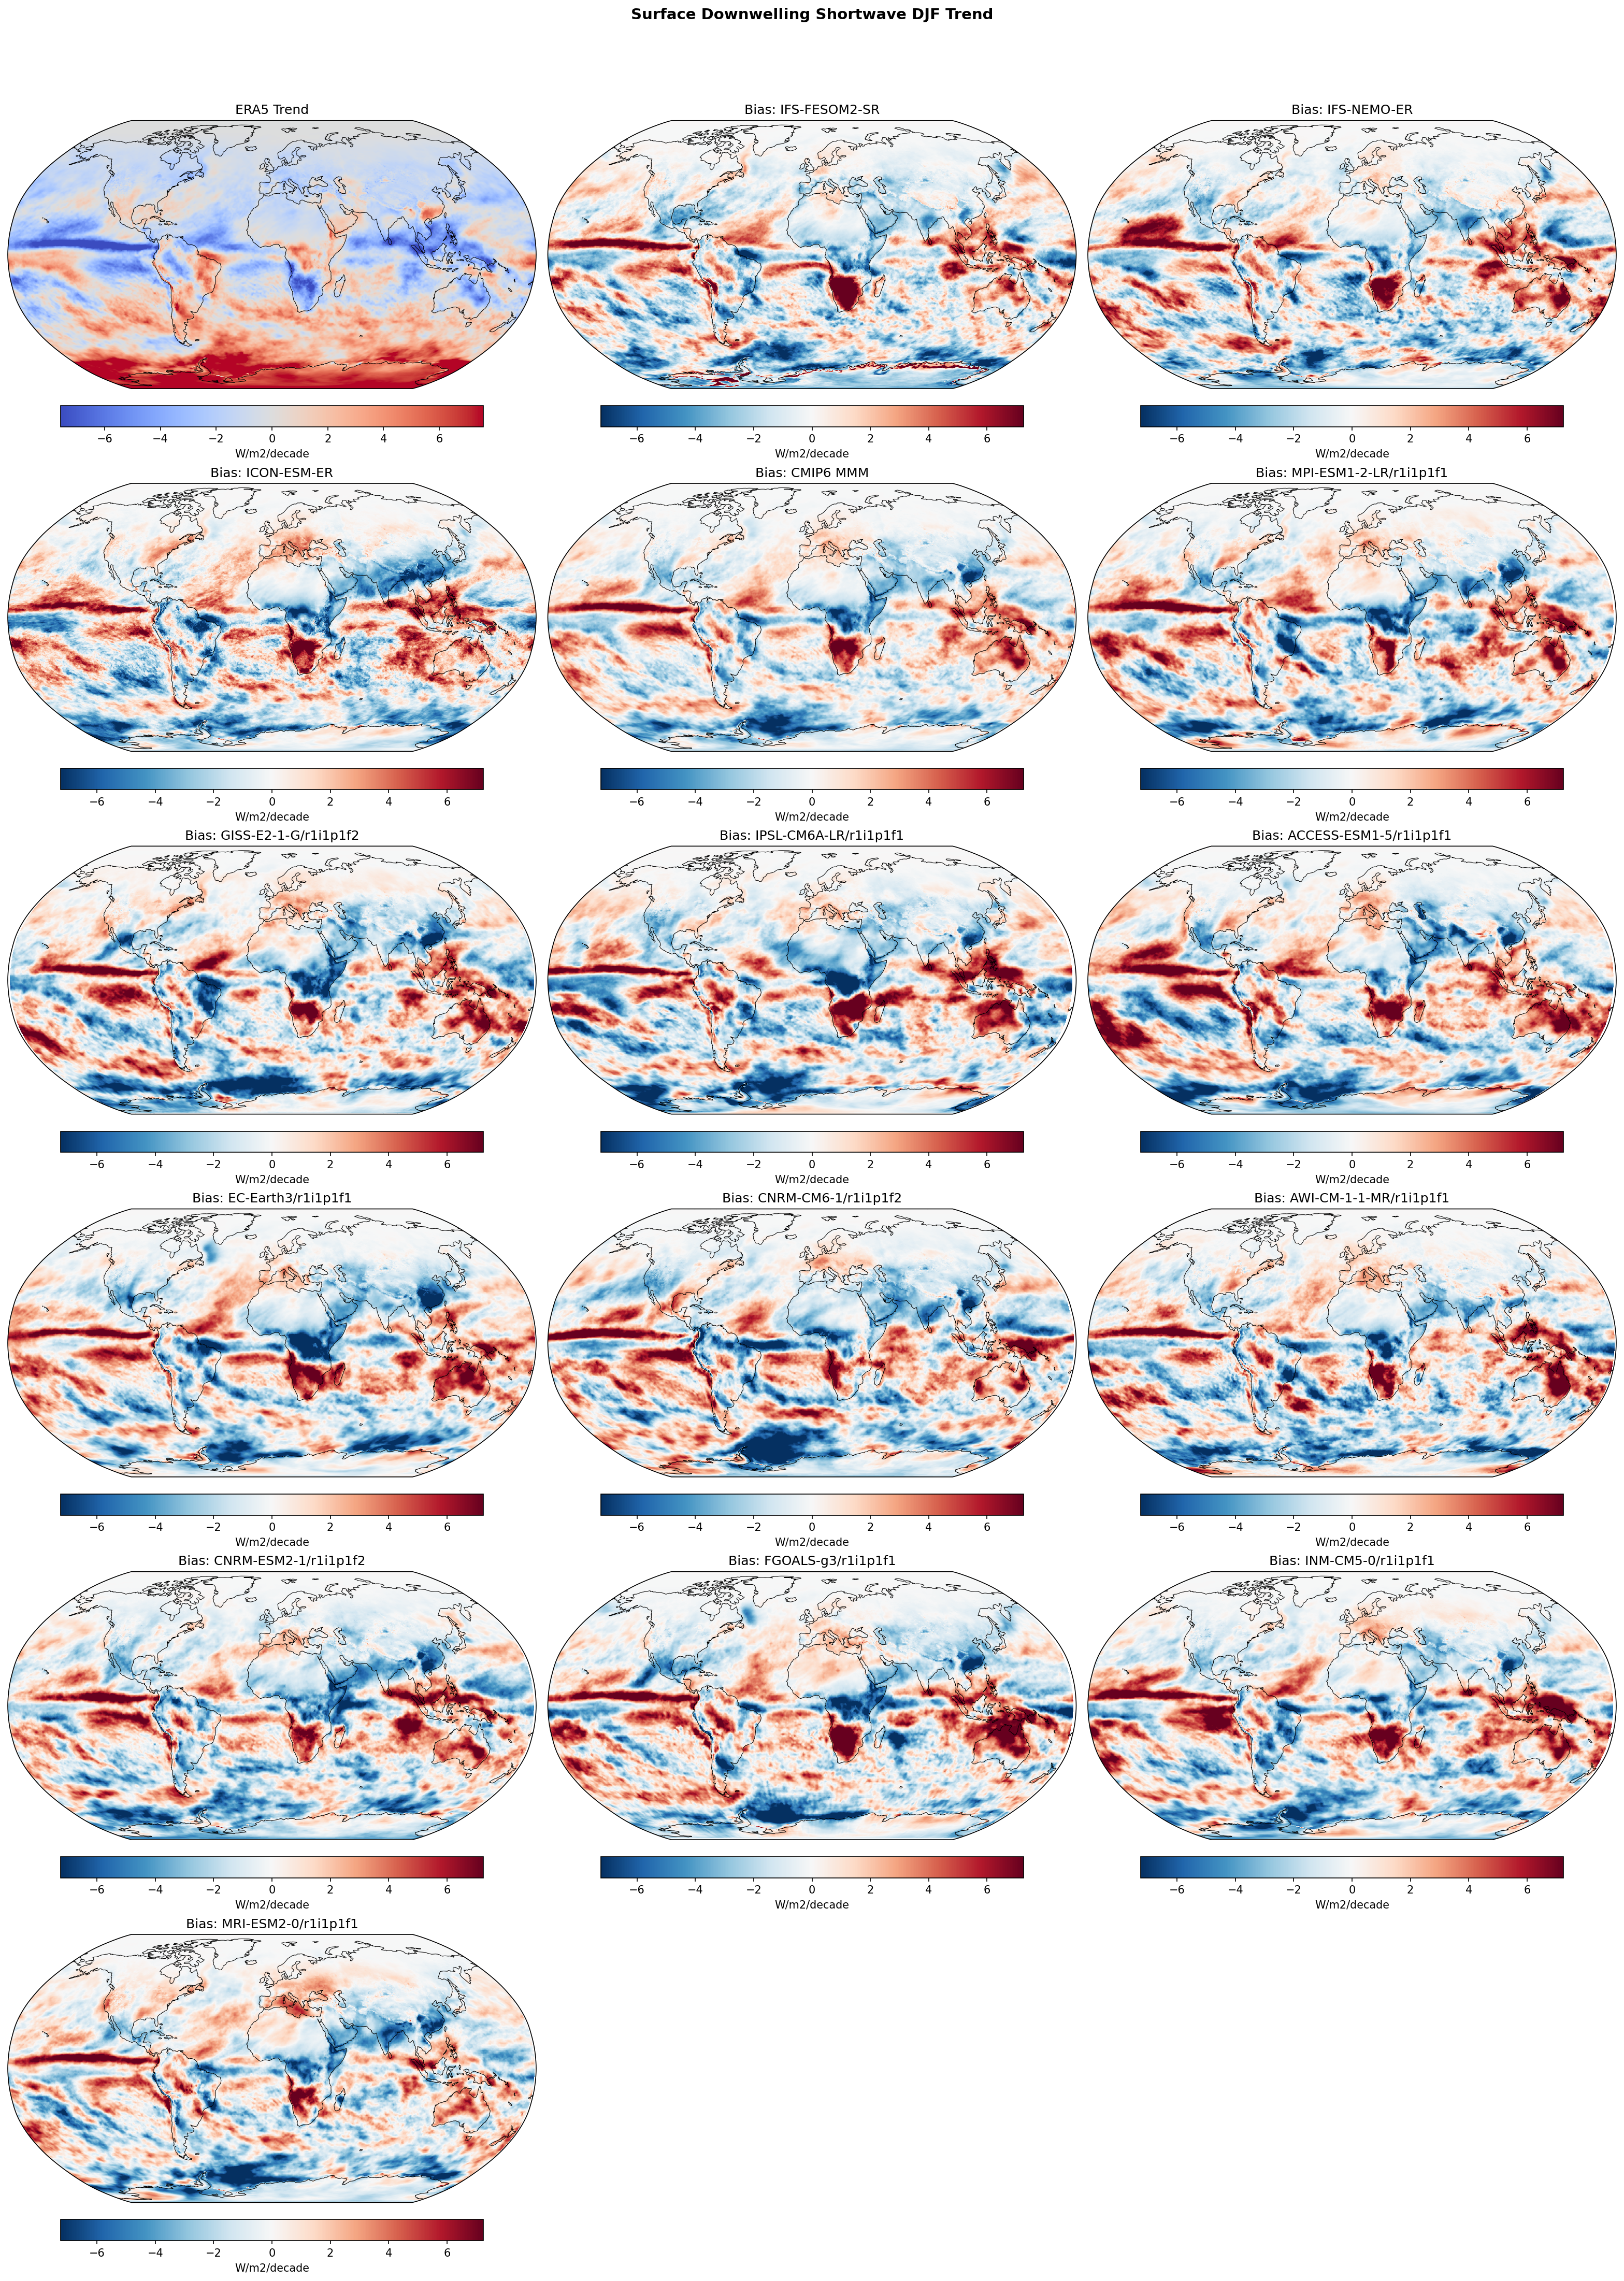
| Variables | rsds |
|---|---|
| Models | IFS-FESOM2-SR, IFS-NEMO-ER, ICON-ESM-ER, CMIP6 MMM, MPI-ESM1-2-LR/r1i1p1f1, GISS-E2-1-G/r1i1p1f2, IPSL-CM6A-LR/r1i1p1f1, ACCESS-ESM1-5/r1i1p1f1, EC-Earth3/r1i1p1f1, CNRM-CM6-1/r1i1p1f2, AWI-CM-1-1-MR/r1i1p1f1, CNRM-ESM2-1/r1i1p1f2, FGOALS-g3/r1i1p1f1, INM-CM5-0/r1i1p1f1, MRI-ESM2-0/r1i1p1f1 |
| Reference Dataset | ERA5 |
| Units | W/m2/decade |
| Period | 1980–2014 |
| CMIP6 MMM | Global Mean Trend Diff: -0.01 · Trend Rmse: None |
| MPI-ESM1-2-LR/r1i1p1f1 | Global Mean Trend Diff: 0.07 · Trend Rmse: None |
| GISS-E2-1-G/r1i1p1f2 | Global Mean Trend Diff: -0.10 · Trend Rmse: None |
| IPSL-CM6A-LR/r1i1p1f1 | Global Mean Trend Diff: -0.11 · Trend Rmse: None |
| ACCESS-ESM1-5/r1i1p1f1 | Global Mean Trend Diff: 0.20 · Trend Rmse: None |
| EC-Earth3/r1i1p1f1 | Global Mean Trend Diff: 0.02 · Trend Rmse: None |
| CNRM-CM6-1/r1i1p1f2 | Global Mean Trend Diff: -0.09 · Trend Rmse: None |
| AWI-CM-1-1-MR/r1i1p1f1 | Global Mean Trend Diff: -0.07 · Trend Rmse: None |
| CNRM-ESM2-1/r1i1p1f2 | Global Mean Trend Diff: -0.14 · Trend Rmse: None |
| FGOALS-g3/r1i1p1f1 | Global Mean Trend Diff: 0.14 · Trend Rmse: None |
| INM-CM5-0/r1i1p1f1 | Global Mean Trend Diff: 0.16 · Trend Rmse: None |
| MRI-ESM2-0/r1i1p1f1 | Global Mean Trend Diff: -0.17 · Trend Rmse: None |
Summary high
This figure evaluates the linear trend (1980–2014) of DJF surface downwelling shortwave radiation (RSDS) in high-resolution EERIE models (IFS, ICON) and CMIP6 models compared to ERA5. The comparison reveals systematic biases in radiative trends that persist despite increased model resolution.
Key Findings
- A strong positive trend bias (red) dominates the Tropical Pacific ITCZ region in all models (EERIE and CMIP6), indicating they simulate surface brightening or fail to capture the observed dimming (negative trend) seen in ERA5.
- A widespread negative trend bias (blue) is observed over the Southern Ocean, implying models underestimate the strong surface brightening (positive trend) found in ERA5.
- The high-resolution models (IFS-FESOM2-SR, IFS-NEMO-ER, ICON-ESM-ER) exhibit bias patterns remarkably similar to the standard-resolution CMIP6 Multi-Model Mean (MMM), suggesting that resolution alone does not resolve these decadal trend discrepancies.
Spatial Patterns
ERA5 shows a distinct 'dimming' (negative trend) in the central/eastern Tropical Pacific and 'brightening' (positive trend) in the Southern Ocean. The model bias maps are inverse to these features: they show positive biases along the equator (Pacific and Atlantic) and negative biases in the Southern Ocean. Additionally, IFS models show a notable positive trend bias in the Southeast Atlantic stratocumulus region.
Model Agreement
There is high inter-model agreement regarding the spatial structure of the biases. Both the specific high-resolution EERIE simulations and the broader CMIP6 ensemble share the same systematic errors in the Tropical Pacific and Southern Ocean, indicating a common structural deficiency or forcing response issue across generations of models.
Physical Interpretation
The Tropical Pacific bias is likely linked to the 'pattern effect' or SST trend mismatches: observations show a La Niña-like cooling trend and strengthened Walker circulation (increased convection/clouds in the west/central Pacific), while coupled models often simulate more uniform warming or El Niño-like trends, resulting in underestimated cloudiness (and thus overestimated surface SW). The Southern Ocean bias suggests models fail to capture the observed reduction in cloud cover or optical depth, possibly due to errors in cloud phase feedbacks (ice vs. liquid) or jet stream shifts.
Caveats
- Trends are calculated over a 35-year period (1980-2014), which is subject to internal climate variability (e.g., IPO phase); free-running coupled models are not expected to reproduce the specific phase of internal variability, though the ubiquity of the bias suggests a systematic error.
- ERA5 is a reanalysis product; while it assimilates satellite data, trends in the presatellite or early-satellite era can carry uncertainties.
Surface Downwelling Shortwave JJA Linear Trend
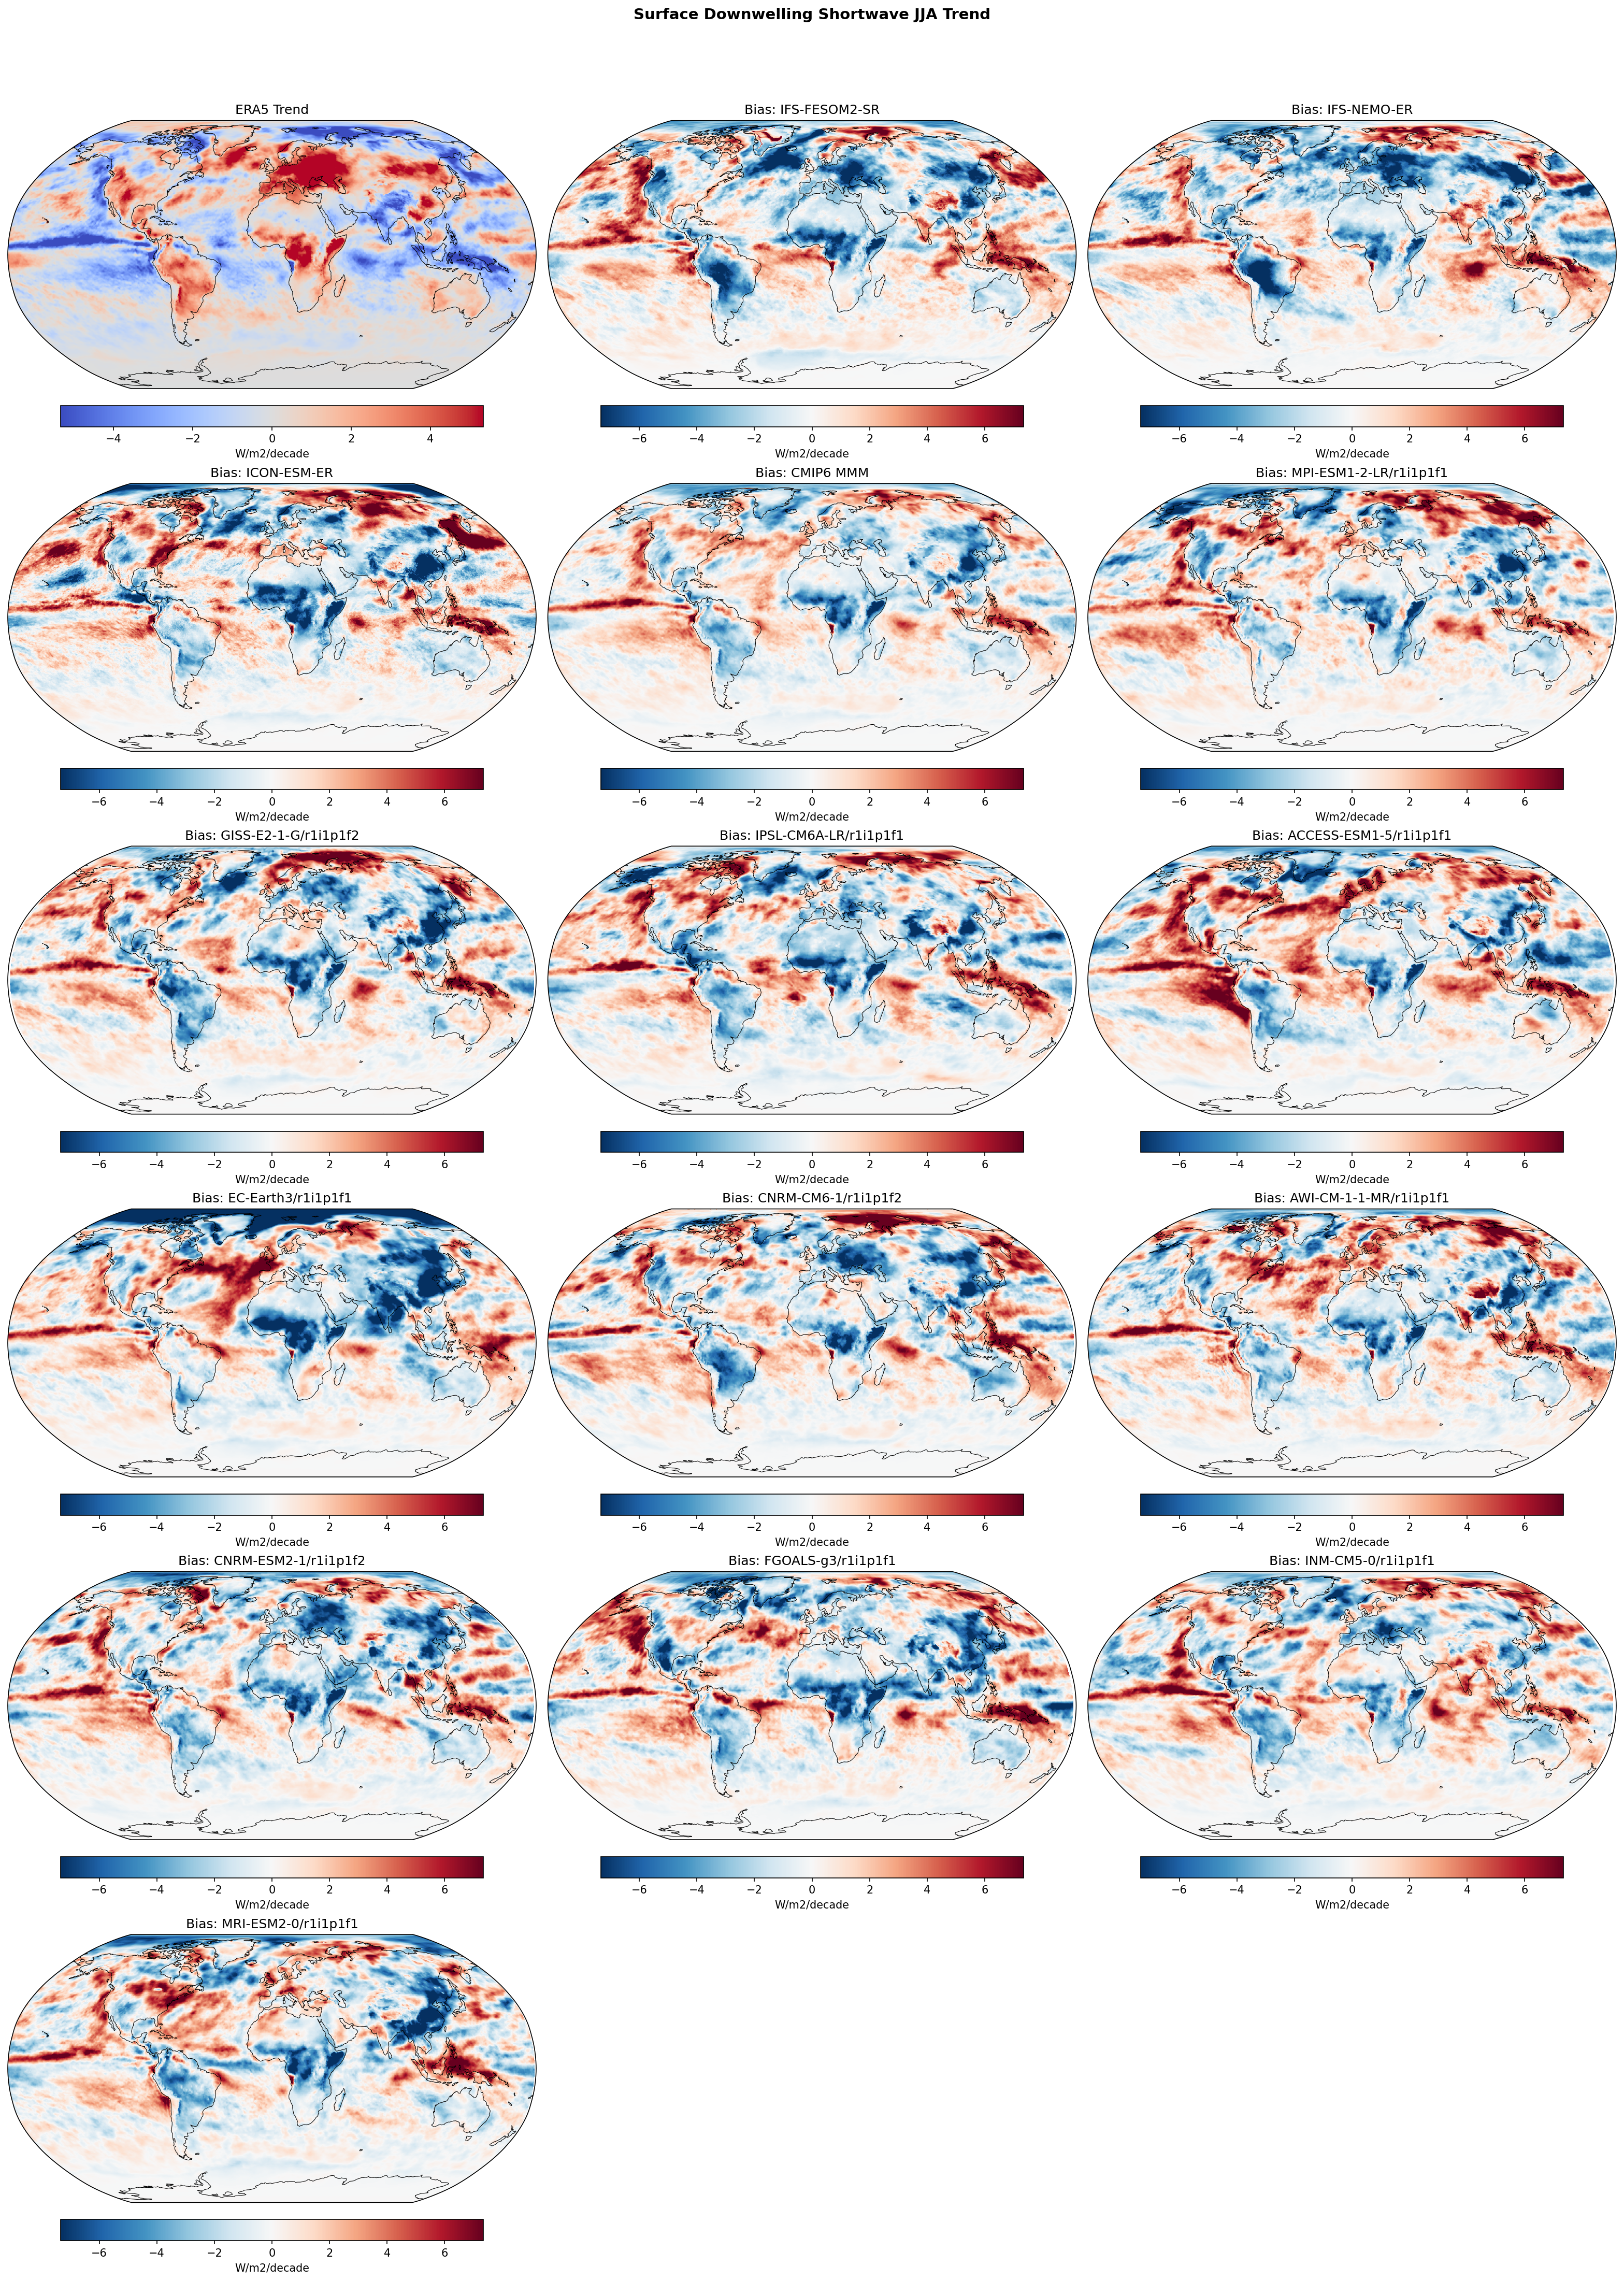
| Variables | rsds |
|---|---|
| Models | IFS-FESOM2-SR, IFS-NEMO-ER, ICON-ESM-ER, CMIP6 MMM, MPI-ESM1-2-LR/r1i1p1f1, GISS-E2-1-G/r1i1p1f2, IPSL-CM6A-LR/r1i1p1f1, ACCESS-ESM1-5/r1i1p1f1, EC-Earth3/r1i1p1f1, CNRM-CM6-1/r1i1p1f2, AWI-CM-1-1-MR/r1i1p1f1, CNRM-ESM2-1/r1i1p1f2, FGOALS-g3/r1i1p1f1, INM-CM5-0/r1i1p1f1, MRI-ESM2-0/r1i1p1f1 |
| Reference Dataset | ERA5 |
| Units | W/m2/decade |
| Period | 1980–2014 |
| CMIP6 MMM | Global Mean Trend Diff: -0.03 · Trend Rmse: None |
| MPI-ESM1-2-LR/r1i1p1f1 | Global Mean Trend Diff: 0.07 · Trend Rmse: None |
| GISS-E2-1-G/r1i1p1f2 | Global Mean Trend Diff: -0.05 · Trend Rmse: None |
| IPSL-CM6A-LR/r1i1p1f1 | Global Mean Trend Diff: -0.14 · Trend Rmse: None |
| ACCESS-ESM1-5/r1i1p1f1 | Global Mean Trend Diff: 0.37 · Trend Rmse: None |
| EC-Earth3/r1i1p1f1 | Global Mean Trend Diff: -0.26 · Trend Rmse: None |
| CNRM-CM6-1/r1i1p1f2 | Global Mean Trend Diff: -0.01 · Trend Rmse: None |
| AWI-CM-1-1-MR/r1i1p1f1 | Global Mean Trend Diff: 0.05 · Trend Rmse: None |
| CNRM-ESM2-1/r1i1p1f2 | Global Mean Trend Diff: -0.19 · Trend Rmse: None |
| FGOALS-g3/r1i1p1f1 | Global Mean Trend Diff: -0.14 · Trend Rmse: None |
| INM-CM5-0/r1i1p1f1 | Global Mean Trend Diff: 0.10 · Trend Rmse: None |
| MRI-ESM2-0/r1i1p1f1 | Global Mean Trend Diff: -0.09 · Trend Rmse: None |
Summary high
This figure compares JJA linear trends (1980–2014) in surface downwelling shortwave radiation (RSDS) from ERA5 observations against high-resolution EERIE models (IFS, ICON) and CMIP6 models. A dominant feature is the observed 'brightening' over Europe and the North Atlantic, which most models, including the high-resolution ones, significantly underestimate.
Key Findings
- ERA5 shows a strong positive trend (brightening, >2-4 W/m²/decade) in surface solar radiation over Europe and the North Atlantic during JJA, attributed to reduced aerosol emissions.
- IFS-FESOM2-SR, IFS-NEMO-ER, and ICON-ESM-ER all exhibit widespread negative trend biases (blue, -2 to -6 W/m²/decade) in the North Atlantic and Europe, indicating they simulate much weaker brightening than observed.
- The two IFS variants (FESOM and NEMO) show nearly identical trend bias patterns, suggesting atmospheric physics (clouds/aerosols) rather than ocean coupling drives these errors.
- In the Southern Ocean and North Pacific, ICON-ESM-ER shows a strong positive trend bias (red) relative to ERA5, implying excessive cloud clearing or sea ice loss leading to more absorbed solar radiation compared to observations.
Spatial Patterns
The observation panel (ERA5) is characterized by strong brightening in the Northern Hemisphere mid-latitudes (Europe, N. Atlantic) and dimming in parts of the tropical Pacific. The model difference maps are dominated by blue biases over the North Atlantic/Europe (underestimated trend) and mixed dipole biases in the tropics. ICON-ESM-ER distinctively shows strong positive trend biases over the Southern Ocean and North Pacific.
Model Agreement
There is high agreement among models (both high-res and CMIP6) in underestimating the North Atlantic/Europe brightening trend. IFS-FESOM2-SR and IFS-NEMO-ER are spatially very consistent. Inter-model spread is larger in the tropics and Southern Ocean, where internal variability (ENSO/PDO phasing) likely influences the 35-year trends.
Physical Interpretation
The widespread underestimation of the positive Shortwave trend over Europe likely reflects deficiencies in representing the magnitude of aerosol radiative forcing changes (dimming to brightening transition) or the cloud response to these aerosol reductions (aerosol-cloud interactions). Since the period 1980-2014 covers substantial aerosol cleanup in Europe, models may have too weak an indirect effect or incorrect baseline aerosol loads. Discrepancies in the Pacific are likely due to unforced internal variability (e.g., IPO/PDO phases) differing between the free-running coupled models and the observed history.
Caveats
- Trends over a 35-year period in coupled models are a mix of forced signal and internal variability; regional mismatch in the Pacific is expected and not necessarily a model flaw.
- The 'Bias' panels represent (Model Trend - Obs Trend); a blue bias means the model trend is less positive (or more negative) than ERA5.
2m Temperature Annual Linear Trend
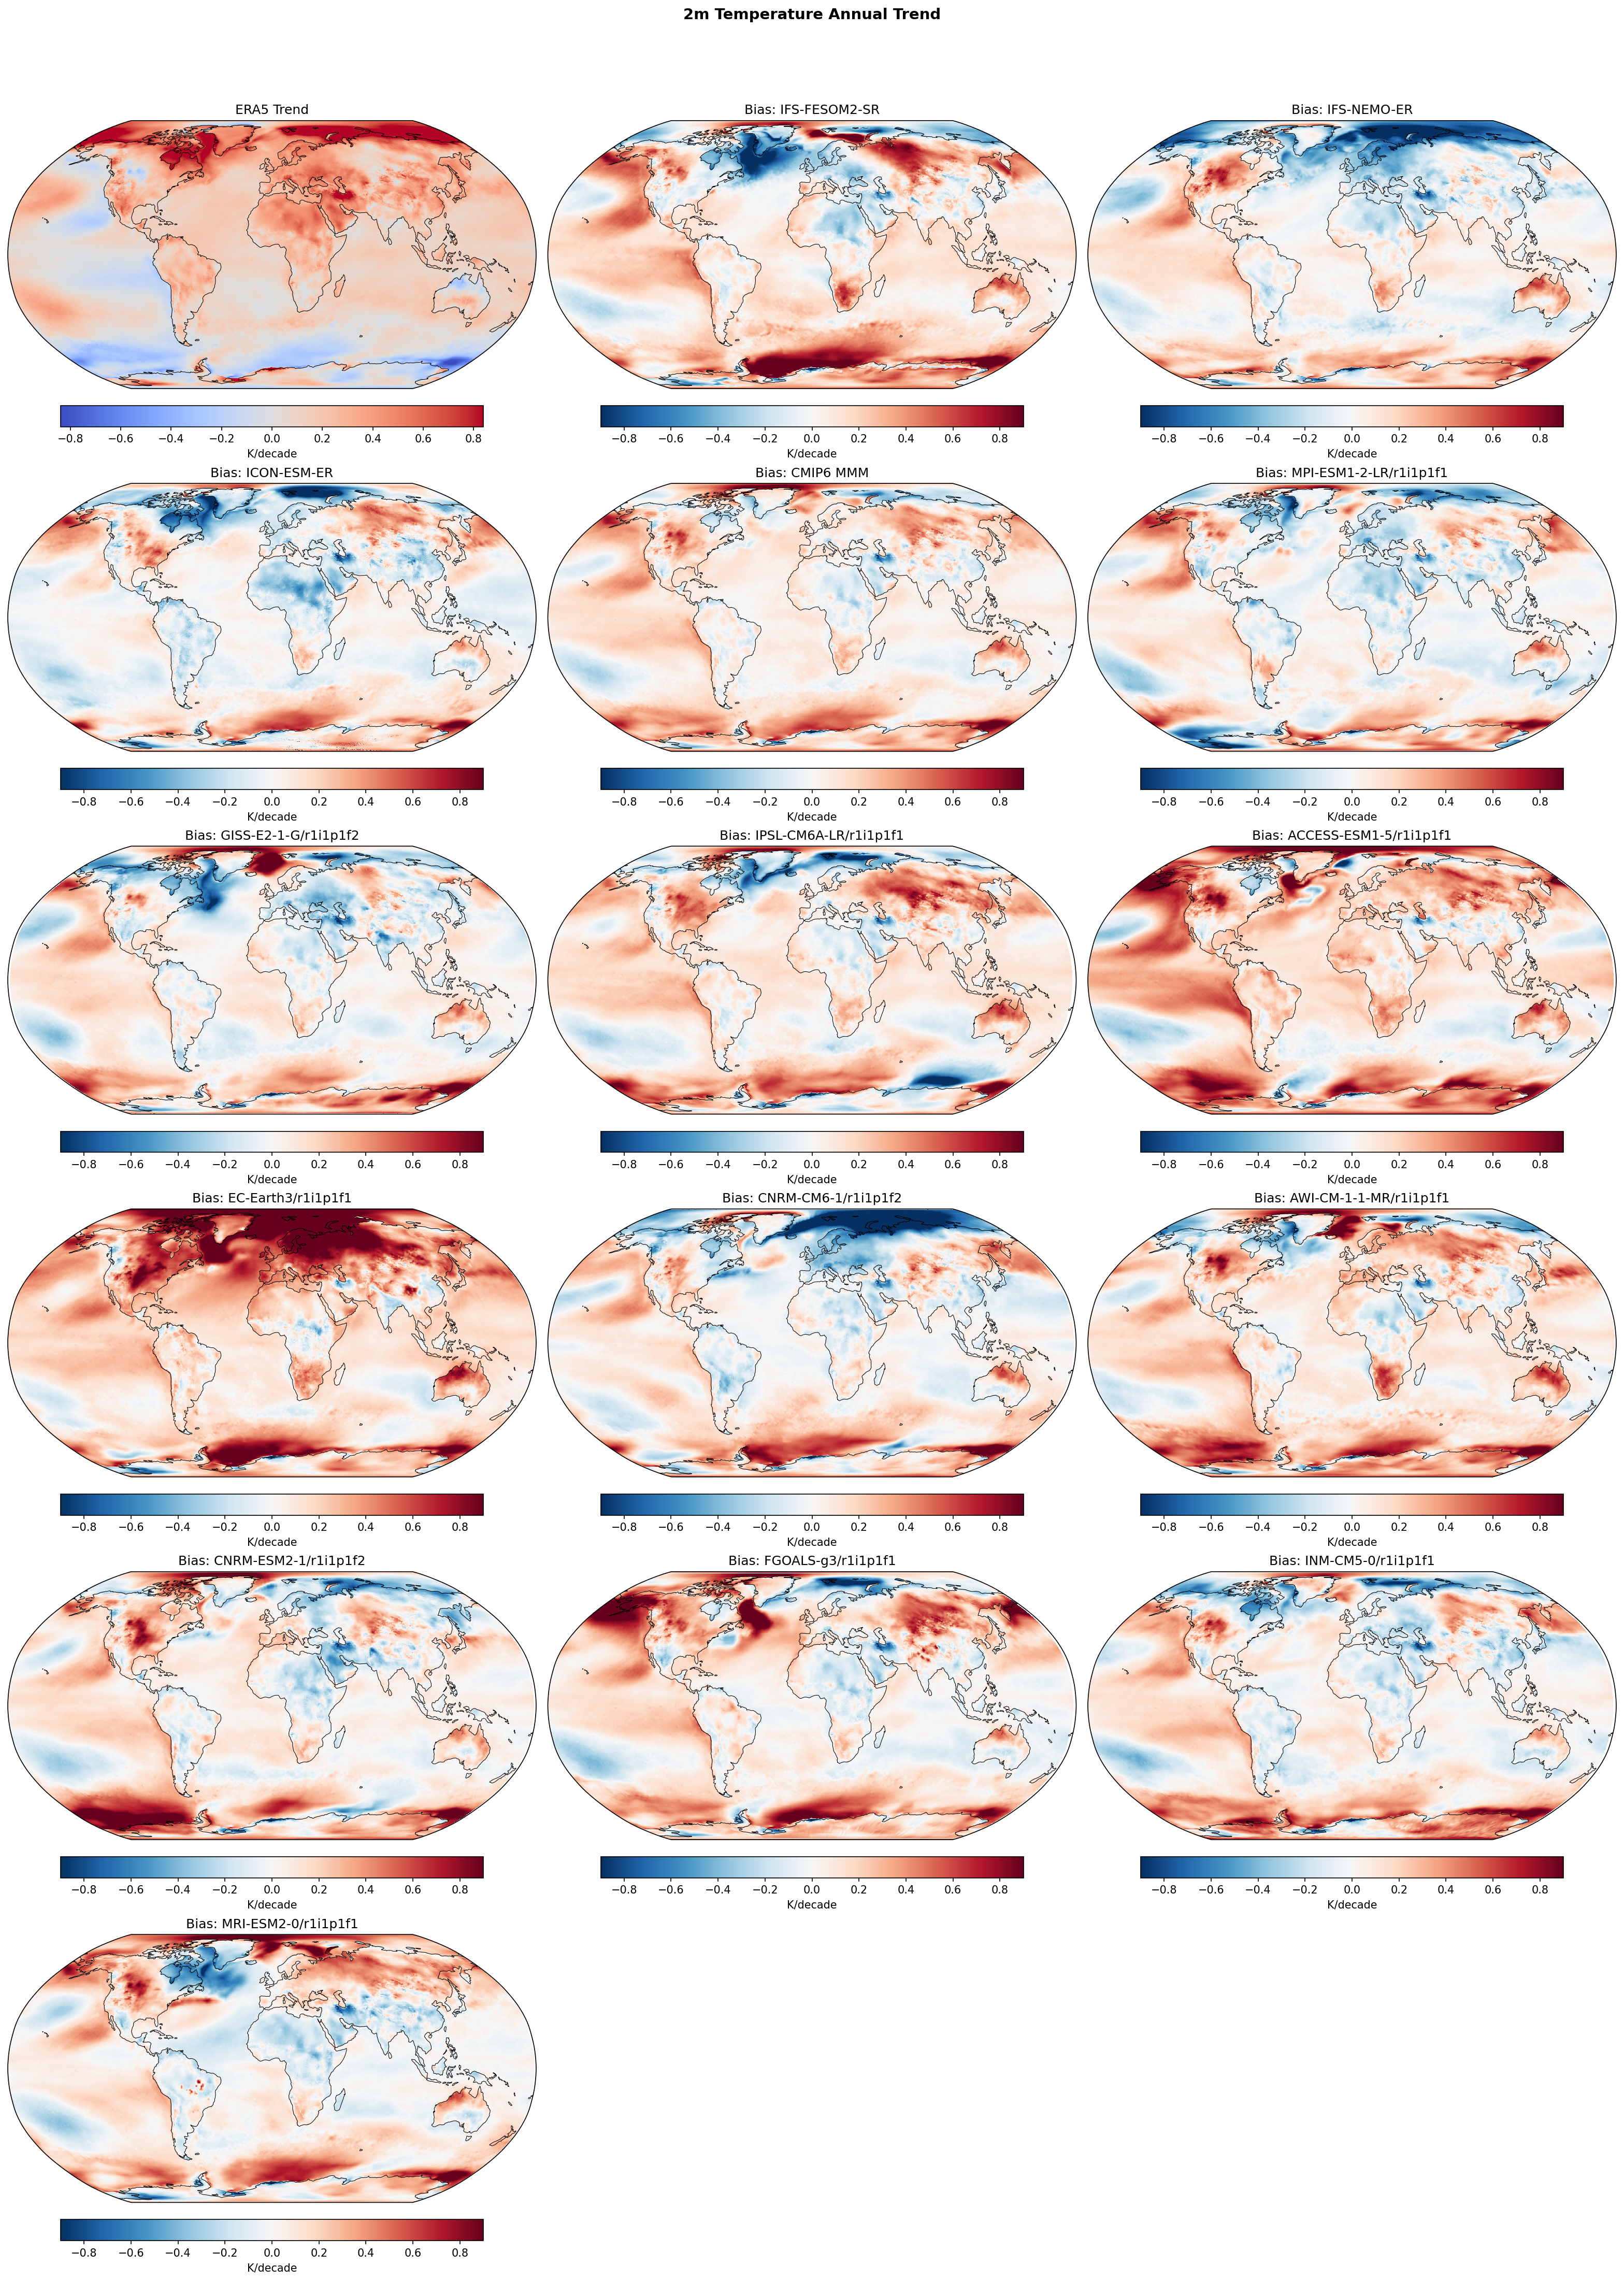
| Variables | tas |
|---|---|
| Models | IFS-FESOM2-SR, IFS-NEMO-ER, ICON-ESM-ER, CMIP6 MMM, MPI-ESM1-2-LR/r1i1p1f1, GISS-E2-1-G/r1i1p1f2, IPSL-CM6A-LR/r1i1p1f1, ACCESS-ESM1-5/r1i1p1f1, EC-Earth3/r1i1p1f1, CNRM-CM6-1/r1i1p1f2, AWI-CM-1-1-MR/r1i1p1f1, CNRM-ESM2-1/r1i1p1f2, FGOALS-g3/r1i1p1f1, INM-CM5-0/r1i1p1f1, MRI-ESM2-0/r1i1p1f1 |
| Reference Dataset | ERA5 |
| Units | K/decade |
| Period | 1980–2014 |
| IFS-FESOM2-SR | Global Mean Trend: 0.27 · Global Mean Trend Diff: 0.12 · Trend Rmse: 0.27 |
| IFS-NEMO-ER | Global Mean Trend: 0.16 · Global Mean Trend Diff: 0.00 · Trend Rmse: 0.22 |
| ICON-ESM-ER | Global Mean Trend: 0.16 · Global Mean Trend Diff: 0.00 · Trend Rmse: 0.19 |
| CMIP6 MMM | Global Mean Trend Diff: 0.09 · Trend Rmse: 0.19 |
| MPI-ESM1-2-LR/r1i1p1f1 | Global Mean Trend Diff: 0.02 · Trend Rmse: 0.18 |
| GISS-E2-1-G/r1i1p1f2 | Global Mean Trend Diff: 0.04 · Trend Rmse: 0.21 |
| IPSL-CM6A-LR/r1i1p1f1 | Global Mean Trend Diff: 0.10 · Trend Rmse: 0.23 |
| ACCESS-ESM1-5/r1i1p1f1 | Global Mean Trend Diff: 0.18 · Trend Rmse: 0.29 |
| EC-Earth3/r1i1p1f1 | Global Mean Trend Diff: 0.25 · Trend Rmse: 0.41 |
| CNRM-CM6-1/r1i1p1f2 | Global Mean Trend Diff: 0.02 · Trend Rmse: 0.28 |
| AWI-CM-1-1-MR/r1i1p1f1 | Global Mean Trend Diff: 0.13 · Trend Rmse: 0.24 |
| CNRM-ESM2-1/r1i1p1f2 | Global Mean Trend Diff: 0.08 · Trend Rmse: 0.23 |
| FGOALS-g3/r1i1p1f1 | Global Mean Trend Diff: 0.12 · Trend Rmse: 0.27 |
| INM-CM5-0/r1i1p1f1 | Global Mean Trend Diff: 0.05 · Trend Rmse: 0.21 |
| MRI-ESM2-0/r1i1p1f1 | Global Mean Trend Diff: 0.06 · Trend Rmse: 0.22 |
Summary high
This diagnostic evaluates annual 2m temperature linear trends (1980–2014) for EERIE and CMIP6 models against ERA5. While ERA5 displays strong Arctic amplification, model performance varies significantly: ICON-ESM-ER and IFS-NEMO-ER closely match the observed global warming rate, whereas IFS-FESOM2-SR and several CMIP6 models substantially overestimate the warming trends.
Key Findings
- ICON-ESM-ER and IFS-NEMO-ER exhibit exceptional agreement with the observed global mean trend, showing negligible differences (~0.005 K/decade) compared to the CMIP6 Multi-Model Mean bias (~0.095 K/decade).
- IFS-FESOM2-SR shows a strong positive trend bias (+0.116 K/decade globally), similar to high-sensitivity CMIP6 models like EC-Earth3, indicating it warms much faster than observations.
- The North Atlantic 'warming hole' is notably exaggerated in IFS-FESOM2-SR (seen as a strong negative trend difference), while the Arctic amplification is generally overestimated by most models, particularly the CMIP6 MMM.
Spatial Patterns
ERA5 shows dominant warming in the Arctic (>0.6 K/decade) and broad warming over Northern Hemisphere land. In the difference panels (Model Trend - Obs Trend), 'hot' models like EC-Earth3 and ACCESS-ESM1-5 display pervasive red hues (positive bias) globally. IFS-FESOM2-SR shows a distinct dipole: excessive warming in the Arctic/Global Ocean contrasting with a cooling trend bias in the subpolar North Atlantic. The Southern Ocean generally shows positive trend biases (models warming faster than the neutral/cooling observations).
Model Agreement
ICON-ESM-ER achieves the lowest RMSE (0.19) and mean bias, marking it as the best performer for this metric. IFS-NEMO-ER is a close second. There is strong divergence between these two moderate-warming models and the high-warming group (IFS-FESOM2-SR, EC-Earth3), which differ from observations by >0.1 K/decade.
Physical Interpretation
The broad positive trend biases in IFS-FESOM2-SR and EC-Earth3 likely stem from higher Equilibrium Climate Sensitivity (ECS) or transient climate response in these models compared to the real world (or ERA5). The localized negative trend bias in the North Atlantic for IFS-FESOM2-SR suggests a potential slowdown of the AMOC or strong local heat flux adjustments not seen in the other high-res simulations. The general overestimation of Arctic warming implies model sea-ice loss or ice-albedo feedbacks may be too aggressive during this period.
Caveats
- The analysis period (1980–2014) is relatively short (35 years), meaning internal variability (e.g., IPO, AMO phases) significantly influences linear trends.
- The 'Bias' label in the panel titles technically represents 'Trend Difference' (Model Trend minus Observation Trend), not climatological mean bias.
2m Temperature DJF Linear Trend
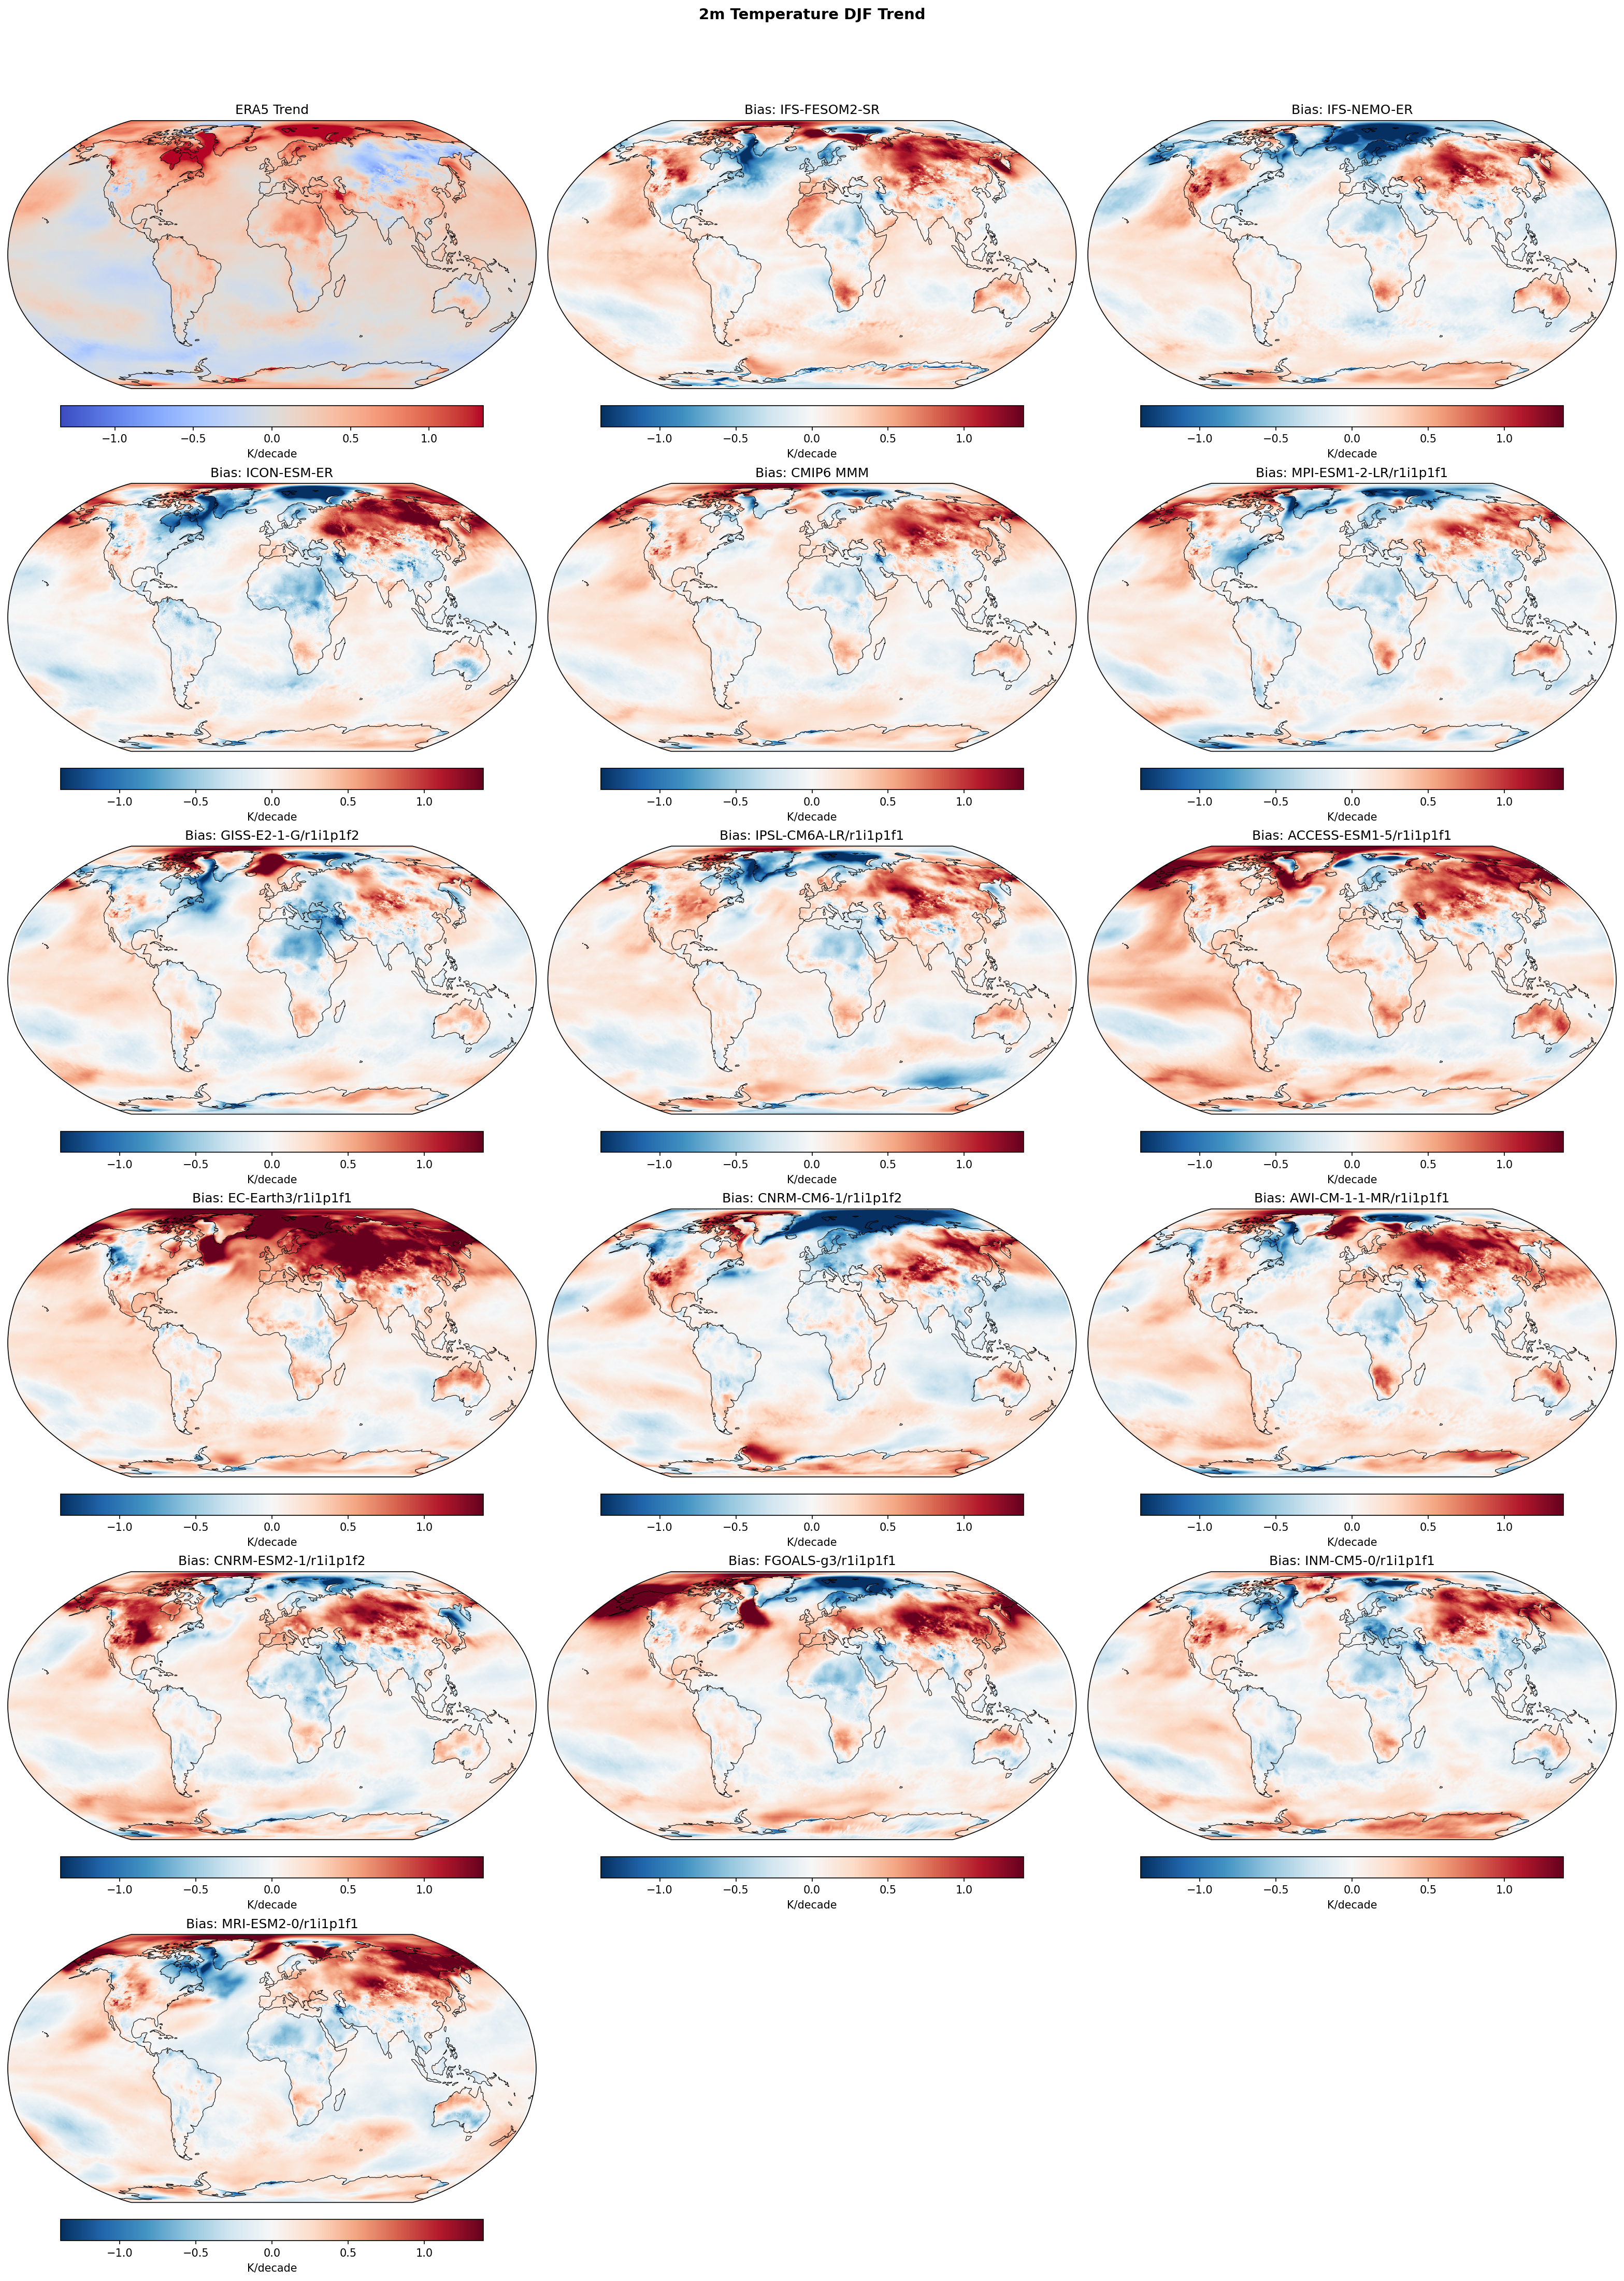
| Variables | tas |
|---|---|
| Models | IFS-FESOM2-SR, IFS-NEMO-ER, ICON-ESM-ER, CMIP6 MMM, MPI-ESM1-2-LR/r1i1p1f1, GISS-E2-1-G/r1i1p1f2, IPSL-CM6A-LR/r1i1p1f1, ACCESS-ESM1-5/r1i1p1f1, EC-Earth3/r1i1p1f1, CNRM-CM6-1/r1i1p1f2, AWI-CM-1-1-MR/r1i1p1f1, CNRM-ESM2-1/r1i1p1f2, FGOALS-g3/r1i1p1f1, INM-CM5-0/r1i1p1f1, MRI-ESM2-0/r1i1p1f1 |
| Reference Dataset | ERA5 |
| Units | K/decade |
| Period | 1980–2014 |
| CMIP6 MMM | Global Mean Trend Diff: 0.11 · Trend Rmse: None |
| MPI-ESM1-2-LR/r1i1p1f1 | Global Mean Trend Diff: 0.03 · Trend Rmse: None |
| GISS-E2-1-G/r1i1p1f2 | Global Mean Trend Diff: 0.03 · Trend Rmse: None |
| IPSL-CM6A-LR/r1i1p1f1 | Global Mean Trend Diff: 0.08 · Trend Rmse: None |
| ACCESS-ESM1-5/r1i1p1f1 | Global Mean Trend Diff: 0.20 · Trend Rmse: None |
| EC-Earth3/r1i1p1f1 | Global Mean Trend Diff: 0.28 · Trend Rmse: None |
| CNRM-CM6-1/r1i1p1f2 | Global Mean Trend Diff: 0.03 · Trend Rmse: None |
| AWI-CM-1-1-MR/r1i1p1f1 | Global Mean Trend Diff: 0.14 · Trend Rmse: None |
| CNRM-ESM2-1/r1i1p1f2 | Global Mean Trend Diff: 0.10 · Trend Rmse: None |
| FGOALS-g3/r1i1p1f1 | Global Mean Trend Diff: 0.14 · Trend Rmse: None |
| INM-CM5-0/r1i1p1f1 | Global Mean Trend Diff: 0.06 · Trend Rmse: None |
| MRI-ESM2-0/r1i1p1f1 | Global Mean Trend Diff: 0.08 · Trend Rmse: None |
Summary high
This figure evaluates linear trends in DJF 2m temperature over the period 1980–2014, comparing the ERA5 observational baseline with trend biases (model minus observation) for EERIE high-resolution models and a suite of CMIP6 simulations.
Key Findings
- **Pacific Trend Mismatch:** A pervasive positive trend bias (red) exists in the Eastern Tropical Pacific across almost all models (including EERIE and CMIP6 MMM). Models simulate warming here, whereas ERA5 shows cooling/neutral trends, highlighting the 'pattern effect' discrepancy where coupled models fail to capture the observed La Niña-like trend pattern.
- **High-Sensitivity Overestimation:** Models known for high Equilibrium Climate Sensitivity (e.g., EC-Earth3, ACCESS-ESM1-5) exhibit strong positive trend biases globally (deep red), warming significantly faster than observations over this 35-year period.
- **Arctic Amplification Divergence:** While ERA5 shows strong Arctic warming (>1 K/decade), model performance varies. ICON-ESM-ER and IFS-NEMO-ER show negative biases (blue) in the central Arctic Ocean, indicating an underestimation of sea-ice associated warming, while stronger warming biases appear over adjacent land masses (Siberia/Canada).
- **Southern Ocean Warm Bias:** Most models, including the EERIE protocols, display a widespread positive trend bias over the Southern Ocean, failing to reproduce the observed delayed warming or weak cooling trends.
Spatial Patterns
ERA5 (top-left) is characterized by intense Arctic Amplification and cooling in the Eastern Pacific. Model bias maps generally show widespread positive values (warming faster than obs), particularly in the Southern Ocean and over Northern Hemisphere land masses (e.g., strong positive bias over Siberia in ICON-ESM-ER). A notable 'blue' (negative) bias appears in the North Atlantic for the CMIP6 MMM and several models, potentially exaggerating the warming hole or reflecting phase mismatch in AMOC variability.
Model Agreement
There is significant spread in trend magnitude. MPI-ESM1-2-LR and CNRM-CM6-1 show the lowest bias magnitudes (paler maps), while EC-Earth3 represents an outlier with excessive warming. The EERIE models (IFS-FESOM2-SR, IFS-NEMO-ER, ICON-ESM-ER) do not distinctly outperform the best CMIP6 models in this metric, showing similar regional bias patterns (e.g., Pacific warming bias).
Physical Interpretation
The pervasive red biases in the Eastern Pacific and Southern Ocean likely stem from coupled model difficulties in capturing the specific phase of decadal variability (IPO, SAM) that occurred during 1980–2014. The discrepancy in Arctic trends among models relates to differences in sea ice feedback strength and high-latitude cloud feedbacks. The 'hot' models (EC-Earth3) likely have higher transient climate response.
Caveats
- Trends calculated over a short 35-year period are heavily influenced by internal climate variability (e.g., ENSO, IPO, NAO).
- Disagreements between free-running coupled models and observations often reflect random phase mismatches in these modes rather than purely structural model errors.
2m Temperature JJA Linear Trend
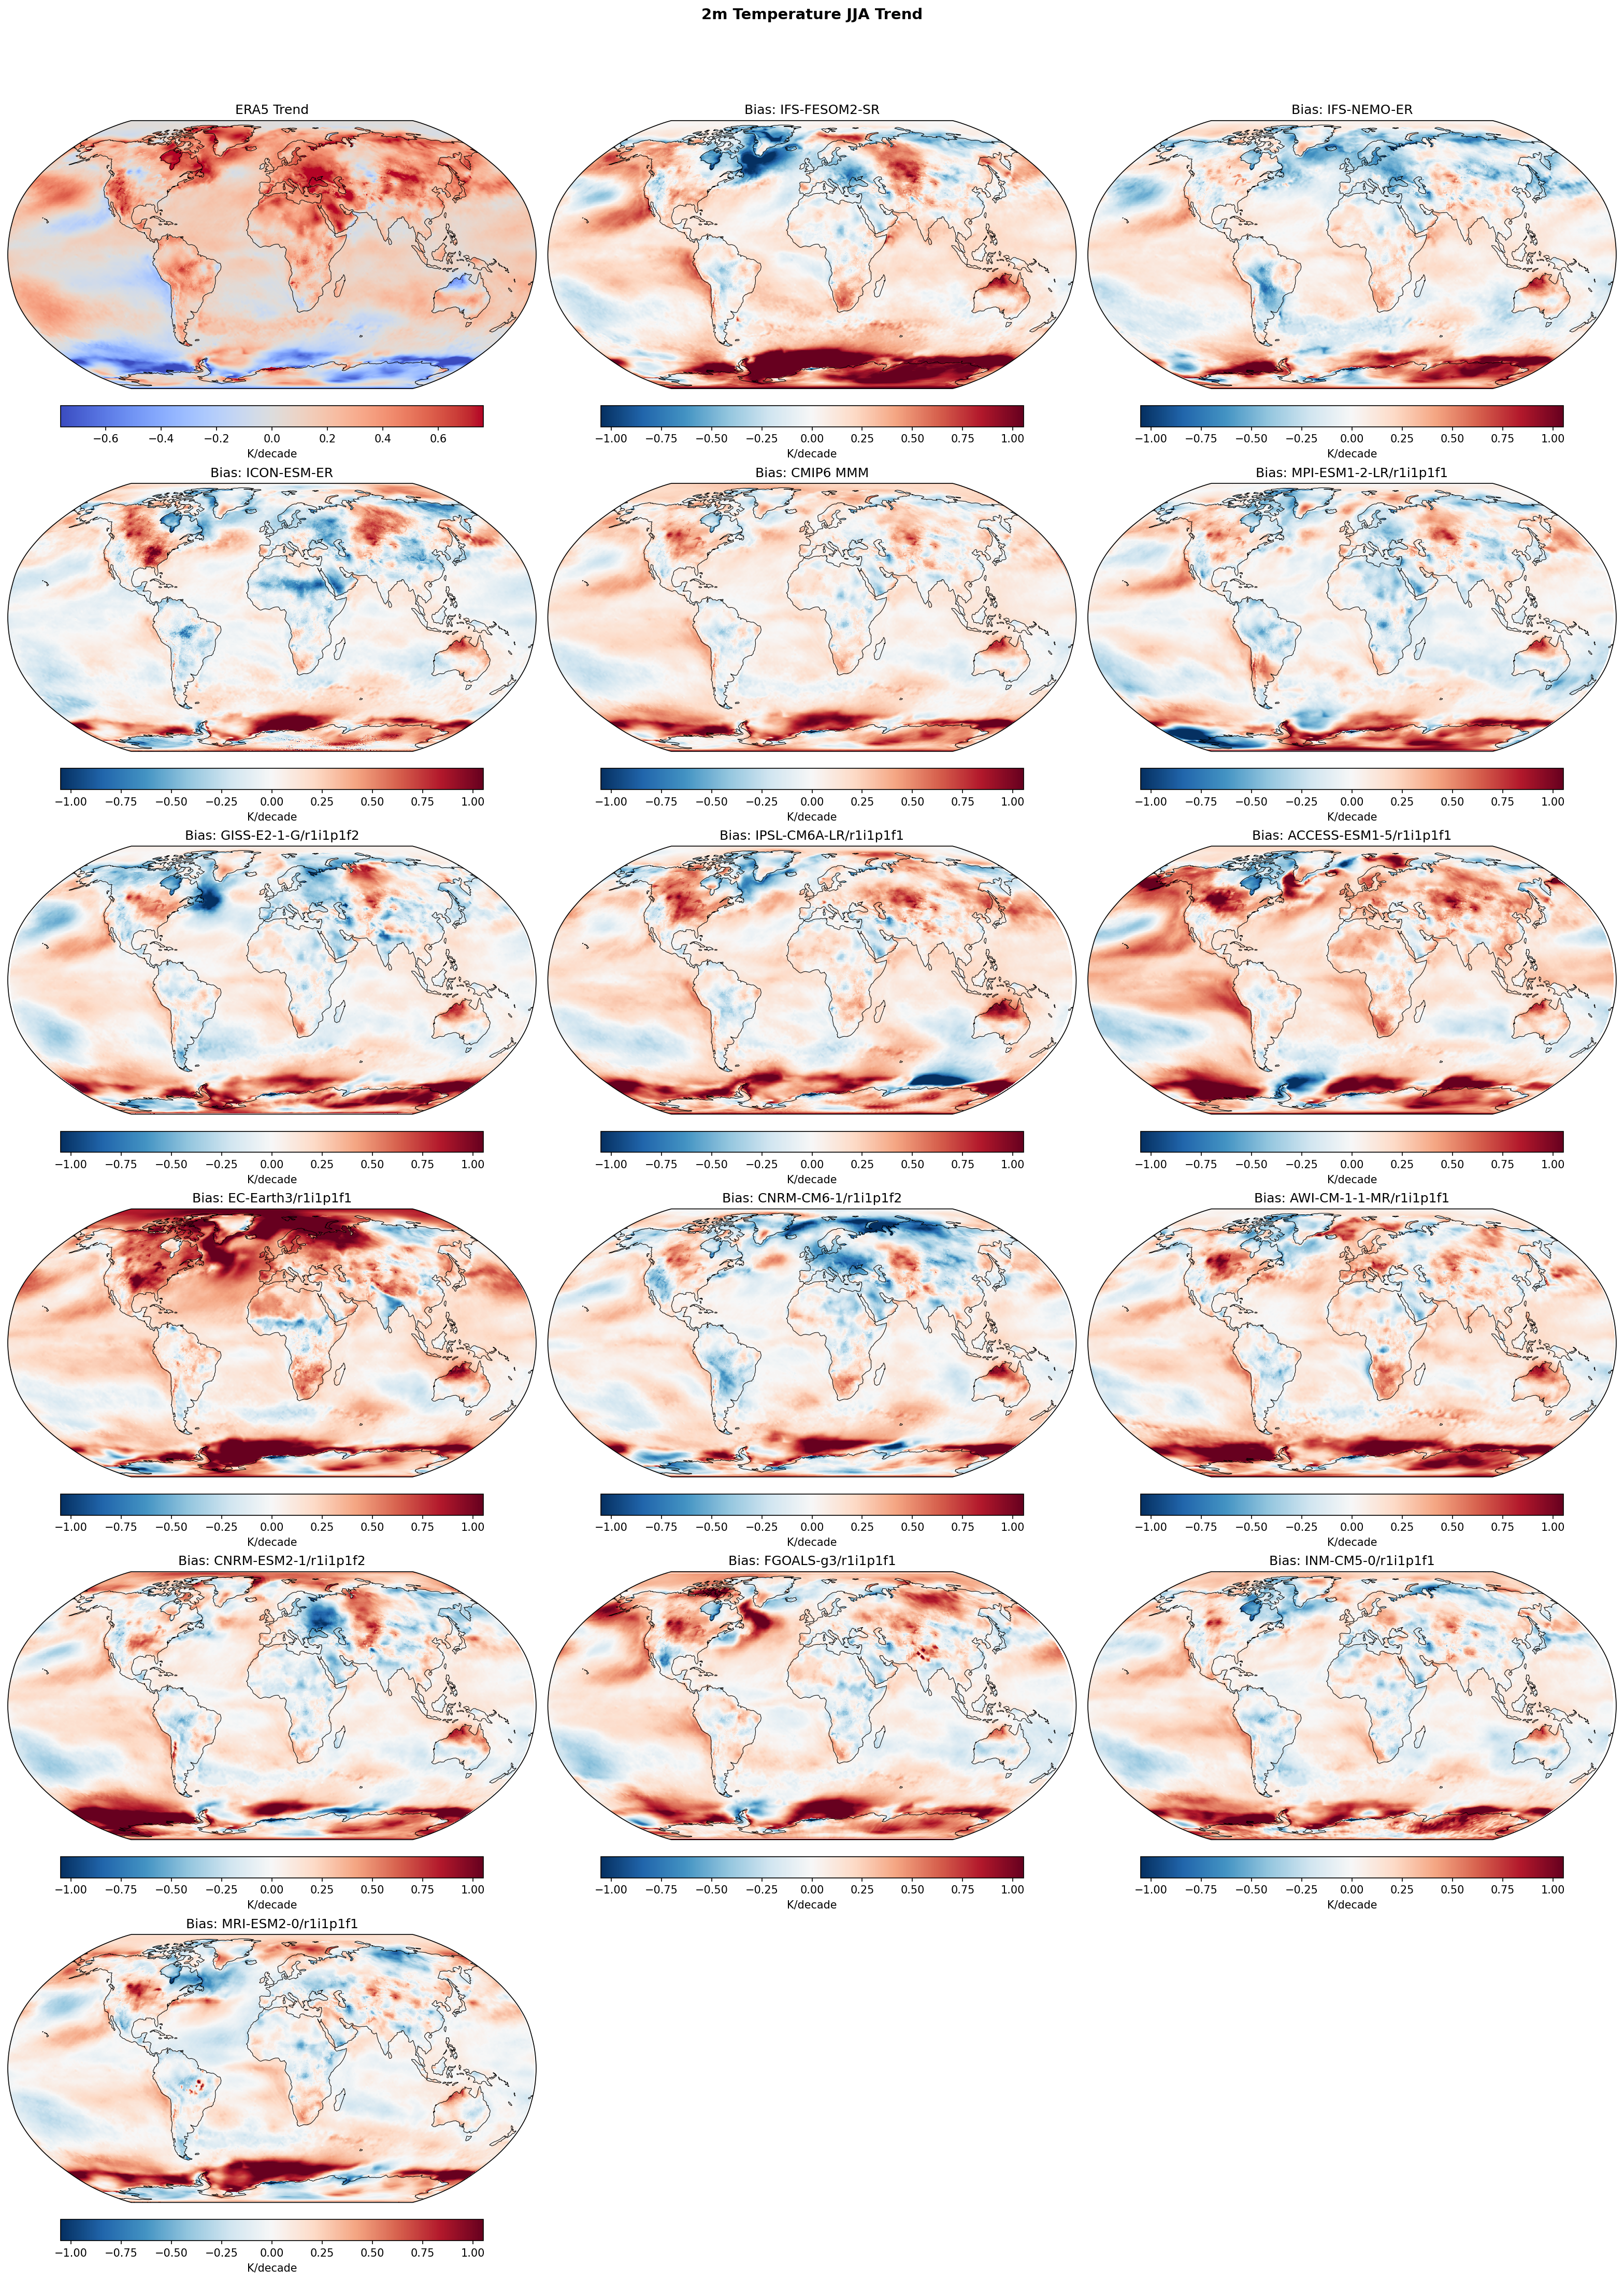
| Variables | tas |
|---|---|
| Models | IFS-FESOM2-SR, IFS-NEMO-ER, ICON-ESM-ER, CMIP6 MMM, MPI-ESM1-2-LR/r1i1p1f1, GISS-E2-1-G/r1i1p1f2, IPSL-CM6A-LR/r1i1p1f1, ACCESS-ESM1-5/r1i1p1f1, EC-Earth3/r1i1p1f1, CNRM-CM6-1/r1i1p1f2, AWI-CM-1-1-MR/r1i1p1f1, CNRM-ESM2-1/r1i1p1f2, FGOALS-g3/r1i1p1f1, INM-CM5-0/r1i1p1f1, MRI-ESM2-0/r1i1p1f1 |
| Reference Dataset | ERA5 |
| Units | K/decade |
| Period | 1980–2014 |
| CMIP6 MMM | Global Mean Trend Diff: 0.10 · Trend Rmse: None |
| MPI-ESM1-2-LR/r1i1p1f1 | Global Mean Trend Diff: 0.03 · Trend Rmse: None |
| GISS-E2-1-G/r1i1p1f2 | Global Mean Trend Diff: 0.05 · Trend Rmse: None |
| IPSL-CM6A-LR/r1i1p1f1 | Global Mean Trend Diff: 0.12 · Trend Rmse: None |
| ACCESS-ESM1-5/r1i1p1f1 | Global Mean Trend Diff: 0.18 · Trend Rmse: None |
| EC-Earth3/r1i1p1f1 | Global Mean Trend Diff: 0.24 · Trend Rmse: None |
| CNRM-CM6-1/r1i1p1f2 | Global Mean Trend Diff: 0.04 · Trend Rmse: None |
| AWI-CM-1-1-MR/r1i1p1f1 | Global Mean Trend Diff: 0.14 · Trend Rmse: None |
| CNRM-ESM2-1/r1i1p1f2 | Global Mean Trend Diff: 0.09 · Trend Rmse: None |
| FGOALS-g3/r1i1p1f1 | Global Mean Trend Diff: 0.11 · Trend Rmse: None |
| INM-CM5-0/r1i1p1f1 | Global Mean Trend Diff: 0.07 · Trend Rmse: None |
| MRI-ESM2-0/r1i1p1f1 | Global Mean Trend Diff: 0.06 · Trend Rmse: None |
Summary high
This figure evaluates JJA 2m temperature linear trends (1980–2014), comparing ERA5 observations against high-resolution EERIE simulations (IFS, ICON) and a suite of CMIP6 models to assess multidecadal warming rates.
Key Findings
- A systematic positive trend bias (red) exists in the Southern Ocean across almost all models, including high-resolution EERIE runs, where models simulate warming while ERA5 shows neutral or cooling trends.
- CMIP6 models with high equilibrium climate sensitivity (e.g., EC-Earth3, ACCESS-ESM1-5) exhibit widespread excessive warming (red bias > 0.5 K/decade), while lower sensitivity models (INM-CM5-0, MPI-ESM1-2-LR) align more closely with observed trends.
- The high-resolution EERIE models (IFS-FESOM2-SR, IFS-NEMO-ER, ICON-ESM-ER) do not distinctly outperform the standard resolution CMIP6 ensemble in capturing trend patterns, largely sharing the Southern Ocean biases and showing mixed performance in the Northern Hemisphere.
Spatial Patterns
ERA5 shows strong warming amplification over the Arctic and NH land. Model biases reveal a coherent circum-Antarctic warming error. In the Northern Hemisphere, biases are regionally complex: IFS-FESOM2-SR shows a negative trend bias (relative cooling) in the North Atlantic 'warming hole' region, while ICON-ESM-ER displays a negative trend bias over Greenland and Northern Canada. The Pacific basin shows wave-like bias patterns indicative of variability mismatches.
Model Agreement
There is significant inter-model divergence in warming magnitude, correlated with climate sensitivity. MPI-ESM1-2-LR shows the lowest global mean trend difference (0.027 K/decade). The EERIE models fall within the CMIP6 spread, behaving similarly to the Multi-Model Mean (MMM) rather than standing out as a distinct cluster.
Physical Interpretation
The widespread Southern Ocean warming bias suggests models respond too strongly to GHG forcing in this region or miss stabilizing feedbacks (e.g., meltwater, ozone dynamics) present in observations. Discrepancies in the Pacific and North Atlantic are likely driven by the lack of synchronization in internal decadal variability (IPO, AMV) between free-running simulations and the single observed historical realization.
Caveats
- The 35-year analysis period (1980-2014) is short enough that internal variability (e.g., PDO/IPO phases) significantly impacts trends, meaning mismatches are not solely due to model physics errors.
- Trend bias magnitudes for high-sensitivity models (like EC-Earth3) may saturate the visual color scale.
10m U Wind Annual Linear Trend
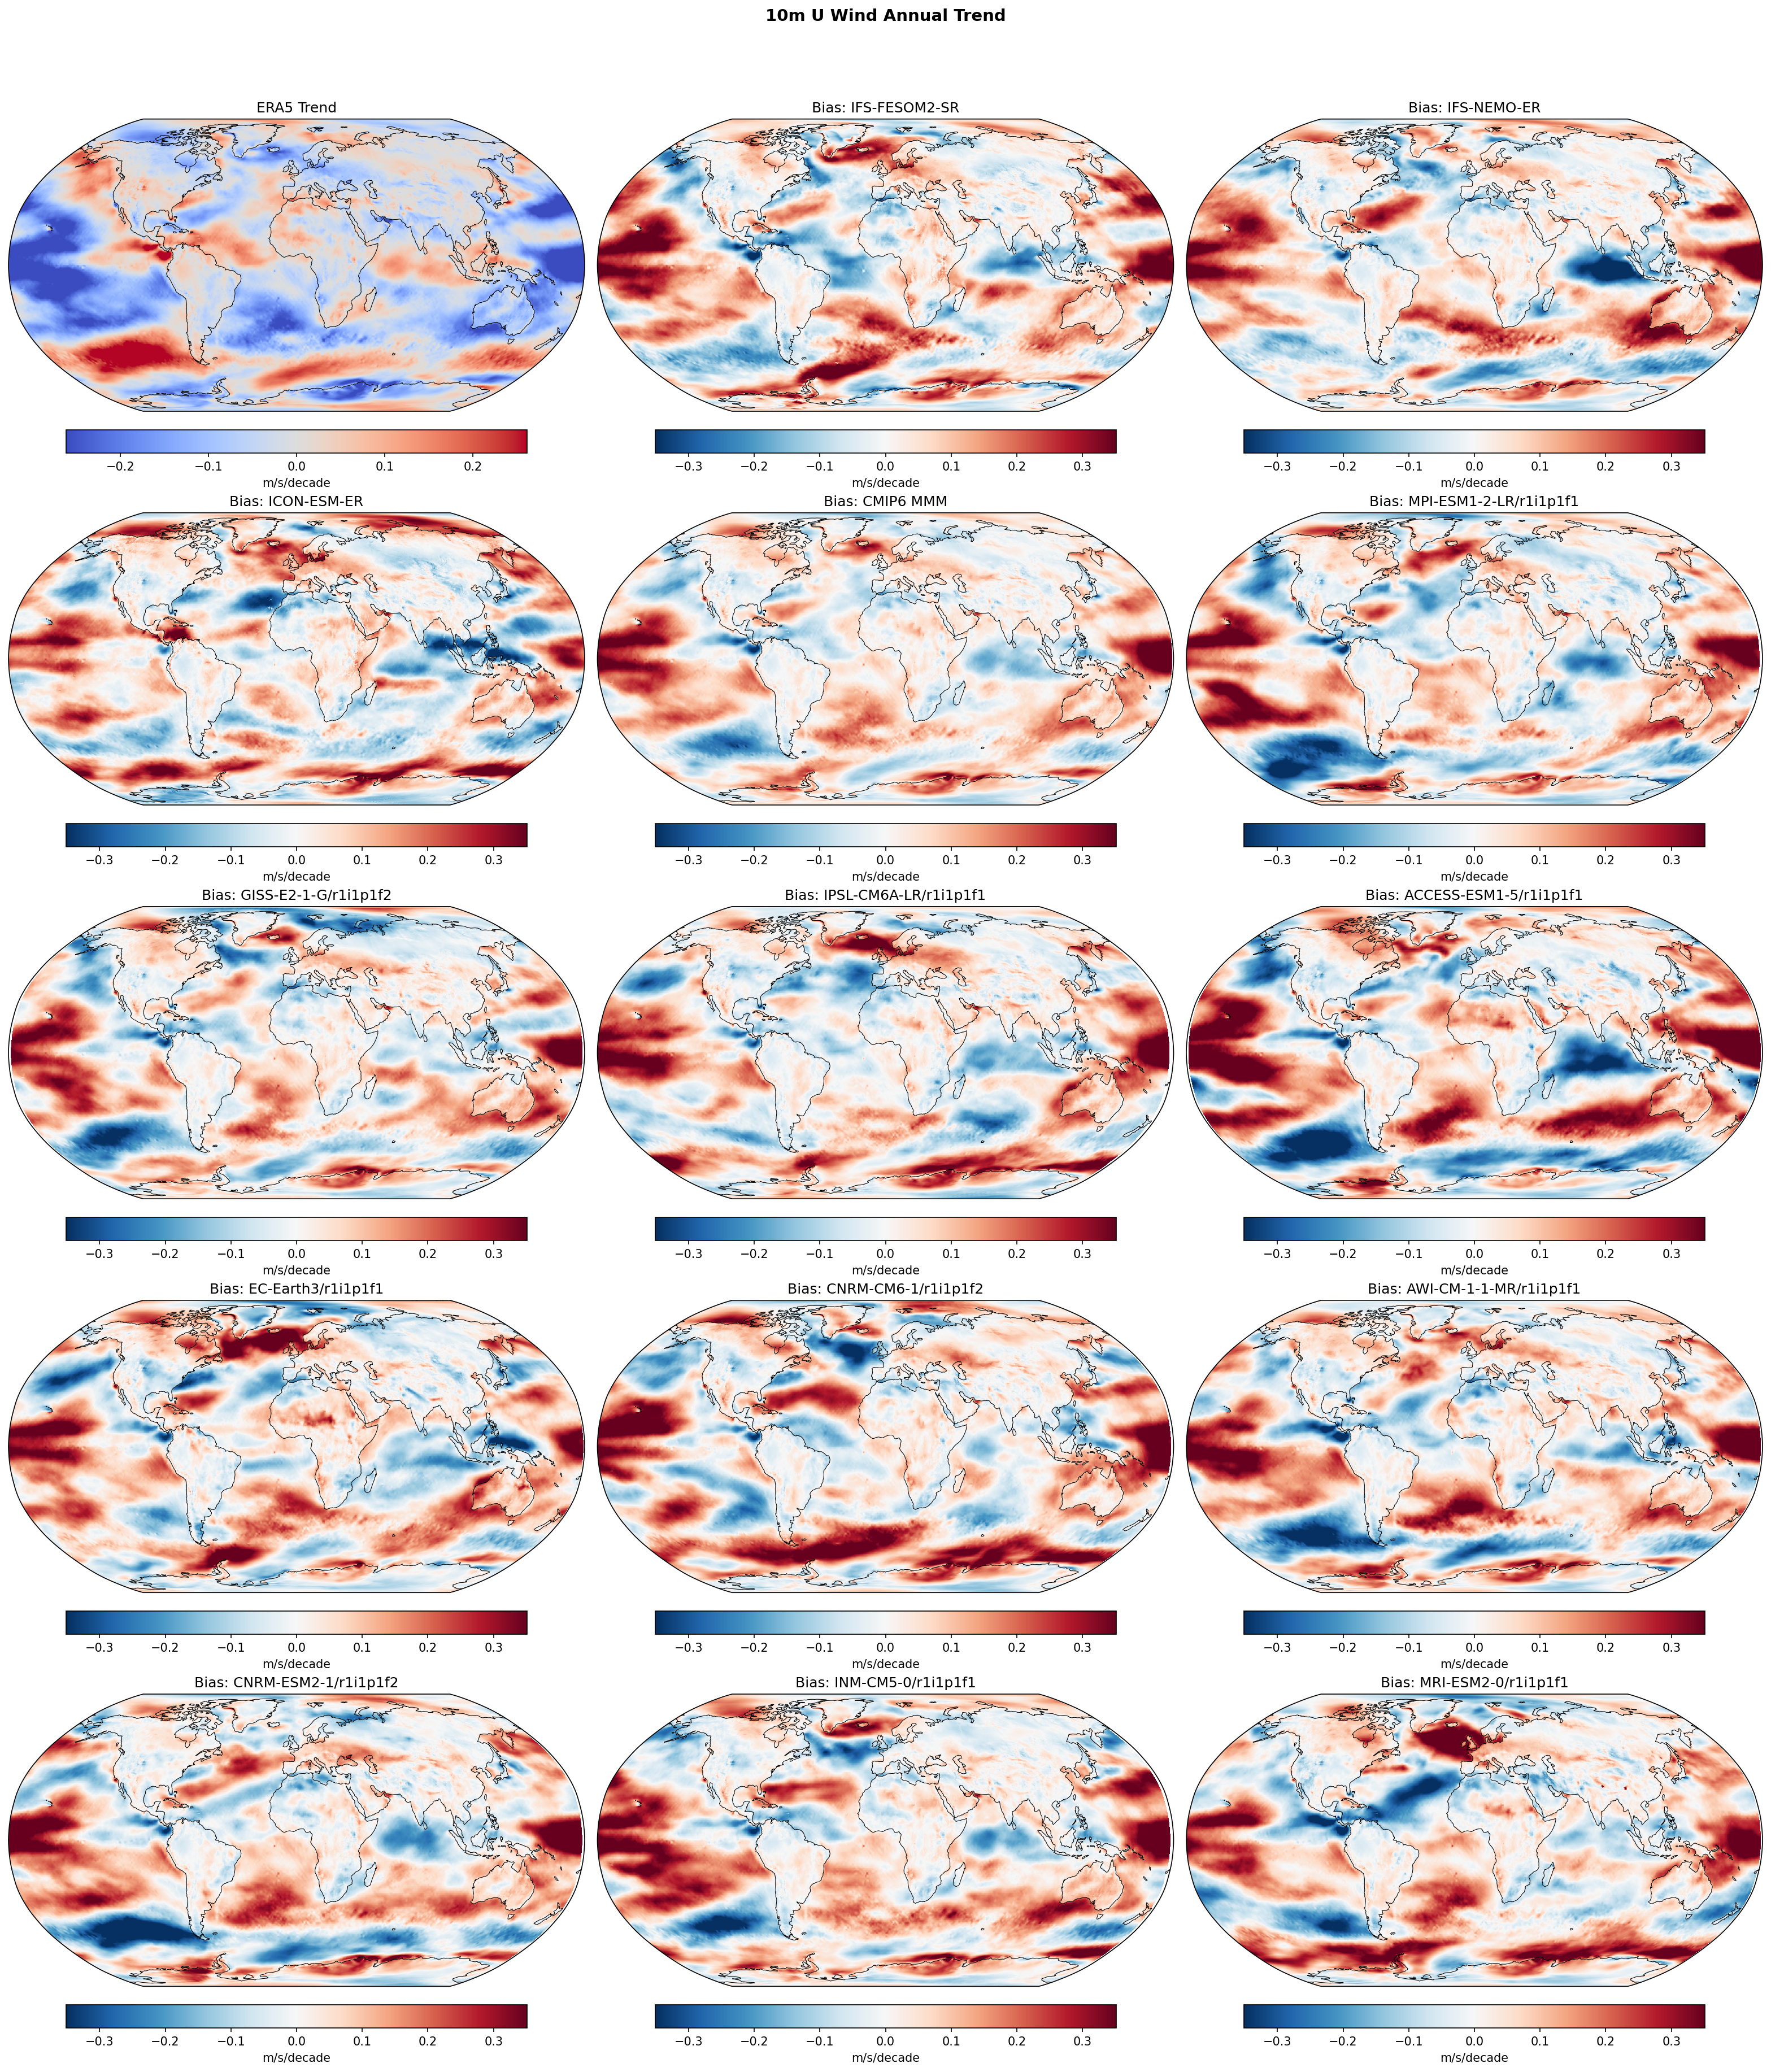
| Variables | uas |
|---|---|
| Models | IFS-FESOM2-SR, IFS-NEMO-ER, ICON-ESM-ER, CMIP6 MMM, MPI-ESM1-2-LR/r1i1p1f1, GISS-E2-1-G/r1i1p1f2, IPSL-CM6A-LR/r1i1p1f1, ACCESS-ESM1-5/r1i1p1f1, EC-Earth3/r1i1p1f1, CNRM-CM6-1/r1i1p1f2, AWI-CM-1-1-MR/r1i1p1f1, CNRM-ESM2-1/r1i1p1f2, INM-CM5-0/r1i1p1f1, MRI-ESM2-0/r1i1p1f1 |
| Reference Dataset | ERA5 |
| Units | m/s/decade |
| Period | 1980–2014 |
| IFS-FESOM2-SR | Global Mean Trend: 0.01 · Global Mean Trend Diff: 0.04 · Trend Rmse: 0.13 |
| IFS-NEMO-ER | Global Mean Trend: -0.00 · Global Mean Trend Diff: 0.03 · Trend Rmse: 0.13 |
| ICON-ESM-ER | Global Mean Trend: -0.01 · Global Mean Trend Diff: 0.02 · Trend Rmse: 0.12 |
| CMIP6 MMM | Global Mean Trend Diff: 0.03 · Trend Rmse: 0.11 |
| MPI-ESM1-2-LR/r1i1p1f1 | Global Mean Trend Diff: 0.03 · Trend Rmse: 0.13 |
| GISS-E2-1-G/r1i1p1f2 | Global Mean Trend Diff: 0.03 · Trend Rmse: 0.12 |
| IPSL-CM6A-LR/r1i1p1f1 | Global Mean Trend Diff: 0.03 · Trend Rmse: 0.13 |
| ACCESS-ESM1-5/r1i1p1f1 | Global Mean Trend Diff: 0.04 · Trend Rmse: 0.17 |
| EC-Earth3/r1i1p1f1 | Global Mean Trend Diff: 0.04 · Trend Rmse: 0.13 |
| CNRM-CM6-1/r1i1p1f2 | Global Mean Trend Diff: 0.05 · Trend Rmse: 0.15 |
| AWI-CM-1-1-MR/r1i1p1f1 | Global Mean Trend Diff: 0.03 · Trend Rmse: 0.14 |
| CNRM-ESM2-1/r1i1p1f2 | Global Mean Trend Diff: 0.03 · Trend Rmse: 0.14 |
| INM-CM5-0/r1i1p1f1 | Global Mean Trend Diff: 0.05 · Trend Rmse: 0.14 |
| MRI-ESM2-0/r1i1p1f1 | Global Mean Trend Diff: 0.03 · Trend Rmse: 0.14 |
Summary high
This figure evaluates annual linear trends in 10m zonal wind (1980–2014) against ERA5. The dominant feature is a systematic discrepancy in the Tropical Pacific where models fail to capture the observed strengthening of trade winds, alongside mixed performance in reproducing Southern Ocean westerly trends.
Key Findings
- Systematic positive trend bias (red) in the Tropical Pacific across all models (High-Res and CMIP6), indicating a failure to simulate the observed 1980–2014 strengthening of easterly trade winds.
- The CMIP6 Multi-Model Mean (MMM) achieves the lowest RMSE (0.111 m/s/decade), likely because ensemble averaging smooths out unforced internal variability that dominates individual model trends.
- Among the high-resolution EERIE models, ICON-ESM-ER (RMSE 0.121) performs slightly better than IFS-NEMO-ER (0.128) and IFS-FESOM2-SR (0.133), but none show a distinct improvement over standard-resolution CMIP6 models for this metric.
- Southern Ocean biases often appear as dipoles or zonal bands, suggesting models may be misplacing the latitudinal shift of the eddy-driven jet compared to observations.
Spatial Patterns
ERA5 shows distinct strengthening of Southern Hemisphere westerlies (50–65°S, red) and Tropical Pacific easterlies (blue). Model bias maps are characterized by large positive (red) biases in the Tropical Pacific—meaning models predict weakening or insufficient strengthening of trades. In the Southern Ocean, biases are spatially noisy with zonal banding, indicating disagreements in the precise location of the jet stream trend.
Model Agreement
There is high inter-model agreement regarding the sign of the error in the Tropical Pacific (universal red bias). Agreement is lower in the North Atlantic and Southern Ocean, where bias patterns vary locally (e.g., IFS-NEMO-ER shows a distinct negative bias in the subpolar North Atlantic not seen as strongly in others).
Physical Interpretation
The pervasive Tropical Pacific bias reflects the well-known 'pattern effect' or model-observation mismatch during the 'warming hiatus' period (1980–2014). Observations saw a negative Interdecadal Pacific Oscillation (IPO) phase (stronger trades, cooler eastern Pacific), while coupled models dominated by GHG forcing tend to simulate weakening Walker circulation or uncorrelated internal variability phases. Resolution increase (in IFS/ICON) does not resolve this forcing/internal variability mismatch.
Caveats
- The analysis period (1980–2014) is relatively short and heavily influenced by internal climate variability (e.g., IPO/PDO).
- Free-running coupled models are not expected to match the phase of internal variability seen in observations, so trend differences here are a mix of forced response errors and internal phase mismatch.
10m U Wind DJF Linear Trend
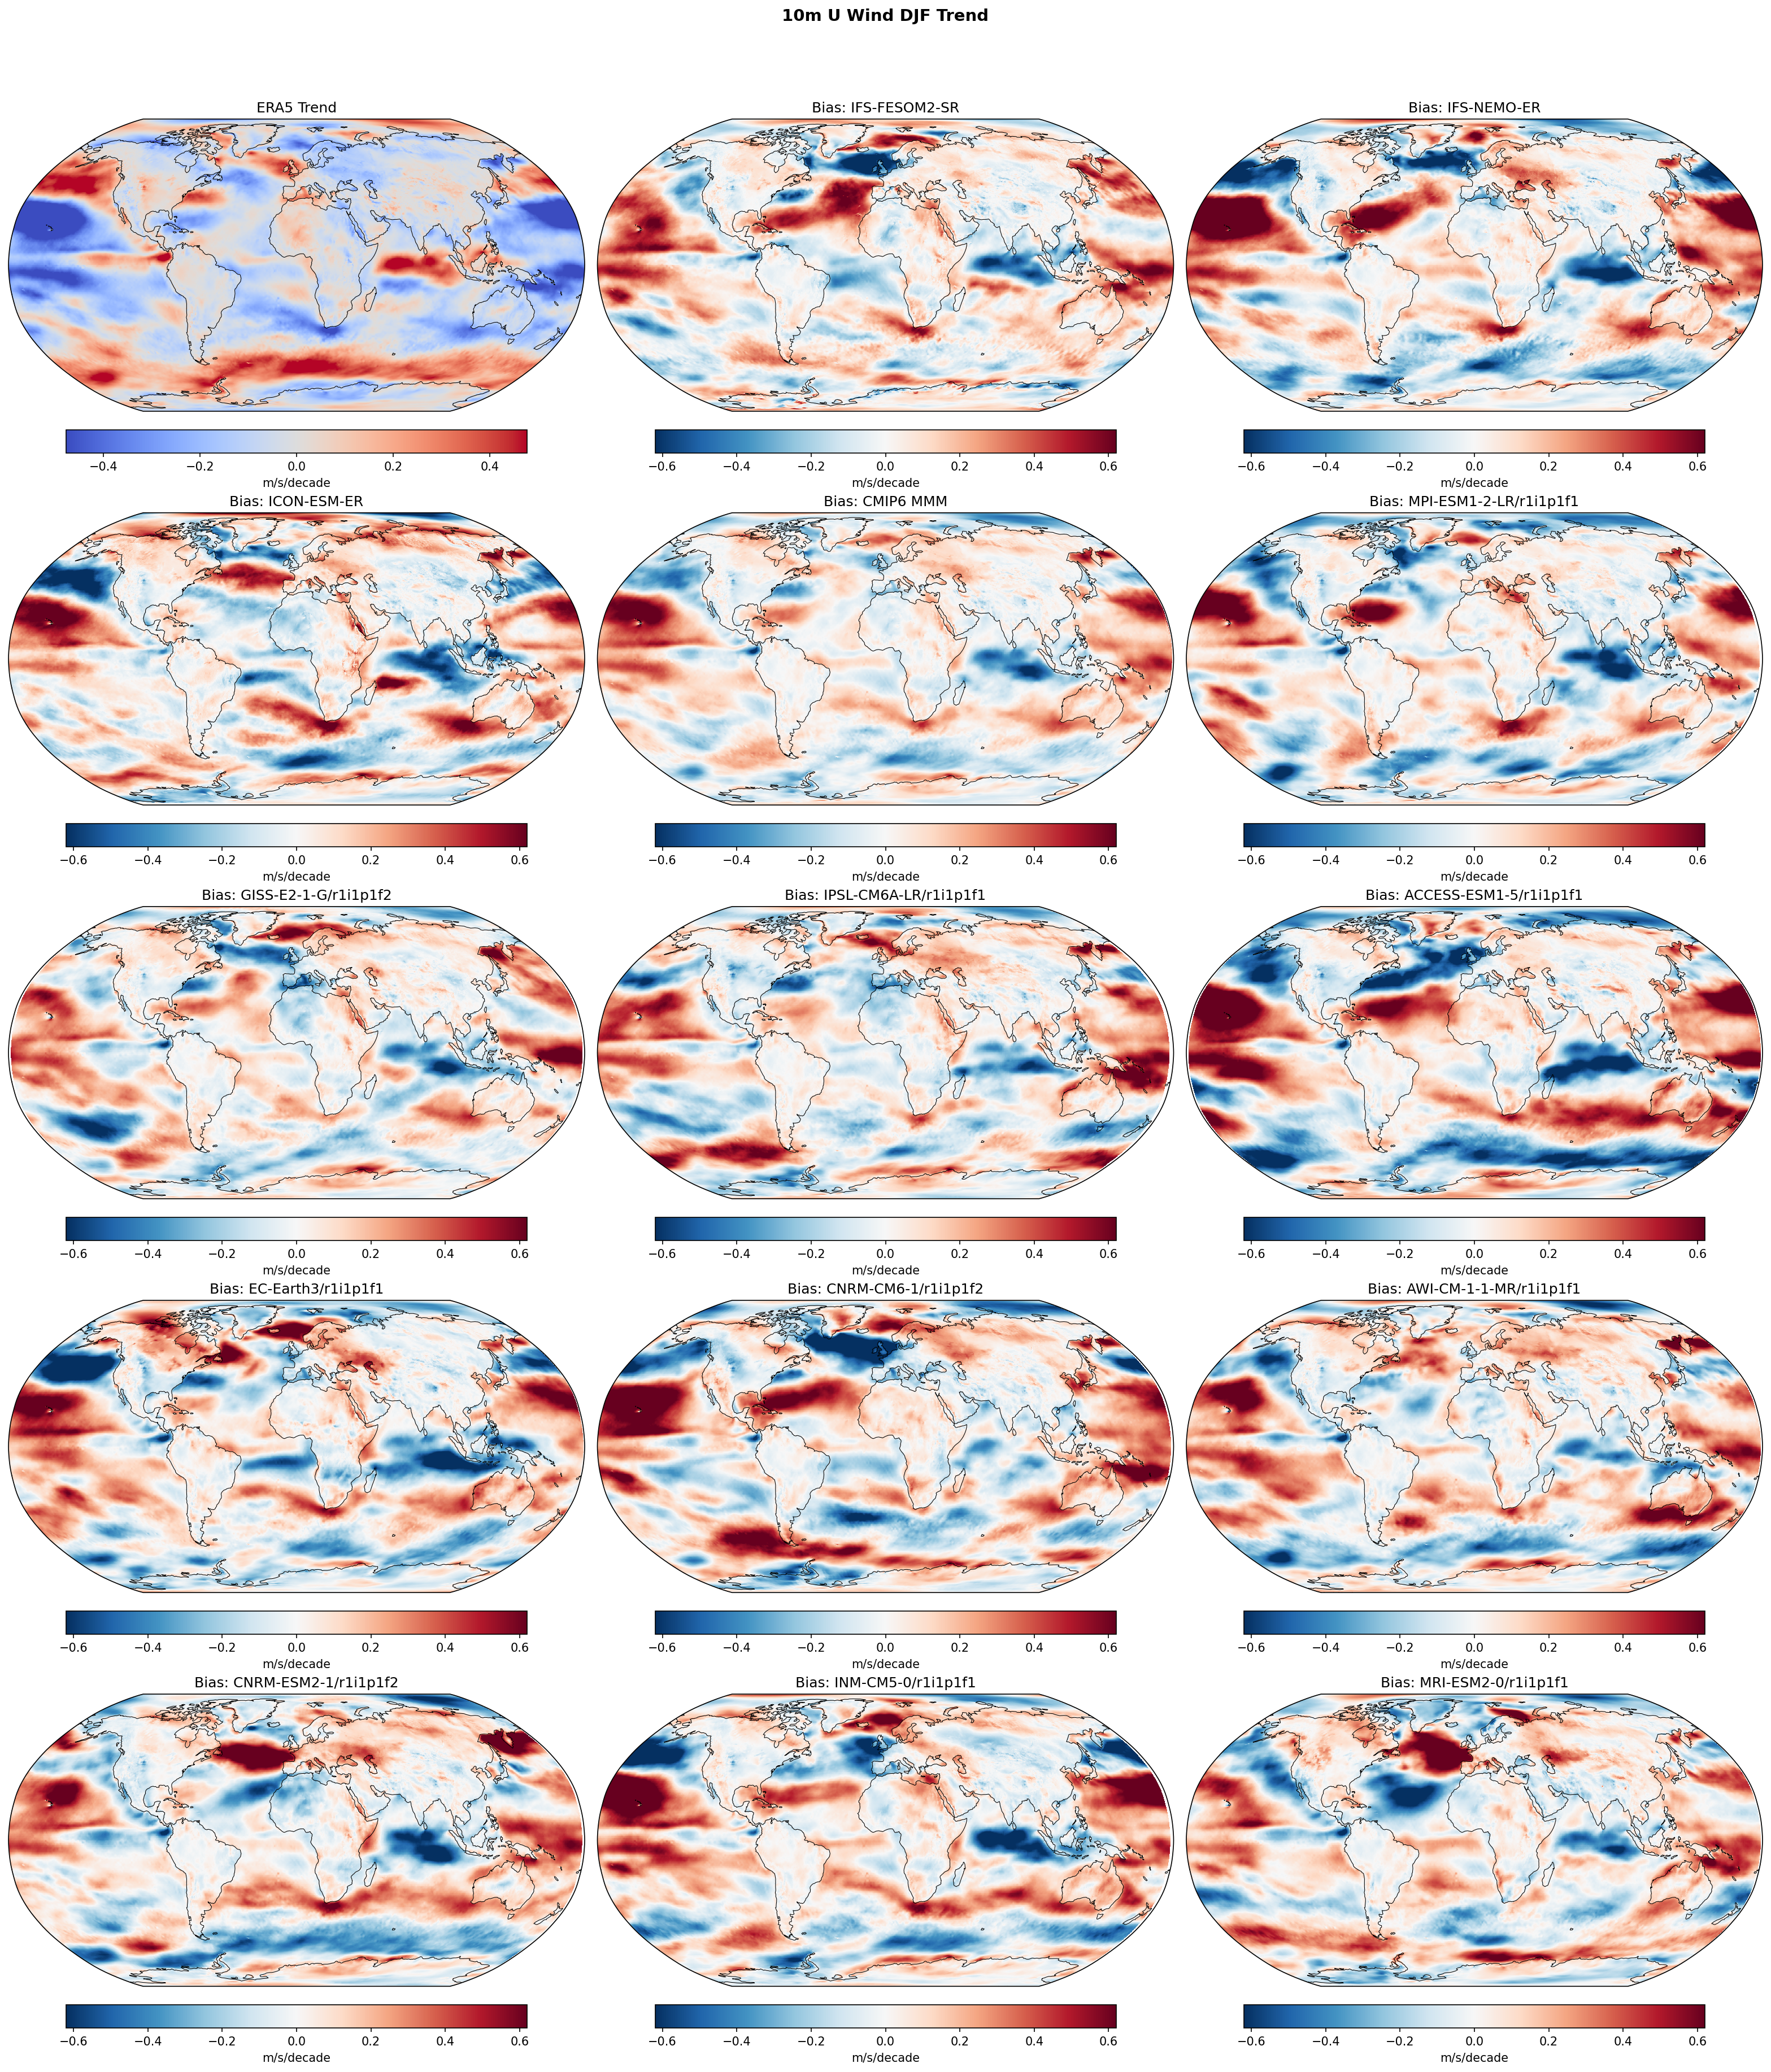
| Variables | uas |
|---|---|
| Models | IFS-FESOM2-SR, IFS-NEMO-ER, ICON-ESM-ER, CMIP6 MMM, MPI-ESM1-2-LR/r1i1p1f1, GISS-E2-1-G/r1i1p1f2, IPSL-CM6A-LR/r1i1p1f1, ACCESS-ESM1-5/r1i1p1f1, EC-Earth3/r1i1p1f1, CNRM-CM6-1/r1i1p1f2, AWI-CM-1-1-MR/r1i1p1f1, CNRM-ESM2-1/r1i1p1f2, INM-CM5-0/r1i1p1f1, MRI-ESM2-0/r1i1p1f1 |
| Reference Dataset | ERA5 |
| Units | m/s/decade |
| Period | 1980–2014 |
| CMIP6 MMM | Global Mean Trend Diff: 0.03 · Trend Rmse: None |
| MPI-ESM1-2-LR/r1i1p1f1 | Global Mean Trend Diff: 0.01 · Trend Rmse: None |
| GISS-E2-1-G/r1i1p1f2 | Global Mean Trend Diff: 0.03 · Trend Rmse: None |
| IPSL-CM6A-LR/r1i1p1f1 | Global Mean Trend Diff: 0.03 · Trend Rmse: None |
| ACCESS-ESM1-5/r1i1p1f1 | Global Mean Trend Diff: 0.03 · Trend Rmse: None |
| EC-Earth3/r1i1p1f1 | Global Mean Trend Diff: 0.02 · Trend Rmse: None |
| CNRM-CM6-1/r1i1p1f2 | Global Mean Trend Diff: 0.06 · Trend Rmse: None |
| AWI-CM-1-1-MR/r1i1p1f1 | Global Mean Trend Diff: 0.04 · Trend Rmse: None |
| CNRM-ESM2-1/r1i1p1f2 | Global Mean Trend Diff: 0.03 · Trend Rmse: None |
| INM-CM5-0/r1i1p1f1 | Global Mean Trend Diff: 0.05 · Trend Rmse: None |
| MRI-ESM2-0/r1i1p1f1 | Global Mean Trend Diff: 0.03 · Trend Rmse: None |
Summary high
This figure evaluates linear trends in DJF 10m zonal wind (10m U Wind) over the 1980–2014 period, comparing ERA5 observations with high-resolution EERIE models (IFS-FESOM2-SR, IFS-NEMO-ER, ICON-ESM-ER) and a suite of CMIP6 models. The panels show the observed trend and the difference between model and observed trends (bias maps), highlighting discrepancies in atmospheric circulation evolution.
Key Findings
- A systematic positive bias (red) in the tropical Pacific is present across nearly all models, including the CMIP6 multi-model mean and high-resolution EERIE simulations. This indicates a failure to capture the observed strengthening of the Pacific trade winds (negative U-wind trend) seen in ERA5.
- The high-resolution EERIE models (IFS and ICON variants) do not show improved performance in capturing historical circulation trends compared to standard-resolution CMIP6 models; their trend bias magnitudes are comparable to individual CMIP6 ensemble members.
- Extratropical bias patterns (North Atlantic, Southern Ocean) exhibit large magnitudes and spatial dipoles that vary significantly between models, suggesting these discrepancies are dominated by uncoupled internal variability (e.g., NAO, SAM phases) rather than systematic model physics errors.
Spatial Patterns
ERA5 shows a distinct strengthening of the Pacific trade winds (blue band along the equator) and a strengthening/poleward shift of the Southern Hemisphere westerlies (red band ~60°S). The model bias maps are dominated by a 'red' bias in the central/eastern equatorial Pacific, meaning models simulate either weakening trades or insufficient strengthening compared to observations. In the extratropics, large-scale dipole biases exist; for instance, ICON-ESM-ER shows a strong negative (blue) trend bias in the North Pacific, while IFS-FESOM2-SR shows positive biases in the North Atlantic.
Model Agreement
There is high inter-model agreement on the sign of the error in the Tropical Pacific (systematic positive bias), confirming a common deficiency in reproducing the recent history of the Walker Circulation. Conversely, there is low agreement in the extratropics (North Atlantic, North Pacific), where bias patterns appear stochastic, reflecting the random phasing of internal decadal variability in free-running simulations.
Physical Interpretation
The widespread failure to capture the tropical Pacific trade wind strengthening (often referred to as the 'pattern effect' or missing La Niña-like trend) suggests that coupled models generally simulate an excessive warming trend in the eastern Pacific or fail to respond correctly to historical forcing in this region. The large extratropical biases are expected in free-running coupled simulations, as the models' internal decadal modes (IPO, AMO, NAO) are not phase-locked to the observed historical timeline.
Caveats
- The analysis period (1980–2014) is relatively short (35 years), making trends highly susceptible to multidecadal internal variability.
- Differences between single model realizations and observations in trend maps conflate model structural errors with mismatches in internal variability phases; the CMIP6 MMM bias is more indicative of systematic forced response errors.
10m U Wind JJA Linear Trend
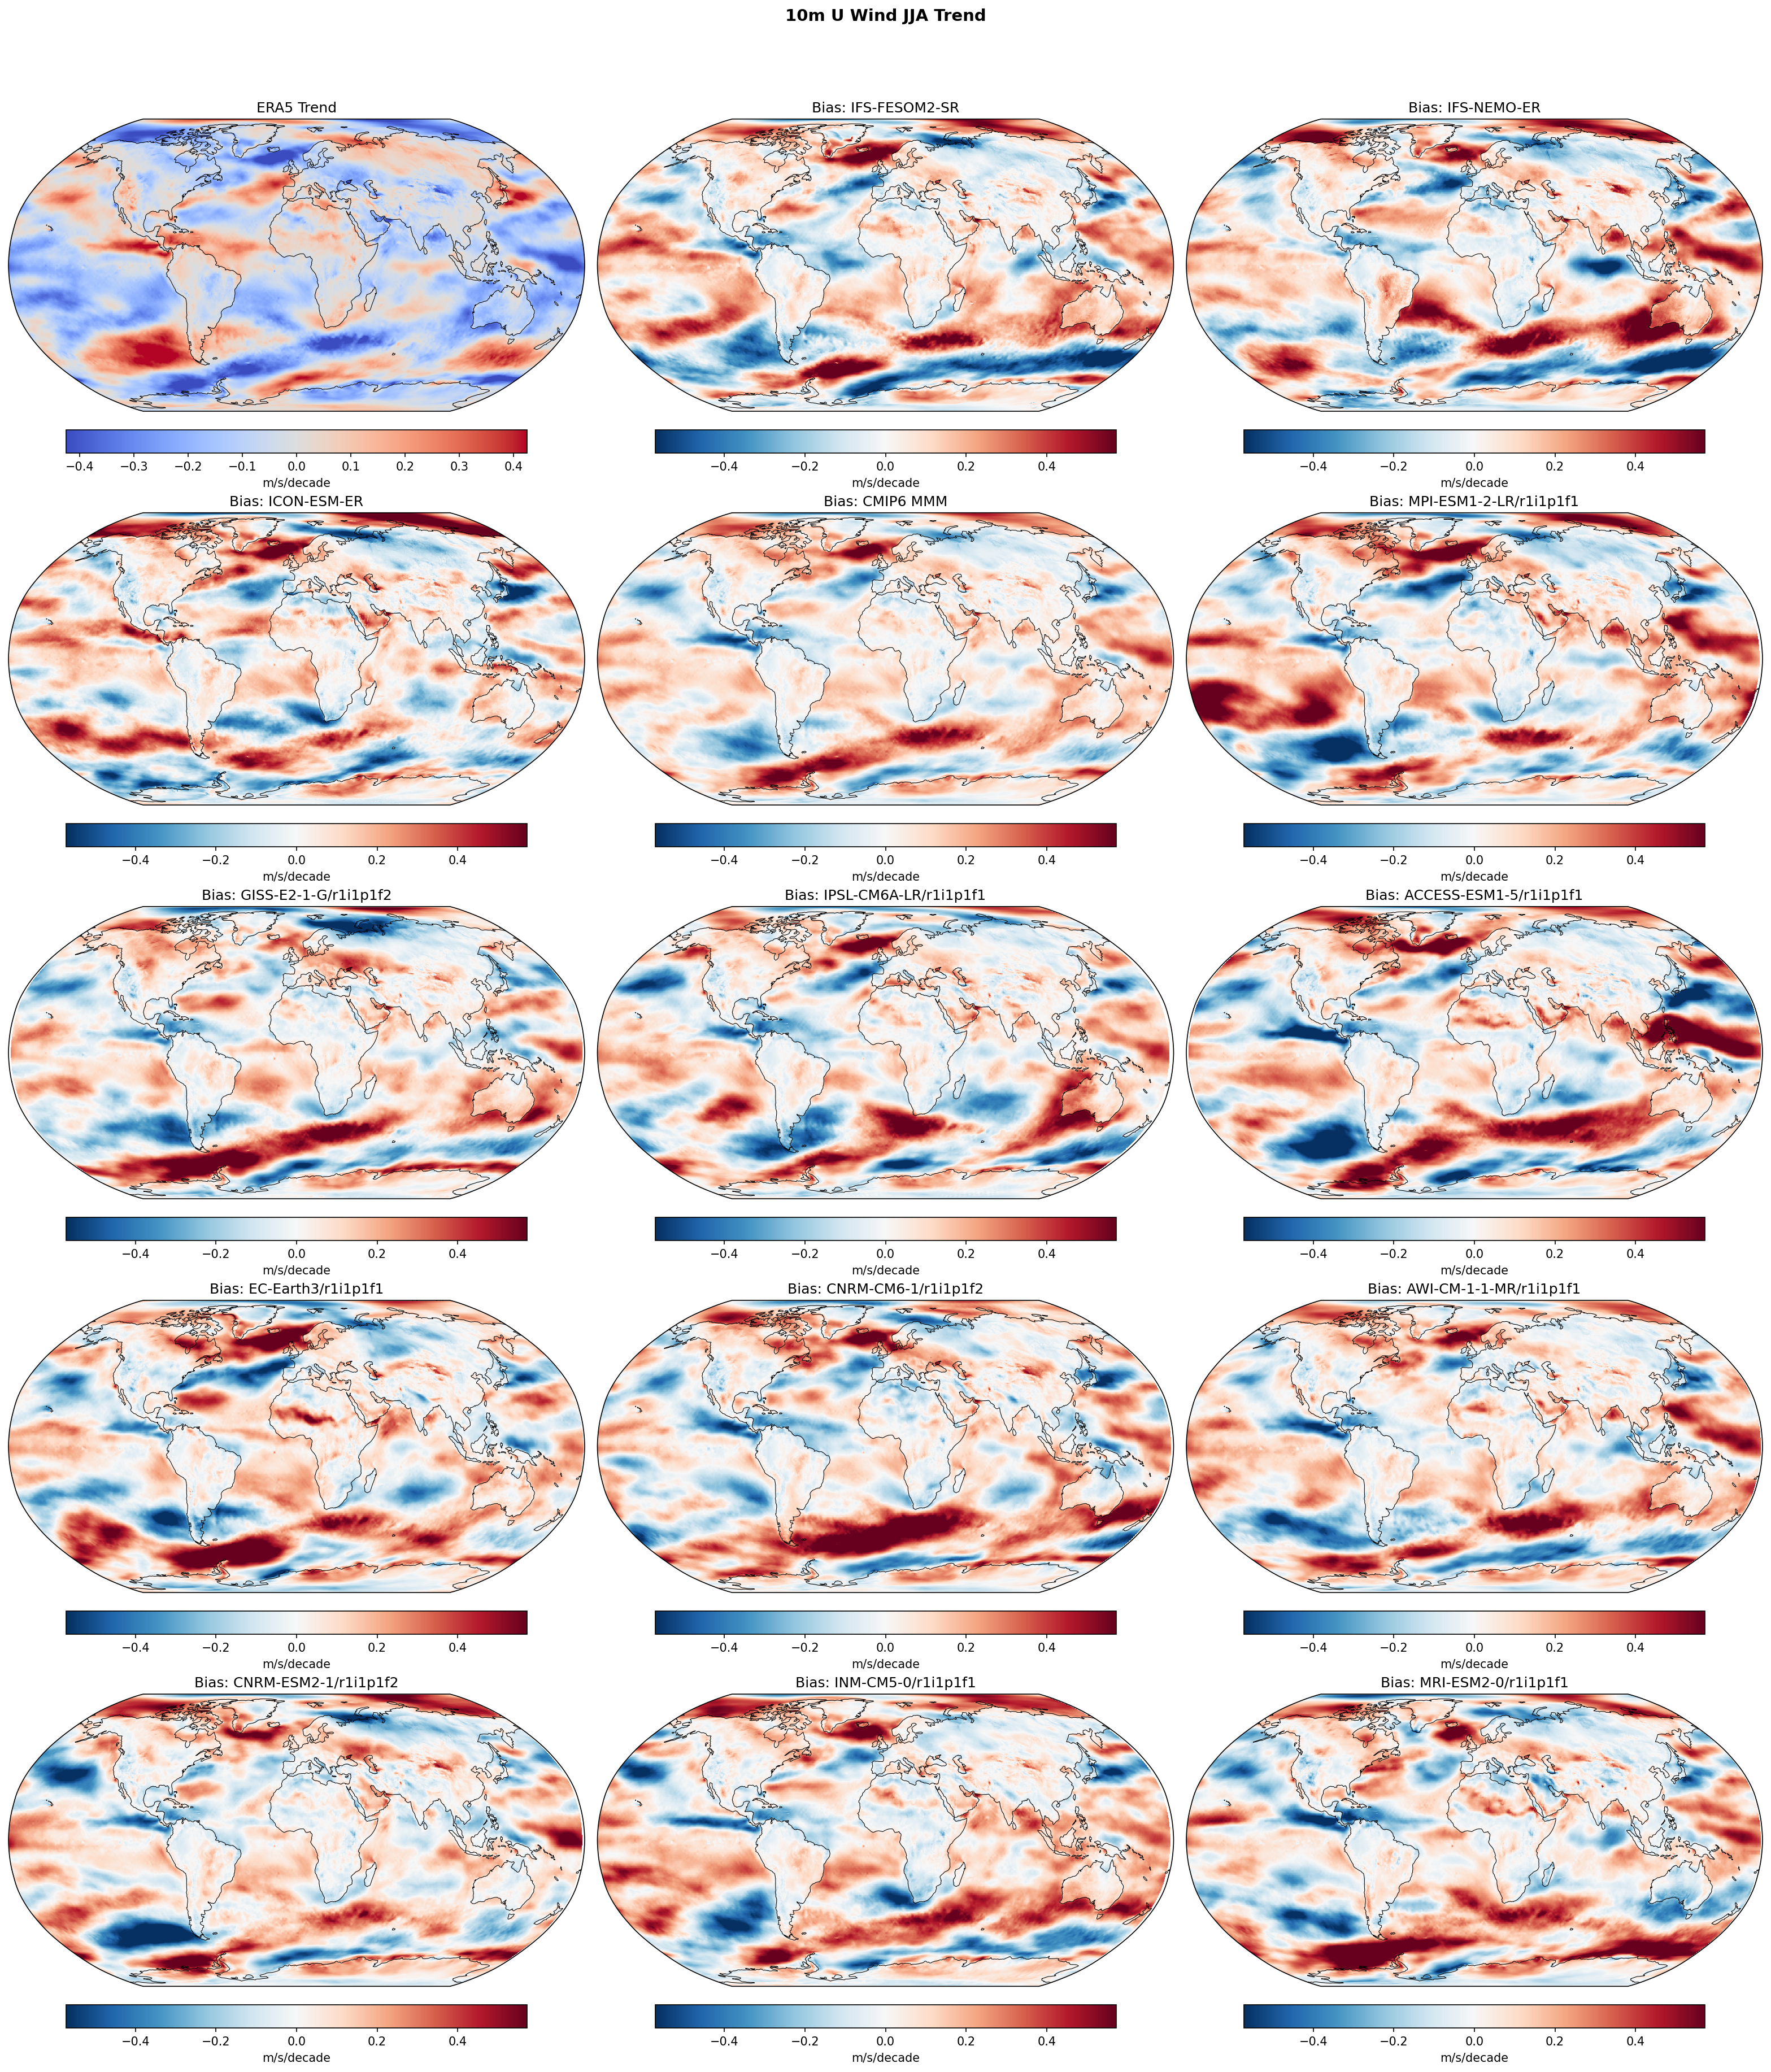
| Variables | uas |
|---|---|
| Models | IFS-FESOM2-SR, IFS-NEMO-ER, ICON-ESM-ER, CMIP6 MMM, MPI-ESM1-2-LR/r1i1p1f1, GISS-E2-1-G/r1i1p1f2, IPSL-CM6A-LR/r1i1p1f1, ACCESS-ESM1-5/r1i1p1f1, EC-Earth3/r1i1p1f1, CNRM-CM6-1/r1i1p1f2, AWI-CM-1-1-MR/r1i1p1f1, CNRM-ESM2-1/r1i1p1f2, INM-CM5-0/r1i1p1f1, MRI-ESM2-0/r1i1p1f1 |
| Reference Dataset | ERA5 |
| Units | m/s/decade |
| Period | 1980–2014 |
| CMIP6 MMM | Global Mean Trend Diff: 0.04 · Trend Rmse: None |
| MPI-ESM1-2-LR/r1i1p1f1 | Global Mean Trend Diff: 0.05 · Trend Rmse: None |
| GISS-E2-1-G/r1i1p1f2 | Global Mean Trend Diff: 0.04 · Trend Rmse: None |
| IPSL-CM6A-LR/r1i1p1f1 | Global Mean Trend Diff: 0.03 · Trend Rmse: None |
| ACCESS-ESM1-5/r1i1p1f1 | Global Mean Trend Diff: 0.04 · Trend Rmse: None |
| EC-Earth3/r1i1p1f1 | Global Mean Trend Diff: 0.05 · Trend Rmse: None |
| CNRM-CM6-1/r1i1p1f2 | Global Mean Trend Diff: 0.05 · Trend Rmse: None |
| AWI-CM-1-1-MR/r1i1p1f1 | Global Mean Trend Diff: 0.04 · Trend Rmse: None |
| CNRM-ESM2-1/r1i1p1f2 | Global Mean Trend Diff: 0.03 · Trend Rmse: None |
| INM-CM5-0/r1i1p1f1 | Global Mean Trend Diff: 0.06 · Trend Rmse: None |
| MRI-ESM2-0/r1i1p1f1 | Global Mean Trend Diff: 0.04 · Trend Rmse: None |
Summary high
This figure evaluates the linear trend in JJA 10m zonal wind (U-wind) over the period 1980–2014. The dominant feature is a systematic disagreement between models and ERA5 observations, particularly in the Tropical Pacific and Southern Ocean, where models consistently simulate more positive (westerly) trends than observed.
Key Findings
- **Tropical Pacific Trade Wind Discrepancy**: ERA5 (top-left) shows a strong negative trend (blue) in the equatorial Pacific, indicating strengthening trade winds (easterlies). All models, including EERIE high-res and CMIP6, exhibit strong positive biases (red) in this region, meaning they fail to capture this strengthening and instead simulate weakening or near-neutral trade wind trends.
- **Southern Ocean Westerly Bias**: There is a widespread positive trend bias (red) over the Southern Ocean across all models. While ERA5 shows mixed regional trends in JJA, models consistently project a stronger trend toward westerlies (positive U) than observed.
- **Lack of Resolution Impact**: The high-resolution EERIE models (IFS-FESOM2-SR, IFS-NEMO-ER, ICON-ESM-ER) display the same spatial bias patterns as the standard-resolution CMIP6 models, suggesting that increased resolution alone does not resolve these decadal trend discrepancies.
- **Global Positive Bias**: The global mean trend difference is positive for all listed models (approx. +0.03 to +0.06 m/s/decade), indicating a global systematic shift toward more westerly (or less easterly) flow in models compared to ERA5.
Spatial Patterns
The observation panel (ERA5) is characterized by a strong negative trend band in the equatorial Pacific and patchy trends elsewhere. The bias panels are overwhelmingly dominated by red colors (positive trend differences), indicating that model trends are systematically more positive (westerly) than observations. This 'red bias' is spatially coherent across the Pacific and Southern Hemisphere oceans in almost every panel.
Model Agreement
There is high agreement among models (both EERIE and CMIP6) regarding the sign and spatial structure of the trend bias. No individual model successfully reproduces the strong negative trend in the Pacific seen in ERA5; all show significant positive deviations.
Physical Interpretation
The discrepancy in the Tropical Pacific likely reflects the known 'cold tongue' or 'pattern effect' bias, where coupled climate models historically simulate an El Niño-like warming trend (weakening trades) in response to greenhouse gases, whereas the real world experienced a La Niña-like cooling trend (strengthening trades) over this period. In the Southern Hemisphere, the positive bias suggests models may be overestimating the strengthening of the eddy-driven jet (SAM positive trend) in JJA or that internal variability in the observed record opposes the forced response captured by models.
Caveats
- Decadal wind trends are strongly influenced by internal variability (e.g., IPO, PDO). Comparing a single observational realization against free-running coupled models (which have random internal phasing) can exaggerate discrepancies if the observed period coincides with a specific phase of internal variability.
- The analysis period (1980-2014) is relatively short for trend separation, making the distinction between forced signal and internal noise difficult.
10m V Wind Annual Linear Trend
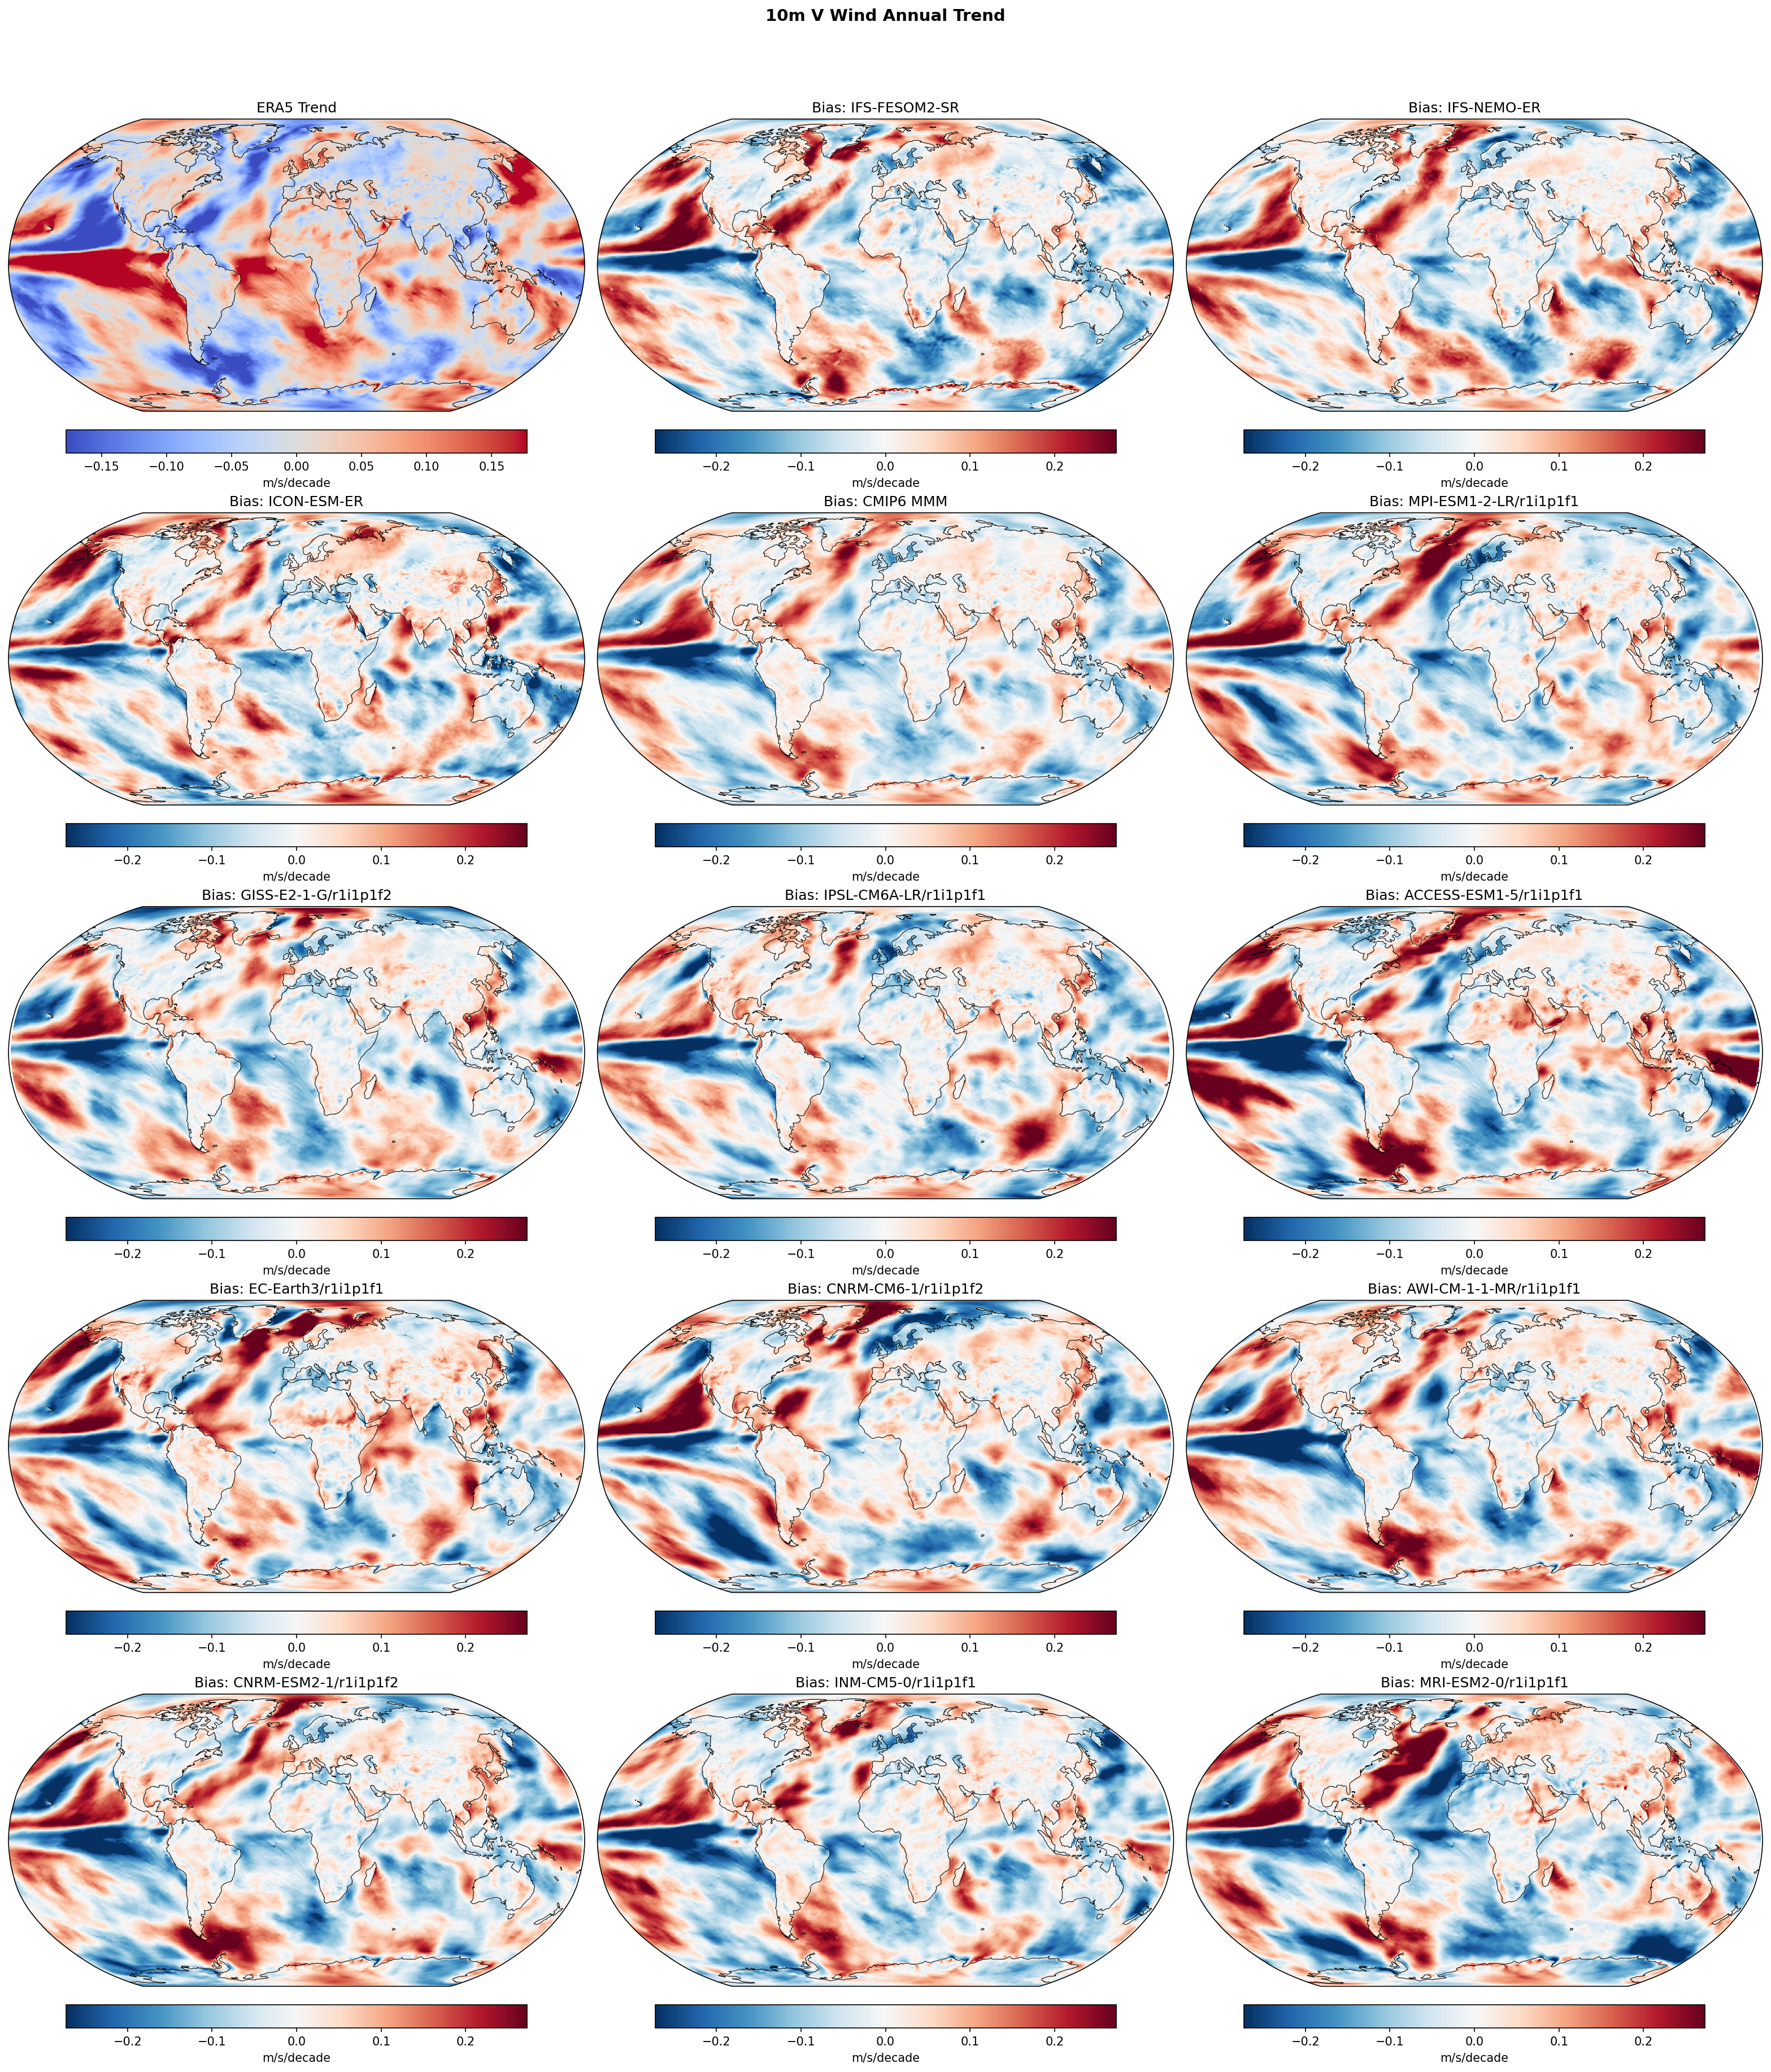
| Variables | vas |
|---|---|
| Models | IFS-FESOM2-SR, IFS-NEMO-ER, ICON-ESM-ER, CMIP6 MMM, MPI-ESM1-2-LR/r1i1p1f1, GISS-E2-1-G/r1i1p1f2, IPSL-CM6A-LR/r1i1p1f1, ACCESS-ESM1-5/r1i1p1f1, EC-Earth3/r1i1p1f1, CNRM-CM6-1/r1i1p1f2, AWI-CM-1-1-MR/r1i1p1f1, CNRM-ESM2-1/r1i1p1f2, INM-CM5-0/r1i1p1f1, MRI-ESM2-0/r1i1p1f1 |
| Reference Dataset | ERA5 |
| Units | m/s/decade |
| Period | 1980–2014 |
| IFS-FESOM2-SR | Global Mean Trend: 0.00 · Global Mean Trend Diff: -0.01 · Trend Rmse: 0.10 |
| IFS-NEMO-ER | Global Mean Trend: 0.01 · Global Mean Trend Diff: -0.00 · Trend Rmse: 0.10 |
| ICON-ESM-ER | Global Mean Trend: 0.01 · Global Mean Trend Diff: -0.00 · Trend Rmse: 0.10 |
| CMIP6 MMM | Global Mean Trend Diff: -0.01 · Trend Rmse: 0.09 |
| MPI-ESM1-2-LR/r1i1p1f1 | Global Mean Trend Diff: -0.00 · Trend Rmse: 0.10 |
| GISS-E2-1-G/r1i1p1f2 | Global Mean Trend Diff: -0.01 · Trend Rmse: 0.10 |
| IPSL-CM6A-LR/r1i1p1f1 | Global Mean Trend Diff: -0.01 · Trend Rmse: 0.09 |
| ACCESS-ESM1-5/r1i1p1f1 | Global Mean Trend Diff: 0.00 · Trend Rmse: 0.13 |
| EC-Earth3/r1i1p1f1 | Global Mean Trend Diff: 0.00 · Trend Rmse: 0.11 |
| CNRM-CM6-1/r1i1p1f2 | Global Mean Trend Diff: -0.01 · Trend Rmse: 0.11 |
| AWI-CM-1-1-MR/r1i1p1f1 | Global Mean Trend Diff: -0.01 · Trend Rmse: 0.11 |
| CNRM-ESM2-1/r1i1p1f2 | Global Mean Trend Diff: -0.01 · Trend Rmse: 0.10 |
| INM-CM5-0/r1i1p1f1 | Global Mean Trend Diff: -0.01 · Trend Rmse: 0.10 |
| MRI-ESM2-0/r1i1p1f1 | Global Mean Trend Diff: -0.01 · Trend Rmse: 0.12 |
Summary high
This diagnostic evaluates annual linear trends in 10m meridional (V) wind from 1980–2014, comparing ERA5 observations against high-resolution EERIE simulations and CMIP6 models. The analysis reveals substantial discrepancies between modeled and observed trends, particularly in the Tropical Pacific, where models fail to capture the observed circulation evolution.
Key Findings
- All models, including high-resolution EERIE simulations (IFS-FESOM2-SR, IFS-NEMO-ER, ICON-ESM-ER) and the CMIP6 ensemble, exhibit large systematic trend biases in the Tropical Pacific.
- The bias pattern is characterized by a dipole: a strong positive (northward) trend bias in the central/eastern North Pacific and a negative (southward) bias in the western/southern Pacific relative to ERA5.
- Trend RMSE values (~0.10 m/s/decade) are comparable to the magnitude of the observed trends themselves, indicating that free-running coupled models generally fail to reproduce the specific historical trajectory of surface wind changes over this 35-year period.
- Increased model resolution (EERIE vs. CMIP6) does not noticeably reduce these trend biases, suggesting the discrepancy is driven by factors other than spatial resolution (e.g., internal variability phasing).
Spatial Patterns
The dominant spatial feature is the disagreement in the Tropical Pacific. ERA5 likely shows strengthening trade winds (more southward V in NH, northward V in SH), while the positive bias in the NH tropics and negative bias in the SH tropics indicate the models underestimate this strengthening or simulate trends of the opposite sign.
Model Agreement
There is high consistency in the bias patterns across all models (inter-model agreement is high, agreement with observations is low). The EERIE models show bias structures very similar to the CMIP6 Multi-Model Mean.
Physical Interpretation
The widespread bias likely reflects the mismatch in multi-decadal internal variability phases (e.g., the Interdecadal Pacific Oscillation or IPO). The 1980–2014 observational period featured a strengthening of the Pacific Walker Circulation (La Niña-like trend), whereas free-running coupled models often simulate a weakening or neutral circulation trend in response to greenhouse gas forcing and do not synchronize their internal variability with the real world.
Caveats
- Comparing trends from free-running coupled models to a single observational realization over a short 35-year period is dominated by internal variability; 'bias' here largely indicates phase mismatch rather than purely structural model error.
- The sign of the bias depends on the sign convention of V-wind (positive northward); interpretation assumes standard meteorological conventions.
10m V Wind DJF Linear Trend
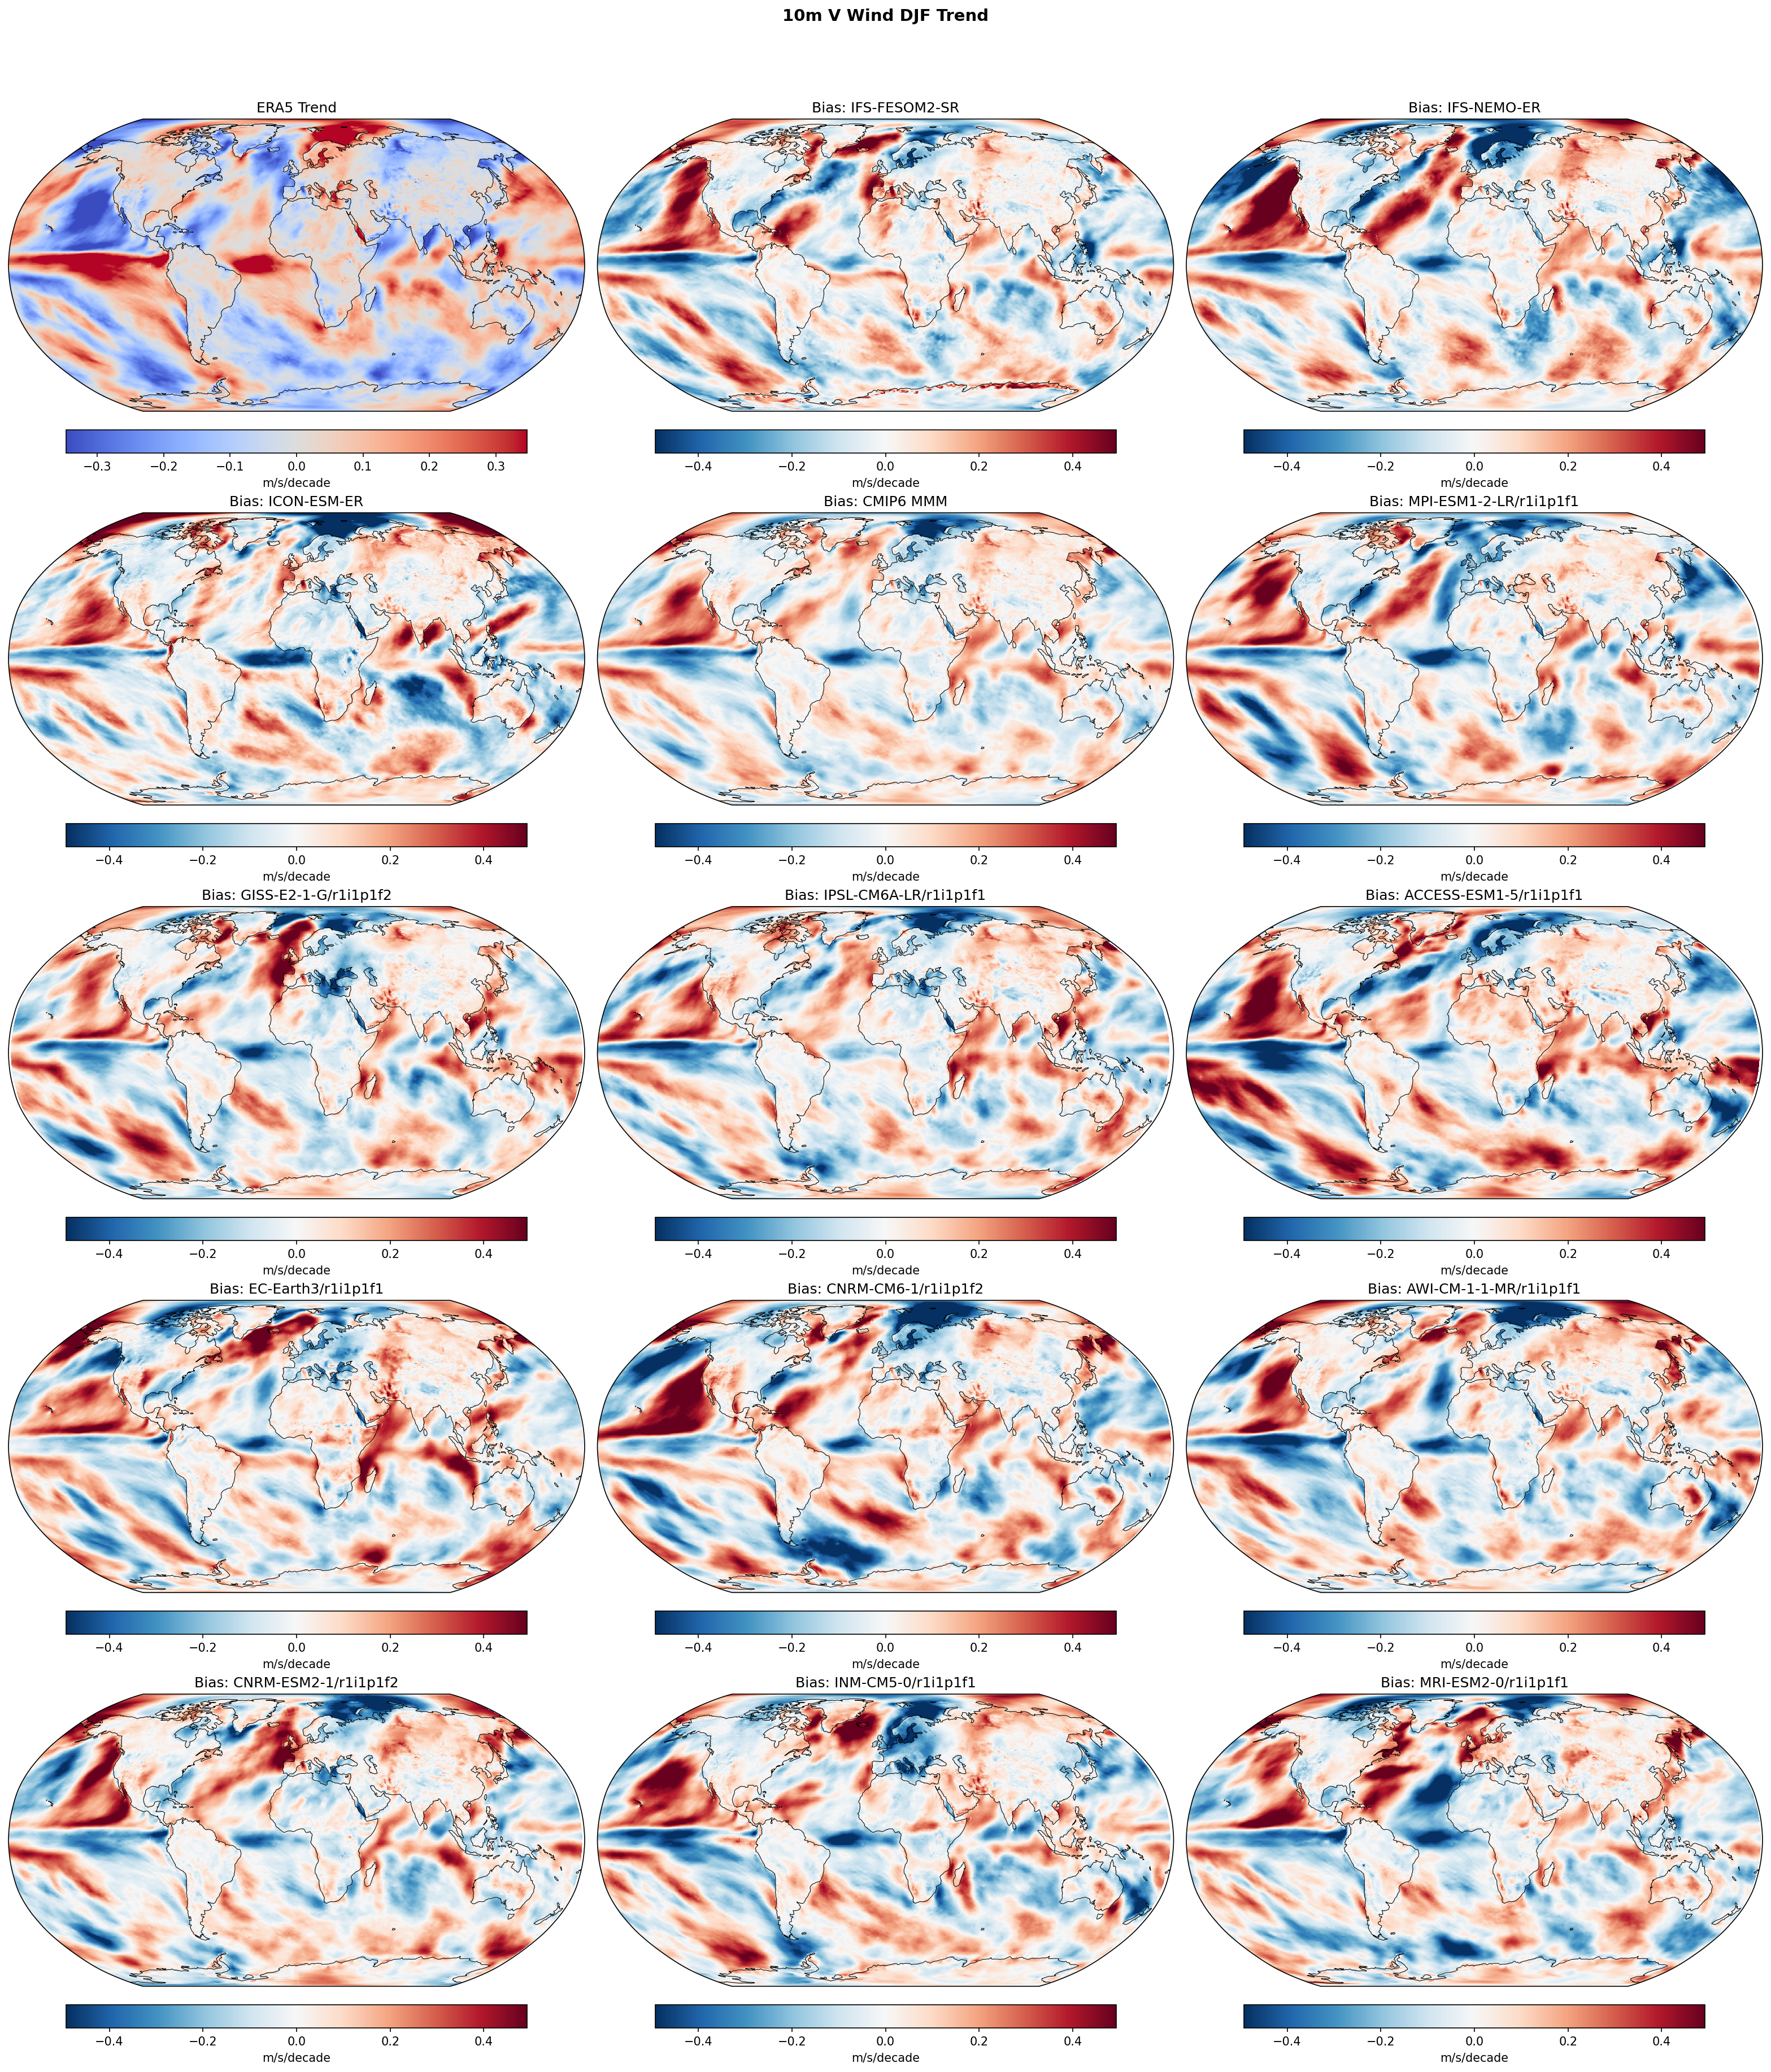
| Variables | vas |
|---|---|
| Models | IFS-FESOM2-SR, IFS-NEMO-ER, ICON-ESM-ER, CMIP6 MMM, MPI-ESM1-2-LR/r1i1p1f1, GISS-E2-1-G/r1i1p1f2, IPSL-CM6A-LR/r1i1p1f1, ACCESS-ESM1-5/r1i1p1f1, EC-Earth3/r1i1p1f1, CNRM-CM6-1/r1i1p1f2, AWI-CM-1-1-MR/r1i1p1f1, CNRM-ESM2-1/r1i1p1f2, INM-CM5-0/r1i1p1f1, MRI-ESM2-0/r1i1p1f1 |
| Reference Dataset | ERA5 |
| Units | m/s/decade |
| Period | 1980–2014 |
| CMIP6 MMM | Global Mean Trend Diff: 0.01 · Trend Rmse: None |
| MPI-ESM1-2-LR/r1i1p1f1 | Global Mean Trend Diff: 0.00 · Trend Rmse: None |
| GISS-E2-1-G/r1i1p1f2 | Global Mean Trend Diff: 0.01 · Trend Rmse: None |
| IPSL-CM6A-LR/r1i1p1f1 | Global Mean Trend Diff: 0.01 · Trend Rmse: None |
| ACCESS-ESM1-5/r1i1p1f1 | Global Mean Trend Diff: 0.02 · Trend Rmse: None |
| EC-Earth3/r1i1p1f1 | Global Mean Trend Diff: 0.02 · Trend Rmse: None |
| CNRM-CM6-1/r1i1p1f2 | Global Mean Trend Diff: 0.01 · Trend Rmse: None |
| AWI-CM-1-1-MR/r1i1p1f1 | Global Mean Trend Diff: 0.00 · Trend Rmse: None |
| CNRM-ESM2-1/r1i1p1f2 | Global Mean Trend Diff: 0.01 · Trend Rmse: None |
| INM-CM5-0/r1i1p1f1 | Global Mean Trend Diff: 0.01 · Trend Rmse: None |
| MRI-ESM2-0/r1i1p1f1 | Global Mean Trend Diff: -0.00 · Trend Rmse: None |
Summary high
This figure evaluates linear trends in DJF 10m meridional (V) wind over the period 1980–2014. It reveals a striking discrepancy where all models, regardless of resolution, fail to capture the observed multi-decadal trend patterns in the tropical Pacific.
Key Findings
- The observational trend (ERA5) exhibits a strong dipole in the tropical Pacific, with positive (southerly) trends near the dateline and negative (northerly) trends in the eastern Pacific.
- All models (IFS-FESOM, IFS-NEMO, ICON, and CMIP6) show bias patterns that are the inverse of the observed trend, indicating they do not reproduce the observed circulation changes.
- The magnitude of the trend differences (up to ±0.4 m/s/decade) exceeds the observed trends themselves, suggesting the model trends are either near-zero or opposite in sign to observations.
- High-resolution models (IFS, ICON) perform similarly to standard-resolution CMIP6 models, showing no clear benefit for capturing this specific decadal trend feature.
Spatial Patterns
The dominant feature is a 'negative-positive' bias dipole across the tropical Pacific (negative bias in central/west, positive bias in east) which mirrors the 'positive-negative' signal in the ERA5 observation. Similar inverse-of-obs bias patterns are visible in the North Atlantic and Southern Ocean.
Model Agreement
There is exceptionally high agreement among all models (EERIE and CMIP6) regarding the spatial structure of the trend bias. The CMIP6 Multi-Model Mean shows a smoother version of the same error pattern seen in individual high-resolution runs.
Physical Interpretation
The discrepancy is likely driven by the phase of internal decadal variability (e.g., IPO/PDO). The 1980–2014 period saw a strengthening of the Walker circulation and trade winds (La Niña-like trend) in observations that free-running coupled models, whose internal variability is not phased with the real world, do not systematically reproduce in response to historical forcing.
Caveats
- The analysis period (1980–2014) is relatively short and dominated by internal variability, so mismatches in trends are expected in free-running simulations and do not necessarily indicate structural model deficiencies.
10m V Wind JJA Linear Trend
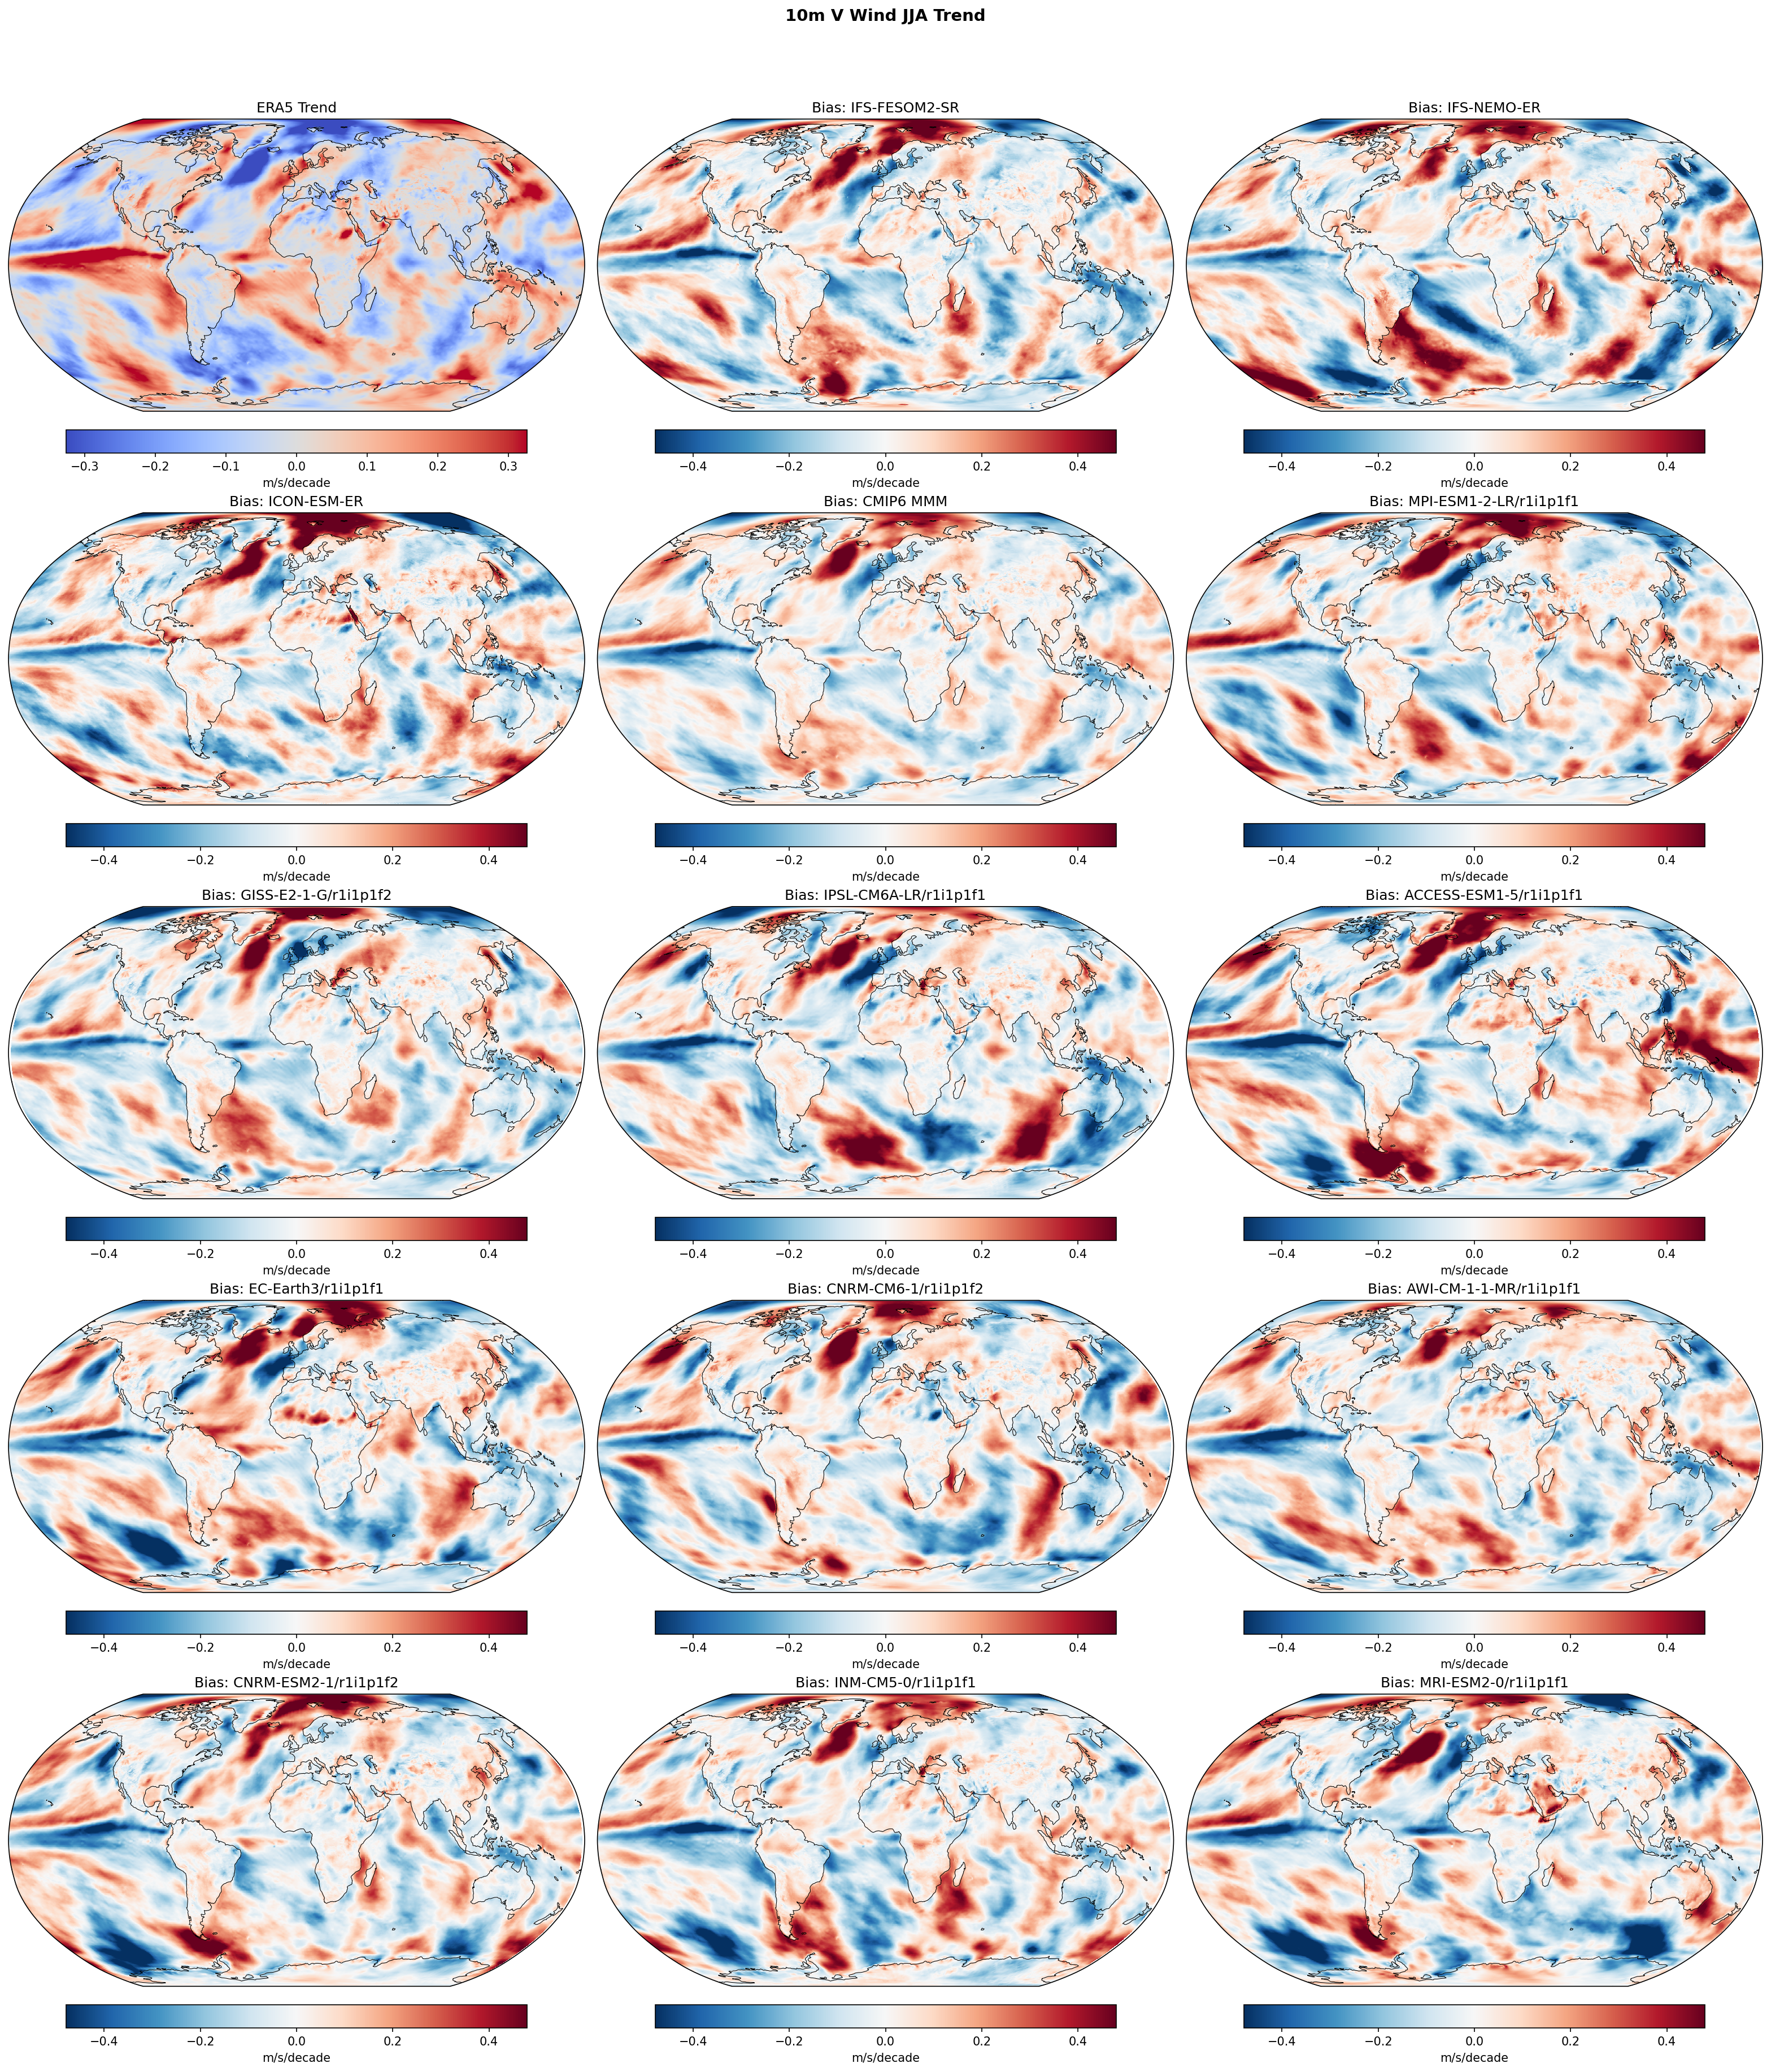
| Variables | vas |
|---|---|
| Models | IFS-FESOM2-SR, IFS-NEMO-ER, ICON-ESM-ER, CMIP6 MMM, MPI-ESM1-2-LR/r1i1p1f1, GISS-E2-1-G/r1i1p1f2, IPSL-CM6A-LR/r1i1p1f1, ACCESS-ESM1-5/r1i1p1f1, EC-Earth3/r1i1p1f1, CNRM-CM6-1/r1i1p1f2, AWI-CM-1-1-MR/r1i1p1f1, CNRM-ESM2-1/r1i1p1f2, INM-CM5-0/r1i1p1f1, MRI-ESM2-0/r1i1p1f1 |
| Reference Dataset | ERA5 |
| Units | m/s/decade |
| Period | 1980–2014 |
| CMIP6 MMM | Global Mean Trend Diff: -0.01 · Trend Rmse: None |
| MPI-ESM1-2-LR/r1i1p1f1 | Global Mean Trend Diff: 0.00 · Trend Rmse: None |
| GISS-E2-1-G/r1i1p1f2 | Global Mean Trend Diff: -0.01 · Trend Rmse: None |
| IPSL-CM6A-LR/r1i1p1f1 | Global Mean Trend Diff: -0.01 · Trend Rmse: None |
| ACCESS-ESM1-5/r1i1p1f1 | Global Mean Trend Diff: 0.01 · Trend Rmse: None |
| EC-Earth3/r1i1p1f1 | Global Mean Trend Diff: -0.00 · Trend Rmse: None |
| CNRM-CM6-1/r1i1p1f2 | Global Mean Trend Diff: -0.01 · Trend Rmse: None |
| AWI-CM-1-1-MR/r1i1p1f1 | Global Mean Trend Diff: -0.00 · Trend Rmse: None |
| CNRM-ESM2-1/r1i1p1f2 | Global Mean Trend Diff: -0.01 · Trend Rmse: None |
| INM-CM5-0/r1i1p1f1 | Global Mean Trend Diff: -0.01 · Trend Rmse: None |
| MRI-ESM2-0/r1i1p1f1 | Global Mean Trend Diff: -0.02 · Trend Rmse: None |
Summary high
This figure compares the linear trends in JJA 10m meridional (V) wind over the period 1980–2014 from ERA5 reanalysis against three high-resolution EERIE models (IFS-FESOM2-SR, IFS-NEMO-ER, ICON-ESM-ER) and a selection of CMIP6 models.
Key Findings
- There is substantial disagreement between modeled and observed regional wind trends, with model-observation trend differences (biases) reaching magnitudes (>0.4 m/s/decade) comparable to the observed trends themselves.
- The high-resolution EERIE models (IFS and ICON variants) exhibit similar magnitudes of trend discrepancy to the standard-resolution CMIP6 models, showing no obvious advantage in capturing the specific historical realization of regional trends over this period.
- The CMIP6 Multi-Model Mean (MMM) bias map is notably smoother and lower in amplitude than any individual model panel, indicating that the large regional discrepancies in individual models are dominated by unforced internal variability rather than systematic model errors.
Spatial Patterns
ERA5 shows distinct trend features in the Tropical Pacific (e.g., strengthening trades/circulation changes) and wave-like patterns in the Southern Ocean. The model difference maps are dominated by large-scale, high-amplitude dipoles in the Pacific and Southern Oceans. For instance, the IFS and ICON models show a prominent negative (northerly) trend bias relative to observations in the central/eastern equatorial Pacific.
Model Agreement
Agreement between models and observations is low, and inter-model agreement is also limited. Each model simulation produces a distinct spatial pattern of trends, consistent with the stochastic nature of internal decadal variability.
Physical Interpretation
The 1980–2014 period included significant internal variability signals (e.g., phases of the IPO/PDO) and a strengthening of Pacific trade winds that free-running coupled models are not constrained to reproduce in phase. The 'bias' maps therefore primarily reflect the mismatch between the specific observed realization of internal variability and the random phases generated by the models, rather than errors in climate sensitivity or forced response.
Caveats
- A 35-year period is relatively short for trend analysis and is dominated by internal variability; 'biases' here likely do not represent structural model flaws.
- Comparison is against a single observational realization (ERA5); without large ensembles for the EERIE models, separating forced trends from internal noise is difficult.